Article Text

Abstract
Objective: To present a geographic information systems (GIS) method for exploring the spatial pattern of injuries and to demonstrate the utility of using this method in conjunction with classic ecological models of injury patterns.
Design: Profiles of patients’ socioeconomic status (SES) were constructed by linking their postal code of residence to the census dissemination area that encompassed its location. Data were then integrated into a GIS, enabling the analysis of neighborhood contiguity and SES on incidence of injury.
Setting: Data for this analysis (2001–2006) were obtained from the British Columbia Trauma Registry. Neighborhood SES was calculated using the Vancouver Area Neighborhood Deprivation Index. Spatial analysis was conducted using a join–count spatial autocorrelation algorithm.
Patients: Male and female patients over the age of 18 and hospitalized from severe injury (Injury Severity Score >12) resulting from an assault or intentional self-harm and included in the British Columbia Trauma Registry were analyzed.
Results: Male patients injured by assault and who resided in adjoining census areas were observed 1.3 to 5 times more often than would be expected under a random spatial pattern. Adjoining neighborhood clustering was less visible for residential patterns of patients hospitalized with injuries sustained from self-harm. A social gradient in assault injury rates existed separately for men and neighborhood SES, but less than would be expected when stratified by age, gender, and neighborhood. No social gradient between intentional injury from self-harm and neighborhood SES was observed.
Conclusions: This study demonstrates the added utility of integrating GIS technology into injury prevention research. Crucial information on the associated social and environmental influences of intentional injury patterns may be under-recognized if a spatial analysis is not also conducted. The join–count spatial autocorrelation is an ideal approach for investigating the interconnectedness of injury patterns that are rare and occur in only a small percentage of the population.
Statistics from Altmetric.com
Studies have routinely shown that intentional injuries are more prevalent among the young and people from adverse socioeconomic status (SES) backgrounds.1–6 There is also growing concern that people living in disadvantaged neighborhoods experience a heightened risk of exposure to violence and are more susceptible to experiencing depression and hopelessness.7–9 This evidence corroborates the interconnected social and material gradients in health first presented in The Black report.10 In Canada and many nations, injury is the leading cause of death among people under the age of 45 and the leading cause of potential years of life lost, with indirect and direct costs estimated at over $C12.7 billion.11 Clearly efforts to better understand and reduce injury inequity are needed.
Using spatial autocorrelation, it is possible to identify the contiguity or spatial connection between areas with similar or dissimilar injury patterns.12–15 Spatial analysis can provide valuable supporting evidence for the influence of the social environment in increasing individual injury rates and offers a means to explore injury patterns beyond classic ecological models alone. A spatial autocorrelation technique that systematically looks at injury patterns that do not exhibit a Gaussian (eg, normal curve) spatial process has not been reported to date. Injuries, moreover, typically do not fit a normal distribution. The join–count autocorrelation test can be used to measure small-area variations in injury patterns and is particularly useful for exploring the patterns of health outcomes that are rare and occur in only a small percentage of the total population. Using this approach, intentional injury records from a large metropolitan population in Canada are explored for significant socioeconomic and spatial clustering.
AIMS AND OBJECTIVE
Using patient data from greater Vancouver, British Columbia (BC), the aim of this study is to demonstrate the utility of geographic information systems (GIS) techniques for exploring small-area spatial patterns of intentional injuries within a large urban metropolitan area. The specific objective of this research is to present a method for measuring spatial “clustering” and use this technique alongside classic ecological statistics models to determine to what extent GIS offers prevention epidemiologists a more nuanced understanding of the influences of place and health.
METHODS
Setting
Data for this analysis were based on aggregated 5-year patient records (2001–2006) from the British Columbia Trauma Registry (BCTR) stemming from intentional third-party and self-harm injury. The BCTR is the most detailed source of small-area information for severely injured patients in the province, compiling patient data from nine accredited trauma hospitals in British Columbia. The BCTR houses data on patient characteristics, injury location and mechanism, aspects of acute care, and outcome on all people injured from multisystem injury requiring 3 or more days of hospitalization and with an Injury Severity Score greater than 12. Intentional injury records were extrapolated from the injury mechanism field using ICD-10 classification codes. Records were assessed using groupings stratified for sex and age (18–34; 35–54; 55 and over). Patient records were not sub-classified further according to the specific injury mechanism (eg, blunt/penetrating).
Injury occurrences were contrasted against patient neighborhood of residence in contrast with the injury locations. Accumulating evidence suggests that unmasking the social, economic, and physical conditions of everyday life is central to understanding individual health outcomes.1617 Thus, modeling material and meaningful dimensions of individual health outcomes has become an important component of injury prevention efforts.18–21 Such investigations capture, in broad terms, the embedded context of our routine encounters with others and particularly the influential impact these encounters have over the entire life course—ultimately pointing to the processes that create health inequalities and the graded nature of their production.22
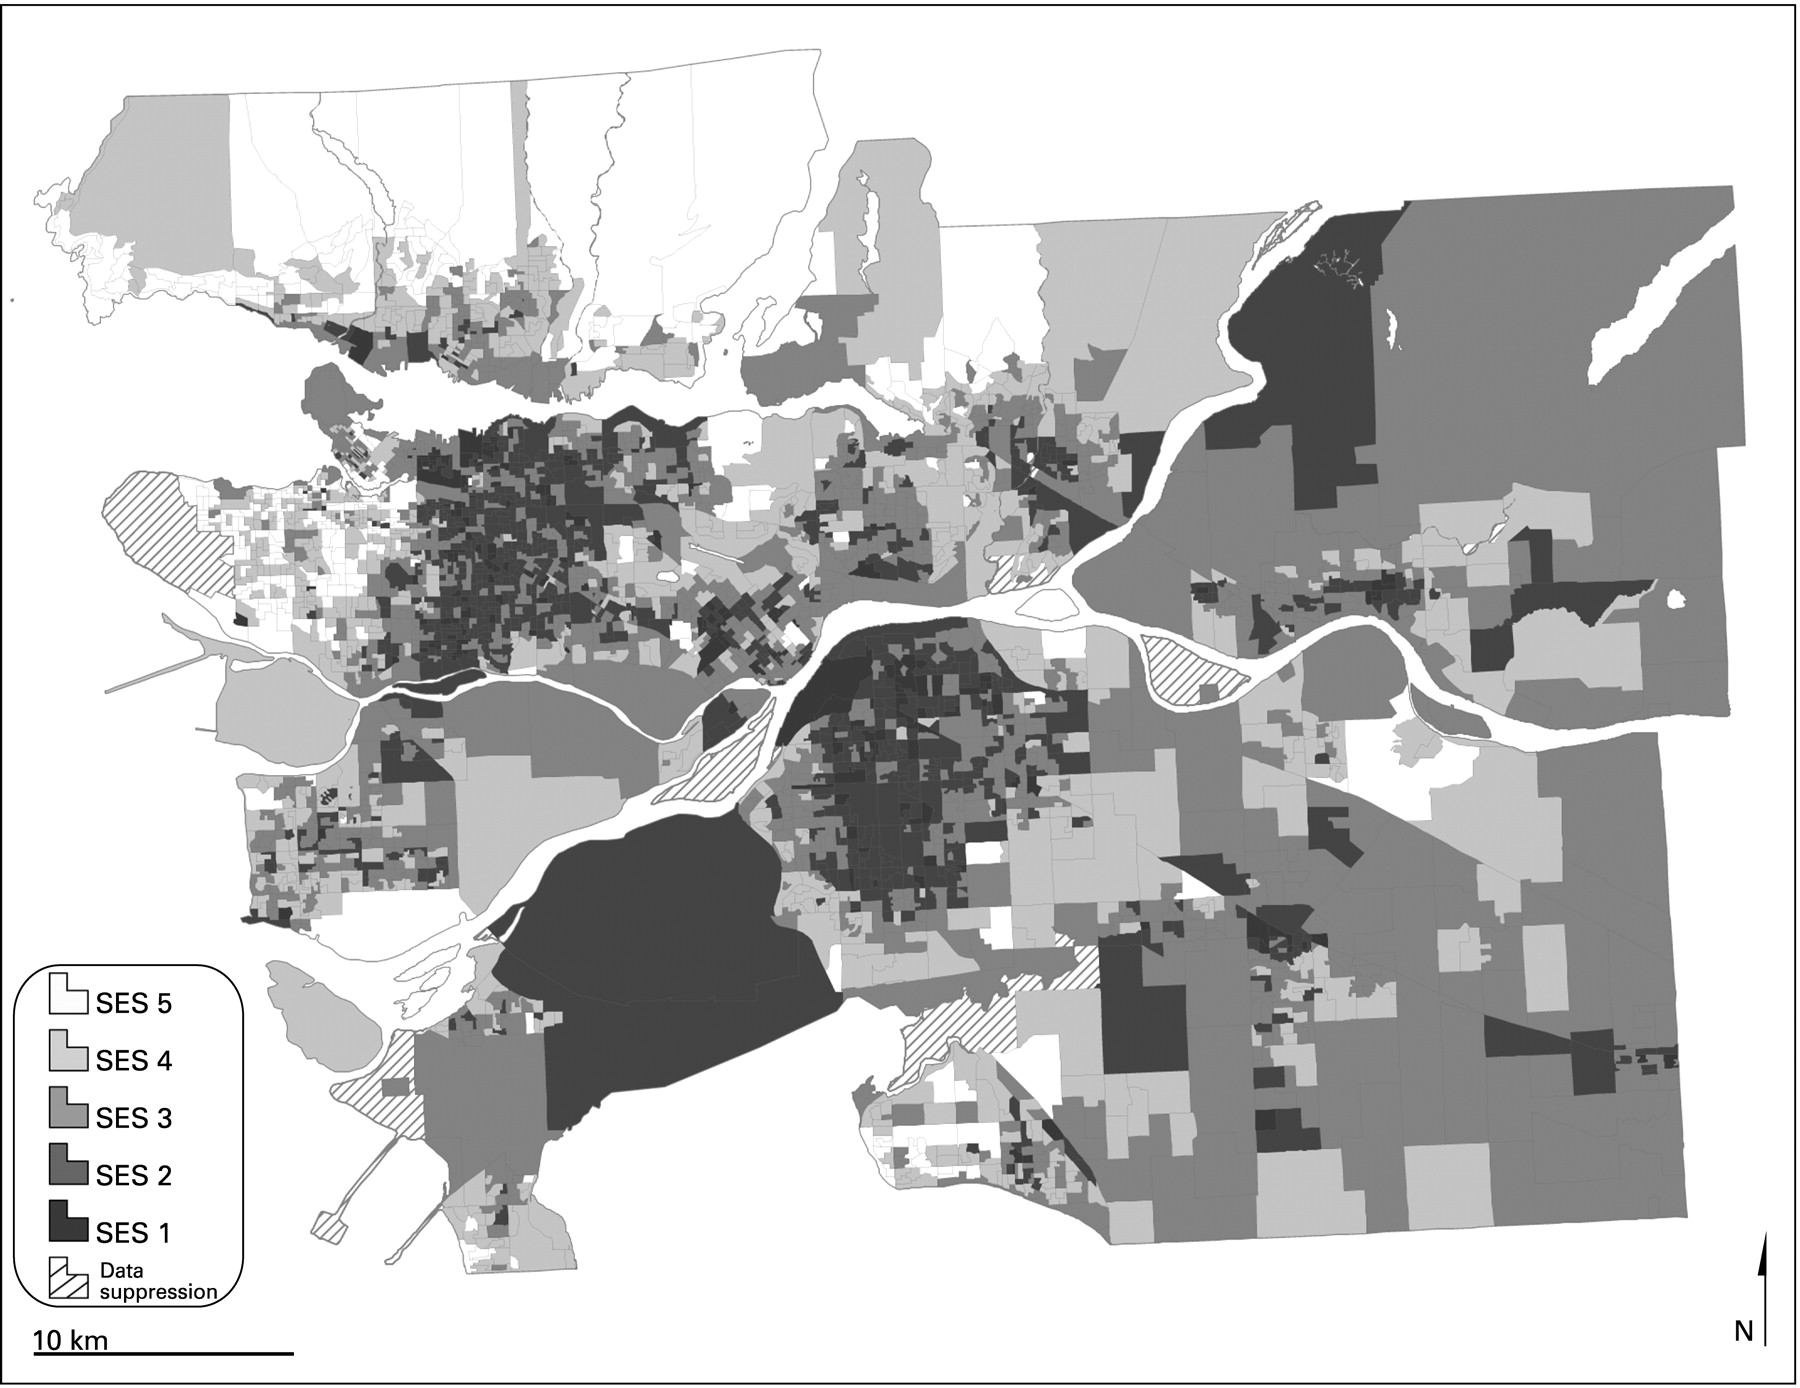
In this analysis, neighborhood SES was assessed from the Vancouver Area Neighbourhood Deprivation Index (VANDIX). We previously developed the VANDIX on the basis of a survey of provincial medical health officers asking about census indicators that best characterize health and socioeconomic outcomes in BC.23 The VANDIX is based on the aggregation of the seven most often cited variables as selected by the medical health officers: the proportion of the population without a high school education, the unemployment rate, the proportion of the population with a university degree, families headed by a lone parent, home ownership, average income, and the unemployment ratio. Proportional weights were assigned to each indicator on the basis of frequency of survey responses. Patient hospitalization records were aggregated into the corresponding dissemination area (DA) collection boundary that encapsulated their home postal code. In Canada, DAs are the smallest collection boundary for which population socioeconomic information can be extracted. DAs are roughly the size of a small number of neighborhood blocks within high-density urban areas and increase in size when encompassing lower density suburban and rural populations. On average, a single DA encapsulates a population of 600 residents within greater Vancouver.
Analysis
This analysis has two parts. Firstly, using GIS, we analyzed the degree of spatial clustering of intentional injuries, which was assessed by the patient’s neighborhood of residence using a join–count autocorrelation test. Secondly, we fitted a generalized log-linear model to the SES and intentional injury data. DAs with fewer than 250 residents were excluded from both the spatial and socioeconomic analysis because of SES data suppression in the census.
Join–count conceptual framework
Global spatial autocorrelation statistics, or second-order spatial effects models, are similar in scope to traditional descriptive statistics such as the mean or the standard deviation, but are specific only to how the data are arranged in space. Similar to a classic correlation coefficient, the autocorrelation outcome statistic acts as an indication of broad spatial trends. A positive coefficient reflects near areas with similarly large or small values, and negative coefficients reflect near areas with large inverse values. Positive autocorrelation observations symbolize strong clustering of events, whereas negative observations suggest dispersion. Typically, tests for spatial autocorrelation are applied in one of two ways: as a preliminary analysis on a set of raw data values, or as a supplementary analysis on residual values from regression analyses. The former is designed for exploratory data analysis, whereas the latter provides a mechanism to determine the likelihood that estimates of the standard error are deflated because of confounding effects caused by their location.
The join–count statistic is the only global autocorrelation test specifically designed to measure the spatial arrangement of sparse outcome data. The statistic is derived from three primary components classically referenced as the number of BB, WW, or BW joins. A BB join represents the number of neighboring polygons (eg, census collection areas) where no-one was injured, WW joins represent the number of incidents where two people living in adjacent areas were injured, and BW the number of incidents in which a person was injured in one area, but no-one was injured in the connecting area. In practice, the BB and WW counts are recoded as 0 and 1 to aid computational processing (fig 1). The join–count test statistic is constrained by how the polygon intersections are derived in the GIS and the context by which the number of observed joins between neighboring areas is contrasted from the expected number of joins. For irregular polygons, such as census collection boundaries, the polygon joins are measured using Boolean logic whereby a join is defined by the number of neighboring polygons that share a common line segment.

Building autocorrelation methods for binary data
A binary contiguity matrix was constructed to test the likelihood that the spatial pattern of DAs encompassing people hospitalized from intentional injury were significantly non-random. The binary contiguity matrix was assigned using sampling without replacement, and so the probability of the presence or absence of an injury is constrained by the total number of census polygons included in the analysis. The standard error of the expected number of BB, WW, or BW joins gauges whether differences between the observed and expected joins are significantly different from random. The number of expected joins is calculated by


where subscript B and W refer to the number of black and white polygon joins, and J denotes the total number of observed joins between areas.
The standard errors of the observed joins, OBB, OWW, and OBW, under randomized sampling are


where B, W, and J are as previously defined and L represents the total number of links between polygons (eg, polygons AB and polygons BA). Note that L is a constant and always denoted as twice the number of joins. From the classic test statistic

it is possible to derive the likelihood that the number of OBB, OWW, and OBW are either significantly clustered or dispersed. If there are more BB and WW joins than BW joins, the pattern will tend to exhibit stronger clustering rather than dispersion, with the inverse being true of BW patterns. A more detailed definition of the join–count algorithm can be found elsewhere.24–26 We constructed the join–count algorithm for this research using VBA computer scripting language inside the ArcGIS 9.x software designed by the Environmental Systems Research Institute.
Log-linear model
A generalized log-linear model was used to measure relative risk of intentional injury against area SES using SPSS V15. The log-linear model was used to account for the small number of intentional injuries in greater Vancouver relative to the total census population. Incidence of injury was stratified by age and gender and assessed using quintile scores based on the VANDIX, with the most affluent areas coded SES 5 and the most deprived areas coded SES 1. Male and female patients aged 55 and older and living in SES 5 areas were used as the reference category.
RESULTS
Of the 3283 DAs above the population threshold used for this analysis, 339 contained at least one person hospitalized from an assault compared with 79 containing at least one person who was hospitalized from a self-inflicted injury. Dummy variables were constructed for DAs with more than one person injured from an assault (n = 41) or self-harm (n = 3). Severe injuries resulting from sexual assault by bodily force (n = 1) and injuries stemming from legal intervention (n = 12) were excluded from the database before analysis. Additional records (n = 97) where the residential postal code was either missing or attributed to someone without a residence were also omitted.
Table 1 lists spatial autocorrelation statistics for patients’ neighborhood of residence. Throughout greater Vancouver, people hospitalized from a severe assault-related injury resided in neighboring areas 1.7 times more often than would be expected under a random spatial pattern (zww = 7.67, p = 0.05). When stratified by age, men aged 18–34 were 1.4 times more likely to reside in neighboring areas (zww = 2.63, p = 0.05). Neighborhood clustering of male patients increased to roughly three and five times more than would be expected under a random spatial pattern for both men aged 35–54 and those over the age of 55 (z = 8.22ww, p = 0.05; z = 3.70ww, p = 0.05). No significant clustering or dispersion patterns were found for assault injuries among female patients. Figure 2 illustrates assault-related injuries by neighborhood of residence.

Intentional injury from self-harm among men and women of all ages followed less significant spatial patterns than assault injuries (z = 1.59bw, p>0.05), and there was no occurrence of spatial clustering when stratified by age and gender. Non-random spatial patterns of self-inflicted injuries for men aged 18–34 were observed (z = 1.88 bw, p = 0.06), but the significance of the spatial pattern did not indicate clustering beyond a general non-random pattern. Figure 3 illustrates intentional self-harm injury patterns by neighborhood of residence.
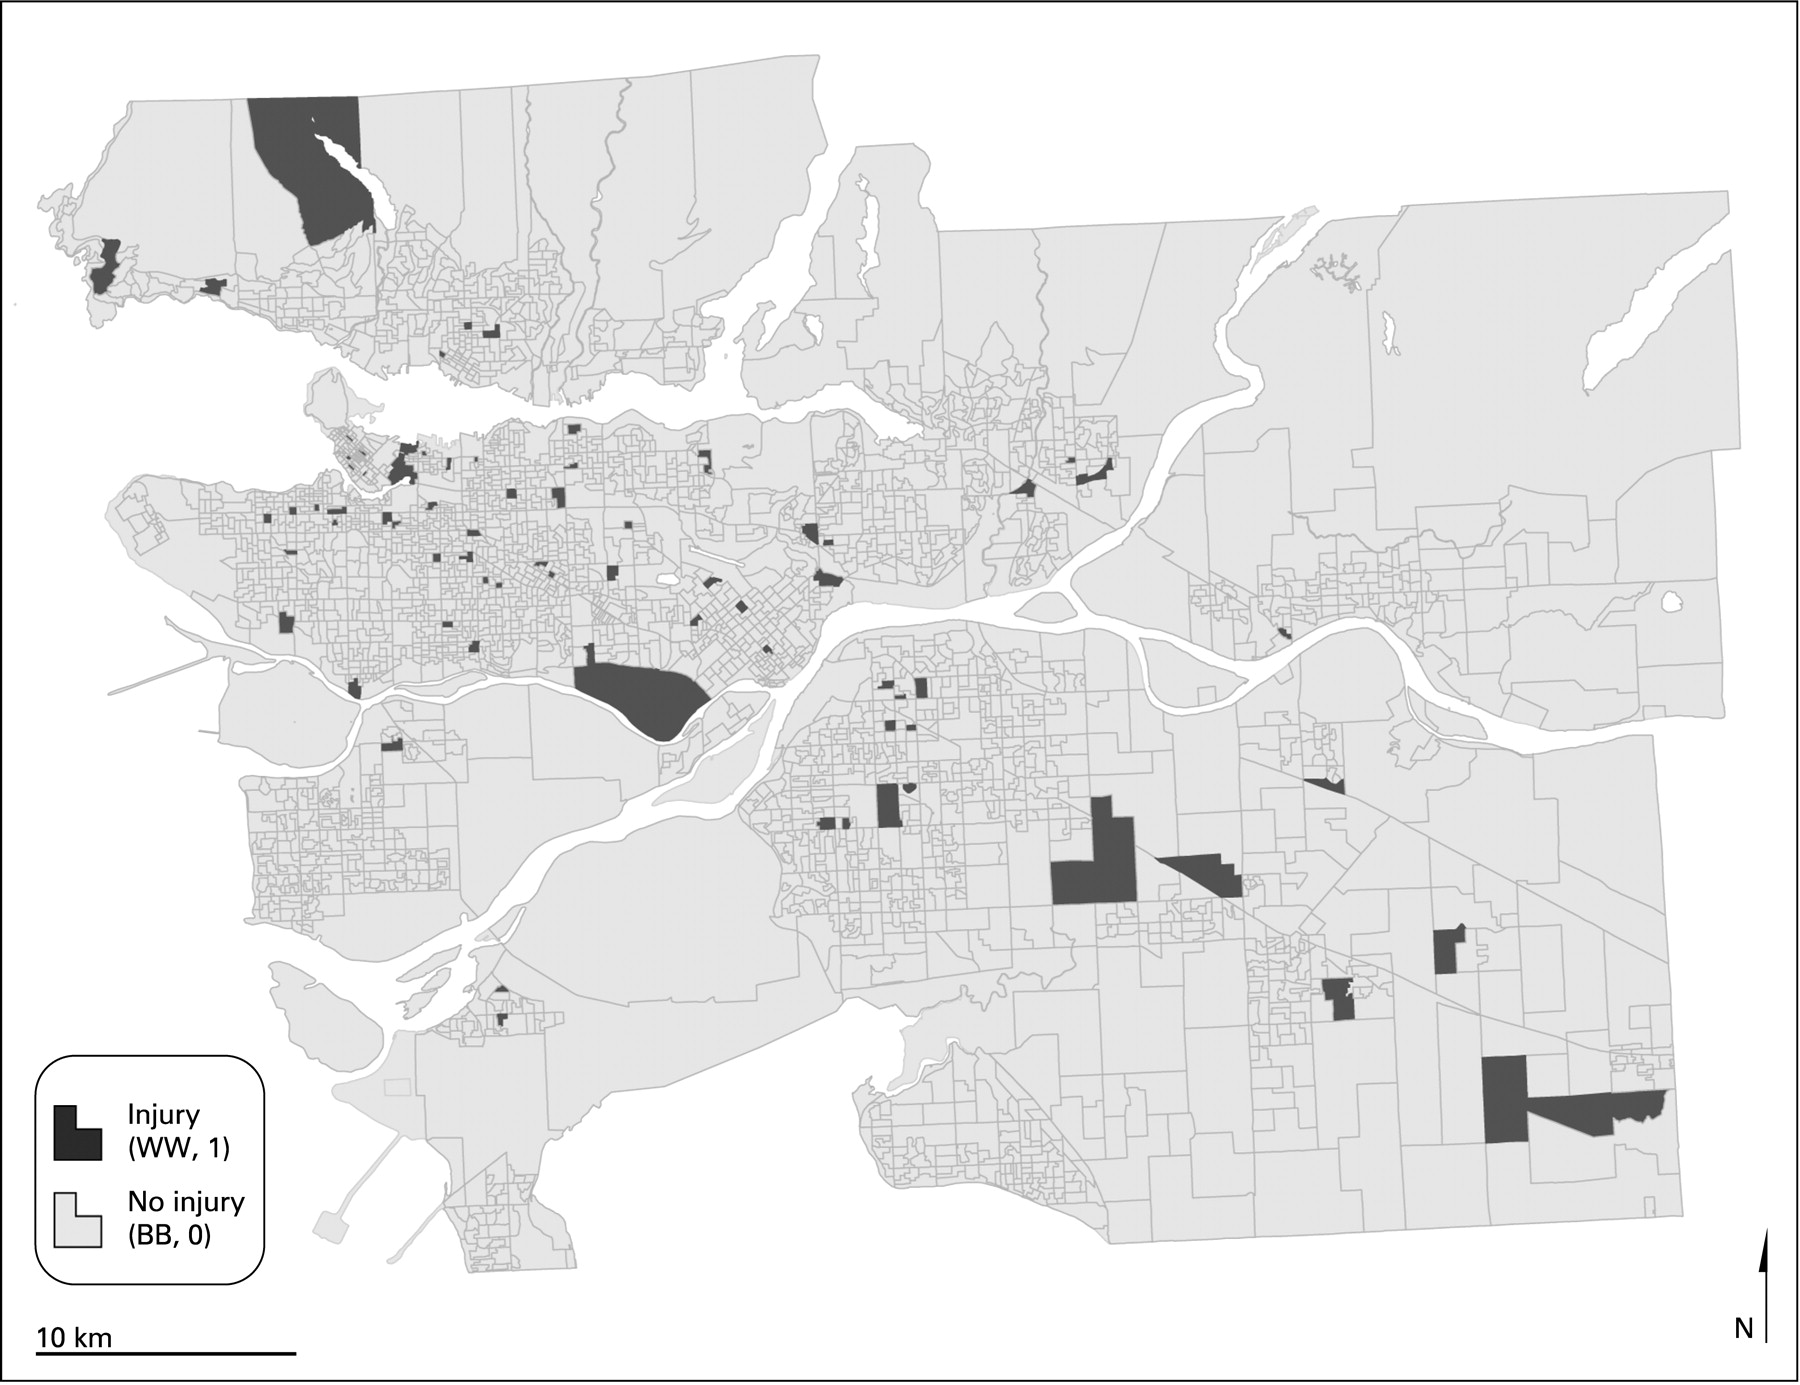
Table 2 lists the odds ratios from the log-linear model. Men under the age of 35 were five times more likely to be hospitalized from a severe assault injury than men over the age of 55. Area SES was also a statistically significant indicator of increased incidence of assault-related injury among men of all ages, with rates two to nearly four times higher for those living in areas coded as the most socioeconomically deprived (SES 1 and SES 2) relative to the most affluent areas (SES 5). Only among men aged 35–54 who were severely injured from an assault and living in SES 1 neighborhoods were hospitalization rates higher than would be expected given the singular relationship between assault, age group, and neighborhood SES alone. No significant singular or cross-level effect between assault, age, and neighborhood SES was observed among female patients. Similarly, no statistically significant relationships were observed in the odds ratios for hospitalizations from self-inflicted injuries among men or women of all ages. Figure 4 is a map of neighborhood SES for greater Vancouver generated from the VANDIX.

DISCUSSION
The primary aim of this paper was to provide an in-depth illustration of a GIS spatial autocorrelation technique that might serve as a catalyst for further research in injury prevention. The autocorrelation tests illustrated that severe intentional injuries stemming from assault largely follow distinct clusters throughout greater Vancouver, but that this pattern was considerably less pronounced for injuries sustained from intentional self-harm. A particular feature of this study that enabled these separate findings was the use of the join–count autocorrelation algorithm.
In this study, the lack of a social and spatial pattern among intentional self-harm injuries is a significant finding. Recent studies suggest that greater risk of subsequent suicidal behavior for adolescents and young adults stems from factors associated with living in areas that experience population loss 27 and growing up in a family environment characterized by socioeconomic adversity and exposure to adverse, dysfunctional, or abusive childhood environments,28 but this evidence has also produced mixed results when modeled using socioeconomic data taken from the census.29–32
Key points
Intentional injuries are more prevalent among the young and people from adverse socioeconomic backgrounds.
This evidence also produces mixed results when attempts are made to identify patterns of intentional self-harm injuries using socioeconomic data taken from the census.
A geographic information system (GIS) spatial autocorrelation algorithm designed for mapping rare (eg, non-Gaussian) or binary data enabled the identification of distinct patterns of intentional self-harm injury that might not have been observed if assessed using classic ecological models alone.
GIS technology is an underused tool in prevention epidemiology and there is a need for stronger recognition of the spatial aspects of injury patterns.
The majority of neighborhoods (n = 65, 83%) encompassing the home address of a patient hospitalized from a severe injury sustained from self-harm had not experienced a population loss in the 5 years preceding the 2001 census. Similarly, the census areas that encompassed the patients’ postal code are all primarily high or semi-urban population areas, reducing the likelihood that the results from this study are confounded owing to a rural/urban divide. The log-linear model highlighted a structural variation in many of the core socioeconomic indicators thought to characterize increased prevalence of intentional injuries and also adds to the literature on possible limitations of census data to produce meaningful indicators of suicide behavior. In addition, when viewed in conjunction with the varied spatial pattern in the data, the results from this study indicate that intentional self-harm injuries affect a highly invisible population. This is a significant finding, possibly reflecting a unique structural variation between the conditions that give rise to para-suicide and suicide mortality. A more detailed survey of these specific neighborhoods may reveal whether these variations can be ascribed to general population trends elsewhere.
Although this study has demonstrated the added utility of the join–count autocorrelation test researchers should be aware of two shortcomings ubiquitous to all autocorrelation coefficients. Global autocorrelation coefficients are initial exploratory data analysis techniques and only provide a general indication of the degree of clustering of a measurable outcome across the entire study area. More localized indicators of spatial autocorrelation should be used to specifically indicate which areas confound standard errors in the regression coefficient between area SES and incident rates.33 In addition, the join–count autocorrelation statistic is not sensitive to geographic size, and care should be taken if the approach is used to ascribe meaning from adjacencies between large geographic areas (eg, state boundaries, health authority units) as well as other caveats related to the modifiable areal unit problem.3435
To date, spatial autocorrelation of injury patterns has primarily been accounted for using Moran’s I calculation, but this method is inappropriate for obtaining statistically reliable information from health outcome data that cannot be transformed to fit a “normal” distribution. The join–count spatial autocorrelation statistic is an underused GIS spatial analysis technique and is ideal for exploring the spatial connectivity of injury patterns that are rare relative to the total population. The algorithm is potentially useful for an array of trauma services and injury prevention research, ranging from highlighting specific regional injury mortality variations between rural and urban populations to aiding in the placement of community outreach or rehabilitation programs. Although many health outcome data would be more suitably addressed using other spatial autocorrelation techniques, spatial statistic algorithms specifically designed to handle binary data are another means for quantifying the significance of location.
Research on the aetiology and environmental determinants of intentional injuries is still emerging.3637 These studies may be further enriched if also explored using geographic information technology. One of many strengths of GIS is that it often builds on traditional analytical methods while recognizing that these events may also be spatially linked. The integration of sophisticated spatial analysis into prevention epidemiology is an important component of modern public health research into injury surveillance and prevention. The join–count spatial autocorrelation test is one of many spatial analysis algorithms that can be used in injury prevention strategies to target areas where risk is concentrated.

Acknowledgments
NB wrote the final draft of the manuscript, conducted all statistical and spatial analysis, and drafted the manuscript’s tables and figures. NS helped draft all versions of the manuscript and helped guide each stage of this research project. MH was instrumental in conceptualizing the framework for this research. NB will serve as guarantor of this research paper.
REFERENCES
Footnotes
Funding: This research was funded through a grant from the Mathematics of Information Technology and Complex Systems (MITACS).
Competing interests: None.