Article Text

Abstract
Background/aims: This paper focuses on the methods used to develop indicators for “all injury” incidence for the New Zealand Injury Prevention Strategy (NZIPS), launched in June 2003. Existing and previously proposed New Zealand national non-fatal injury indicators exhibited threats to validity.
Population/setting: The total population of New Zealand.
Methods: The authors proposed fatal and new non-fatal injury indicators for “all injury” based on national mortality and hospitalizations data. All of the candidate indicators were subjected to a systematic assessment of validity, using the International Collaborative Effort on Injury Statistics (ICE) criteria. Based on the results of that validation, the authors identified four proposed NZIPS indicators.
Results: The proposed “all injury” indicators were as follows: age standardized injury mortality rate per 100 000 person-years at risk; number of injury deaths; age standardized serious non-fatal injury rate per 100 000 person-years at risk; and number of cases of serious non-fatal injury. The authors identified no threat-to-validity when assessed against the ICE criteria. The estimated numbers and rates of serious non-fatal injury increased over the period, in contrast to the numbers and rates of fatal injury.
Conclusion: The authors have proposed serious non-fatal injury indicators that they judge suffer substantially less bias than traditional non-fatal injury indicators. This approach to indicator development is consistent with the view that before newly proposed indicators are promulgated, they should be subjected to formal validation. The authors are encouraged that the New Zealand Government has accepted these arguments and proposed indicators, and are starting to act on some of their recommendations, including the development of complementary indicators.
- ACC, Accident Compensation Corporation
- ICD, WHO International Classification of Diseases
- ICE, International Collaborative Effort on Injury Statistics
- ICISS, ICD-based Injury Severity Score
- MVTC, motor vehicle traffic crash
- NMDS, National Minimum Data Set
- NZHIS, New Zealand Health Information Service
- NZIPS, New Zealand Injury Prevention Strategy
- WHO, World Health Organization
- indicators
- incidence
- validity
- national policy
Statistics from Altmetric.com
- ACC, Accident Compensation Corporation
- ICD, WHO International Classification of Diseases
- ICE, International Collaborative Effort on Injury Statistics
- ICISS, ICD-based Injury Severity Score
- MVTC, motor vehicle traffic crash
- NMDS, National Minimum Data Set
- NZHIS, New Zealand Health Information Service
- NZIPS, New Zealand Injury Prevention Strategy
- WHO, World Health Organization
The New Zealand Injury Prevention Strategy (NZIPS) was launched in June 2003. This work was commissioned by the NZIPS Secretariat to provide the government with indicators to monitor the progress of the NZIPS in reducing injury over the lifetime of the strategy. We were asked to propose indicators of injury incidence that focus on “all injury” as well as for the six priority areas identified in the NZIPS, namely: assault, work related injury, intentional self-harm, falls, motor vehicle traffic crashes (MVTCs), and drowning. This paper focuses on the methods of development of indicators for “all injury”. By “all injury”, we mean injury resulting from all causes, all activities, in all locations, for all ages.
An earlier national review had identified and proposed several fatal and non-fatal injury indicators “to inform on injuries in New Zealand at a high level”.1 These indicators included numbers and rates of deaths. They also included numbers and rates of hospitalized injuries. The use of hospitalizations as the basis for non-fatal injury indicators can be misleading, however.2–4 Admission to hospital is influenced not only by severity of injury, but also by a number of extraneous factors, including bed/theatre availability, professional practice, and access to hospital services.5 Consequently, trends in these hospitalized injury indicators over time may be due to changes in these extraneous factors rather than changes in the incidence or severity of injury, as illustrated in a recent paper describing MVTC indicators.6
This problem has been recognised for several years and potential solutions to identifying non-fatal injury indicators have been debated in the literature.2,3,5,7,8,9,10 The work described in this paper offers a solution to this problem.
This paper includes a description of the process of development of our proposed indicators, the “all injury” indicators that we developed, and the response of the New Zealand Government to these indicators. The paper represents a summary of our report to the NZIPS Secretariat.11 The figures presented here have been updated since the publication of this report to include the most up-to-date data as well as baselines for each indicator showing an estimate of the indicator value immediately before the introduction of the strategy.
METHODS
For “all injury” and for each of the six priority areas, we used the following methods to identify candidate indicators:
-
We identified existing national indicators through a named contact within the lead agency for the NZIPS priority area.
-
We suggested fatal and non-fatal injury indicators for “all injury” and then sought similar indicators for each of the priority areas.
-
We subjected all of the candidate indicators to a systematic assessment of validity, using the ICE criteria.12
-
Based on the results of that validation, we identified proposed and/or provisional indicators for each priority area.
Note that there were no provisional indicators included among the “all injury” indicators; therefore none are described in this paper. For some priority areas it was necessary to designate the indicators as provisional where, for example, the only indicators that could be identified posed some threat to validity. We have used the term validity to mean the degree to which the indicator measures what it is intended to measure.13
The ICE validation criteria, agreed at a meeting in Washington DC in 2001, suggest that an ideal indicator should:12
-
have a case definition based on diagnosis—on anatomical or physiological damage;
-
focus on serious injury;
-
have, as far as possible, unbiased case ascertainment;
-
be derived from data that are representative of the target population;
-
be based on existing data systems (or it should be practical to develop new data systems);
-
be fully specified.
These criteria were developed solely in the context of indicators of injury incidence and, within that, on the characteristics of the incident cases. It was further agreed at the 2001 ICE meeting that the fewer criteria that are satisfied, the more likely it is that the indicator will exhibit some threats to validity.
Each of the above criteria were used to assess the validity of existing, previously proposed, and our newly proposed “all injury” indicators. This was achieved by each of the principal authors of the original report (C Cryer, J Langley, and S Stephenson, Injury Prevention Research Unit, University of Otago, New Zealand) independently assessing the candidate indicators against these criteria.
Sources of data
The goal was to develop indicators that draw attention to “important” injury as judged by their resulting in death, or because of their threat-to-life.
Fatal injury indicators
New Zealand Health Information Service (NZHIS) Mortality data (based on death registrations and Coroner’s reports) were used as the basis for the fatal injury indicators.
Non-fatal injury indicators
NZHIS National Minimum Data Set (NMDS), a database which records information on all publicly funded hospital discharges in New Zealand, was used as the source for potential non-fatal indicators. The NZHIS NMDS excludes cases that are funded privately. There are only a small number of privately funded incident cases that are not captured by the NMDS14 so their exclusion should have little affect on the validity of the indicators.
Injury definition
For the reasons explained in one of our previous publications,4 cases of injury were identified as those that had a principal diagnosis of injury, and were first admissions. Hospital admissions with 0 days stay were included, but only if they satisfied our operational definition of a serious injury (see below).
The following ICD-10 code ranges were used for the operational definition of an injury for the non-fatal injury indicators:
-
principal diagnosis: S00-T78 and
-
first external cause: V01-Y36.
For the fatal injury indicators, the operational definition of an injury was an underlying cause of death in the range V01-Y36.
Serious non-fatal injury definition
The non-fatal indicators proposed were based on cases that were hospitalized with an ICD-based Injury Severity Score (ICISS)15 of less than or equal to 0.941. This is equivalent to selecting patients who, at admission, have injuries that give the patient a survival probability of 94.1% or worse—in other words, a probability of death (at admission) of at least 5.9%. For New Zealand data, this represents around 15% of all injury discharges. This severity threshold includes the majority of the following injuries: fracture of the neck of femur, intracranial injury (excluding concussion only injury), injuries of nerves and spinal cord at neck level, multiple fractures of the ribs, asphyxia, hypothermia, and many other injury diagnoses of similar severity or which are more serious. The full list can be found in an appendix to the report to the NZIPS Secretariat.11
Rates, confidence intervals, and baselines
Rates are expressed as per 100 000 person-years. Population data were obtained from Statistics New Zealand population estimates (http://www.stats.govt.nz). Rates were age adjusted to compensate for societal changes in the age distribution of the population over time. Ninety five percent confidence intervals for counts assume Poisson error, and for age standardized rates they were produced using methods specified in the text of Clayton and Hills.16 Baselines for the non-fatal injury indicators were calculated as the average of the 2001–03 indicator values. In the absence of 2003 and 2004 mortality data, the provisional baselines shown for the fatal injury indicators were the average of 2001 and 2002 indicator values.
Consultation
During the development of the indicators, we consulted with the NZIPS project team, NZIPS advisory groups, and with selected representatives from within New Zealand, as well as with the international research community.
RESULTS
The proposed “all injury” indicators were as follows:
-
age standardized injury mortality rate per 100 000 person-years at risk;
-
number of injury deaths;
-
age standardized serious non-fatal injury rate per 100 000 person-years at risk;
-
number of cases of serious non-fatal injury.
Absolute numbers reflect the societal burden of injury, while rates reflect individual risk.
The unanimous findings by the assessors were that these four indicators satisfy all of the ICE criteria:
-
They have a case definition based on diagnosis.
-
They focus on serious injury, defined by their fatal outcomes, or defined as a probability of death at admission of 5.9% or greater.
-
Case ascertainment was judged to be largely unbiased for the deaths. For the non-fatal injury indicators, the severity threshold was chosen at this high level so that the injuries captured have a very high probability of admission—thus minimizing bias in ascertainment.
-
They were derived from data sources that are representative of the target population (all ages, all circumstances of injury).
-
They are based on existing data systems; namely the national mortality and hospitalizations data managed by NZHIS.
-
They are fully specified; specifications include the scope, the sources and descriptions of the numerator and denominator data, and the method of calculation of the indicator.
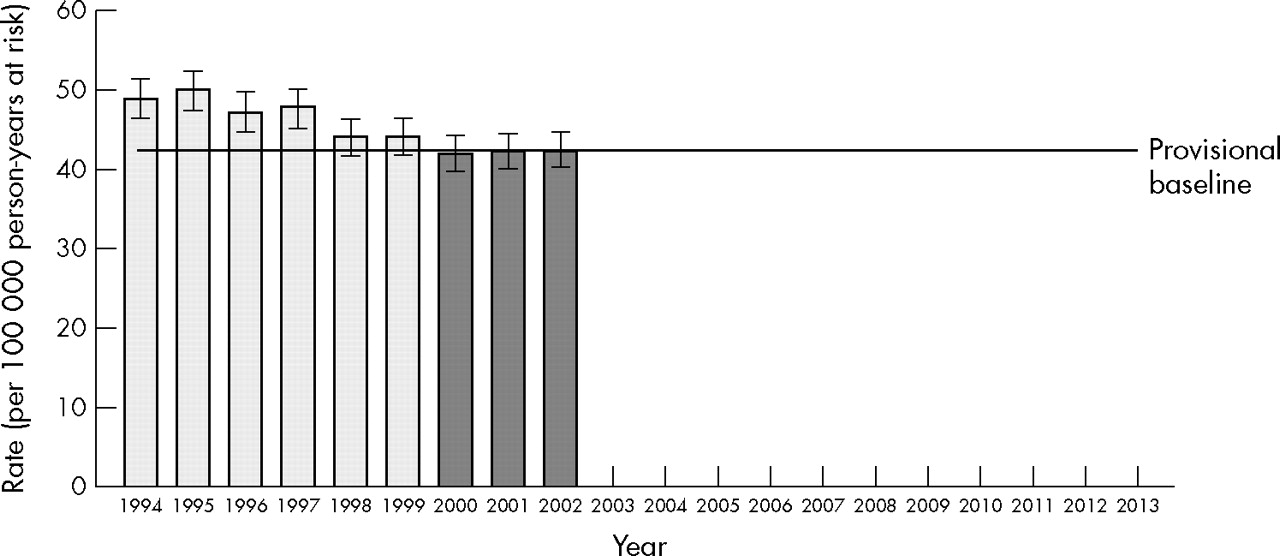
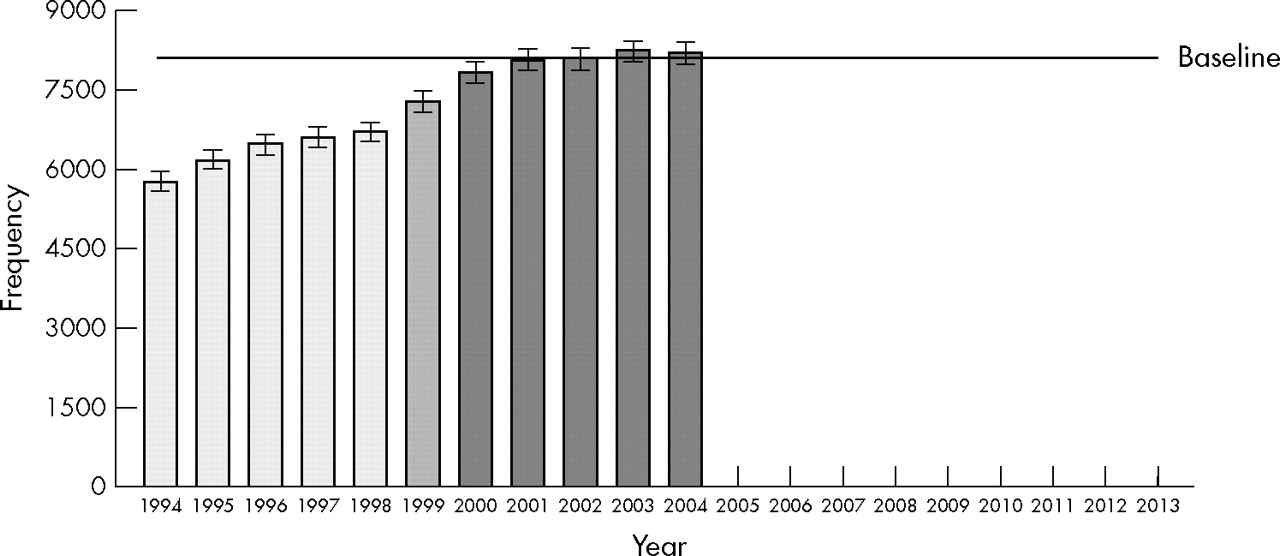
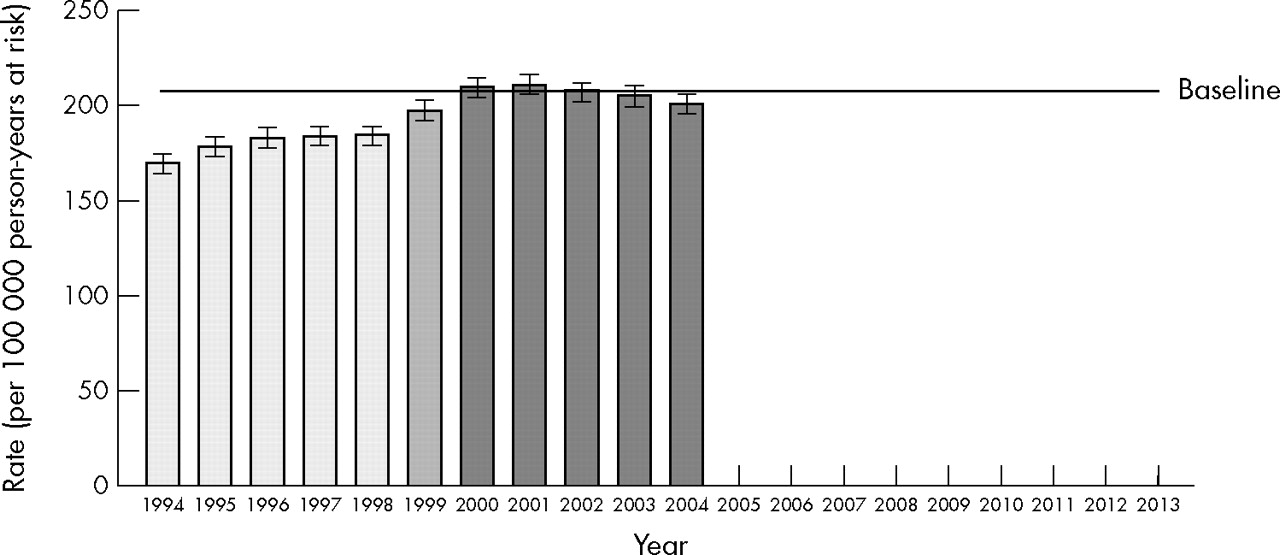
Figures 1 to 4 show trends in the four “all injury” indicators. The differing shading of the bars designate ICD-9 and ICD-10 coded data.

All serious non-fatal injury: frequency. 1999 data are affected by the changeover from ICD-9 to ICD-10. 2004 data are provisional. Source: New Zealand Health Information Service, National Minimum Data Set.

All serious non-fatal injury: age standardized rate. 1999 data are affected by the changeover from ICD-9 to ICD-10. 2004 data are provisional. Source: New Zealand Health Information Service, National Minimum Data Set.

All fatal injury: frequency. 2002 data are provisional. Source: New Zealand Health Information Service, Mortality Collection.
All fatal injury: age standardized rate. 2002 data are provisional. Source: New Zealand Health Information Service, Mortality Collection and Statistics New Zealand.
The New Zealand Government, via the New Zealand Injury Prevention Strategy (NZIPS) Secretariat, accepted our proposed indicators.
DISCUSSION
Validity and acceptance of the proposed indicators
Our approach to indicator development is consistent with the view that before newly proposed indicators are promulgated, they should be subject to formal validation.9 We have proposed indicators that we judge suffer substantially less bias than traditional non-fatal injury indicators. We identified no threat-to-validity when assessed against the ICE criteria. Since the 2001 ICE meeting, other criteria have been suggested, namely: completeness and accuracy of source data; timeliness; ability to measure change over time; measurement that is practicable; indicators that are readily comprehensible.11 Although these additional criteria were not considered systematically, we were aware of their importance when assessing the existing and new indicators.
In regard to the first of these, we have been unable to identify any formal and regular systematic audit of the quality of injury diagnosis and mechanism coding. There may be informal ad hoc audits, but we have been unable to uncover any publicly available reports. This is of concern given that quality data is the building block to the provision of accurate indicator information. Independent of the work described here, we recently completed an audit of the coding of hospital discharges coded under ICD-9. The results show that the level of error for diagnosis coding at 5% is lower than reported in other countries. For external cause codes, an error rate of 18% was found which is similar to that reported elsewhere. The errors were in general at a level of specificity that would have no or very minimal impact on the selection of cases for these indicators, or for indicators for the priority areas.17
We are encouraged that the New Zealand Government, via the NZIPS Secretariat, has accepted our arguments and our proposed indicators, and are starting to act on some of our recommendations, including the development of complementary indicators.11
Trends in the indicators
The contrasting trends for fatal and serious non-fatal injury indicators was surprising. Our a priori hypothesis was that the trends would be similar, due to the high threat-to-life threshold for our definition of “serious non-fatal”. Some possible reasons for contrasting trends have already been discussed.10 The most plausible reason is that the case fatality rate is falling. There is evidence that this has occurred in the US.18 There is an argument, therefore, for combining fatal and serious non-fatal injury into one measure to overcome this latter problem.
In arriving at the recommended indicators, we sought to strike a balance between ease of derivation of the indicator (for example, we have avoided indicators which would require linkage of data), ease of understanding, and validity. Our focus has also been forward looking. Nevertheless, we appreciated the need to access data from the 1990s for the purpose of displaying trends. This has drawbacks, however, arising from the changes between ICD-9 and ICD-10, which occurred in New Zealand in 1999/2000. The serious non-fatal injury indicators show an increase over the period of transition from ICD-9 to ICD-10. This is in contrast to the fatality indicators. A possible explanation is that there were differing interpretations of the coding changes from ICD-9 to ICD-10 by coders of the mortality data and by coders of hospital discharge data. This transition problem will diminish with time as more years of ICD-10 data become available.
Choice of base data
The options for identifying indicators of injury incidence were driven by the availability of national all age/cause/setting/activity injury data. The main sources of data include mortality data, hospital discharge data, and compensation data.
We have based our indicators on ICD-10, because national death and hospitalization data are coded using this classification system. ICD-10 has its limitations (for example, lack of mutually exclusive codes).19 It also has advantages, the principal one being that it is a World Health Organization classification system used by many other countries. This gives the potential for future comparisons with other countries for the indicators we have developed.
The only other existing source of all cause injury data in New Zealand was the Accident Compensation Corporation’s (ACC) compensation database. This was rejected on several grounds including:
-
there is a bias to earners in the capture of cases;
-
it excludes most cases of a major contributor to “all injury” mortality and morbidity, namely self harm; and
-
for some of the priority areas, we were unable to identify relevant cases within the ACC database (for example, falls).
Definition of injury
The NZIPS did not explicitly address the scope of its interest by defining “injury”. Internationally, the most commonly accepted operational definition of injury are those pathologies in the Injury chapter of the International Classification of Disease codes (ICD-codes). However, even here there is some dispute in the international community as to which codes within the ICD injury chapter are in fact injuries. Consistent with ICE recommendations to tabulate “medical injury” separately from other injuries, we have gone a step further and excluded them from consideration. Also, sequelae of injuries have been excluded, as these relate to the late consequences of an injury, rather than the injury itself.
Serious injury definition
It has been our experience that large administrative sets of non-fatal injury data (for example, hospital discharges) cannot be used to produce valid indicators without some preprocessing. Typically, biases in these data† can be minimized by using a severity threshold for our case definition. A discussion of these issues is provided elsewhere.2,3
For hospitalizations, we have previously derived threat-to-life severity scales from the Australian modification of the ICD-9 injury diagnosis. In that work, we compared four measures based on the Abbreviated Injury Scale (AIS) with ICISS. We found that ICISS was one of the best performing measures.20 It also has the advantage that ICISS scores can be derived directly from the ICD injury diagnosis codes.15,20
The ICISS approach to deriving anatomical severity has been tested in a number of settings15,20–25 Previous research work has tended to be in patients treated in specialist facilities (for example, trauma centers) and as such are atypical of all seriously injured people (for example, trauma centers typically do not deal with burns victims). We believe our work on ICISS is the first application to national all-cause injury data (that is, hospitalizations in New Zealand and Australia).15,20 We further believe that the proposed “all injury” serious non-fatal injury indicators are the best that can be identified based on existing research and development.
When setting the severity threshold for our serious non-fatal injury indicators, the goal was to capture just those injury diagnoses with a high probability of admission. If we were able to achieve this, we could achieve our aim, which was to be confident that any trends that we observed reflected changes in the incidence of serious injury (defined as ICISS ⩽0.941), rather than reflecting changes over time in extraneous factors such as improvements in diagnosis and therapy.
If we had diagnosis specific estimates of the probability of admission, we would be able to use this information to set an appropriate ICISS severity threshold to achieve the goal above. In the absence of these estimates, we used the following approach. In our investigation of indicators to measure road safety performance, we considered a series of ICISS severity thresholds to define a series of potential indicators.6 This work showed different trends for different thresholds—but the trends were consistent with one another only when serious injuries were captured by the indicators (ICISS <0.96, <0.95, and <0.90). This work suggested a threshold of ICISS <0.96 when using ICD-9 coded data. We strove to choose an equivalent threshold for ICD-10 data, namely ICISS ⩽0.941.
In choosing the threshold for these indicators, we also examined the diagnoses captured as these thresholds were relaxed or made more stringent. The goal was to capture as many serious injuries as possible, without compromising the requirement that they have a high probability of admission to hospital. The threshold chosen included fractured neck of femur cases, which we know have a very high probability of admission. If the threshold was made more stringent, many of these fracture cases were not included. If it was relaxed, injuries that could have been treated in outpatient clinics were captured. Hence, the chosen thresholds were regarded as a reasonable compromise.
Recommendation for future work
As discussed in our previous “Measure for measure” paper,9 before newly proposed indicators are promulgated they should be subjected to formal validation using a variety of methods. This should include: face validity (through an assessment of the indicator against explicit validation criteria); criterion validity—that is, estimates of the indicator’s characteristics against a “gold standard” measure, or a future outcome (if the indicator aims to predict that future outcome); consistency—for example, through an investigation of trends in the indicator against other measures (including a “gold standard” measure, if it exists) that aim to estimate the same or a similar parameter; and completeness and accuracy of the source data because incomplete or inaccurate data would undermine the validity of the indicator. We have used the first of these in this paper to assess the validity of indicators, and discussed aspects of the last of these. We recommend that work be commissioned to develop methods, and to apply those methods, for the empirical validation of these indicators.
The serious non-fatal “all injury” indicators we have proposed are based on a high threshold of severity so we can be confident that threats to validity are minimized. There is now merit in considering the development of non-fatal injury indicators that capture moderately severe cases (for example, all fractures5), but which exclude minor/superficial injury. This is not likely to be possible using hospital inpatient data alone, as many moderately severe injuries are treated in outpatient settings without recourse to admission to hospital.
The indicators we have proposed draw attention to “important” injury as judged by their resulting in death, or because of their threat-to-life. Injuries can also be important in terms of impairment, loss of function, reduced quality of life, or cost, however. Moreover, it is possible, for example, to have an injury which represents a low threat-to-life, but that has high (threat-of-)disability (for example, penetrating eye injury, finger amputation). The absence of existing New Zealand national indicators that tap into these dimensions partially reflects data availability issues. More work is recommended to address this gap.
Acknowledgments
We would like to thank Shaun Stephenson, with whom we collaborated when writing the original report on which this paper is based. Our thanks to Gabrielle Davie who produced the figures and provided helpful comments on the final draft manuscript. Our thanks to the International Collaborative Effort on Injury Statistics, who developed the indicator validation criteria, and who through their challenges and discussion contributed to the development of these indicators. We thank the New Zealand Health Information Service for permission to use the New Zealand Mortality Collection and the National Minimum Dataset of hospitalisations for this work. This work was funded by the New Zealand Accident Compensation Corporation, Wellington, New Zealand on behalf of the New Zealand Injury Prevention Strategy Secretariat, both of whom provided permission to use the material presented here. Views and conclusions expressed in this article are those of the authors and may not reflect the position of the ACC.
REFERENCES
Footnotes
-
↵† For example, admissions are influenced by sociodemographic, service supply, and access factors independent of injury; compensation claims are influenced by personal and health service factors, employment status, and business cycle, independent of injury.
-
Competing interests: none.