Article Text

Abstract
Objective—To review trends and risk factors in fatal motor vehicle crashes (MVCs) for drivers aged 15–20 years.
Methods—Fatality Analysis Reporting System data from 1988 to 1995 were used. Drivers were divided into three age strata: 15–17 years, 18–20 years, and ≥21 years. Comparisons were made based on rates of driver involvement in fatal MVCs, the percentage of drivers involved in night time fatal MVCs, fatal MVCs without the use of restraints, and fatal MVCs with positive blood alcohol concentration.
Results—Over the eight years, the rate of driver involvement in fatal MVCs for those 15–17 dropped 15.5%; for those 18–20 years it dropped 22.0%, and for those ≥21 years it declined 13.5%. When combining both age groups results were similar. In 1988, 60.4% of young drivers involved in fatal MVCs were not using restraints, but by 1995 the percentage dropped to 46.0%. Night time fatal crashes, the second most frequent risk behavior, declined from 41.7% in 1988 to 35.2% in 1995. Alcohol related traffic fatalities were responsible for 32.1% of fatal MVCs among young drivers in 1988 and for 20.3% in 1995.
Conclusion—To accelerate these trends, implementation and evaluation of complete graduated driver licensing systems (GDLSs) is recommended. Under GDLSs, young drivers are subject to zero alcohol tolerance, curfews, and passenger restraint requirements.
- motor vehicle crash
- night time driving
- restraint use
- blood alcohol concentration
Statistics from Altmetric.com
In developed regions, motor vehicle crashes (MVCs) are responsible for more deaths to young people age 15–29 than any other cause.1 This grim statistic holds true for many countries around the world. MVCs are a leading cause of death among young people in Sweden,2 Chile,3 and Australia.4
MVCs are the leading cause of death for persons aged 15–20 years in the United States.5 In 1995, a total of 6220 persons 15–20 years old, of which 3351 were drivers, were killed in traffic crashes.6 For every young driver killed in an MVC, 100 non-fatal injuries occur7; as this estimate is based on police reported crashes, it likely underestimates the number of non-fatal injuries.
Both as drivers and as passengers, teenagers are disproportionately involved in fatal and non-fatal MVCs compared with people of other ages. Crash risk is particularly high during the first years teenagers are eligible to drive. This excess risk holds true regardless of the denominator used (that is, the total number of teenagers, the number of licenses, or the number of miles driven).8 Because licensure rates and miles driven per license holder are lower among those 16–19 years than among older drivers, when crash involvement is calculated using the number of licensed drivers instead of the total population, the excess fatality rate for teenage drivers is even greater compared with older drivers. Rates are highest when crash involvement is based on miles driven. Although the 11.9 million young drivers aged 15–20 years constituted only 6.7% of the total number of licensed drivers in the United States during 1995, they represented 14% of all drivers involved in fatal MVCs. Based on the number of miles driven, rates for 16 year olds were 18 times that for persons aged 30–34 years.8
Lack of driving experience and risk behavior are two reasons for the high involvement of young drivers in MVCs.9 Because they are novice drivers, adolescents are less proficient in detecting hazards, controlling the vehicle, and making correct decisions.10 Young drivers are also more likely than adult drivers to speed, run red lights, make illegal turns, ride with an intoxicated driver, and drive after using drugs or alcohol.11 Alcohol use increases the risk for MVCs at all ages; however, young drivers show higher levels of impairment than older drivers with the same blood alcohol concentration (BAC).12 Night time driving challenges newly developed driving skills, and deaths of teenage drivers and passengers are more likely to occur at night than are deaths of older drivers.13 Compared with older drivers, young drivers as a group are more willing to take risks and less likely to use safety belts.6
Given the high rates of fatal MVCs for young drivers and the heightened interest in many states for legislative approaches such as graduated driver licensing systems (GDLSs), we conducted this study to describe the epidemiology of young driver involvement in fatal MVCs to help inform future policy decisions.
We reviewed available data on trends in fatal MVCs and in risk behaviors for drivers in fatal MVCs in the United States, from 1988 to 1995. Because of the special risks for young drivers, we focused on comparing young drivers with older ones.
Methods
This analysis used data from the Fatality Analysis Reporting System (FARS) of the National Highway Traffic Safety Administration. FARS is a census of all fatal traffic crashes in the United States occurring on public roads that result in at least one death within 30 days of the crash. This includes deaths to drivers, passengers, and non-motorists such as pedestrians and cyclists. FARS compiles data from several existing sources including police accident reports, state vehicle registration files, state driver licensing files, state highway department data, vital statistics, coroner/medical examiner reports, hospital records, and emergency medical service reports. The majority of information in FARS is obtained from the police accident report.
For this study, only drivers who were involved in a “fatal” MVC were selected, that is, a crash in which at least one person, who may or may not have been the driver, died within 30 days of the crash. Three major risk behaviors were reviewed: night time driving, non-use of restraints, and positive BAC. Night time crashes were those that occurred from 9:00 pm to 4:59 am. Restraint use was defined as use of a safety belt or a motorcycle helmet as indicated on the police accident report. An alcohol involved crash was one in which the driver had a BAC of ≥0.01 g/100 ml.
Drivers were divided into three age strata: 15–17 years, 18–20 years, and ≥21 years. Comparisons were made based on rates of driver involvement in fatal MVCs per 100 000 population and on the percentages of drivers involved in fatal MVCs at night, without restraints, and with positive BAC. The total population, using census estimates for each age strata from each year, was used to calculate age specific rates.
Results
From 1988–95, a total of 68 206 fatal MVCs involved drivers younger than 21 years. In all age groups the rates dropped during this period. Drivers aged 18–20 years experienced the greatest decline from 60.4 to 47.1 per 100 000 (22.0%). For those aged 15–17 years the fall was from 32.2 to 27.2 per 100 000 (15.5%), and for those ≥21 years, the rate declined from 29.7 to 25.7 per 100 000 population (13.5%) (fig 1).
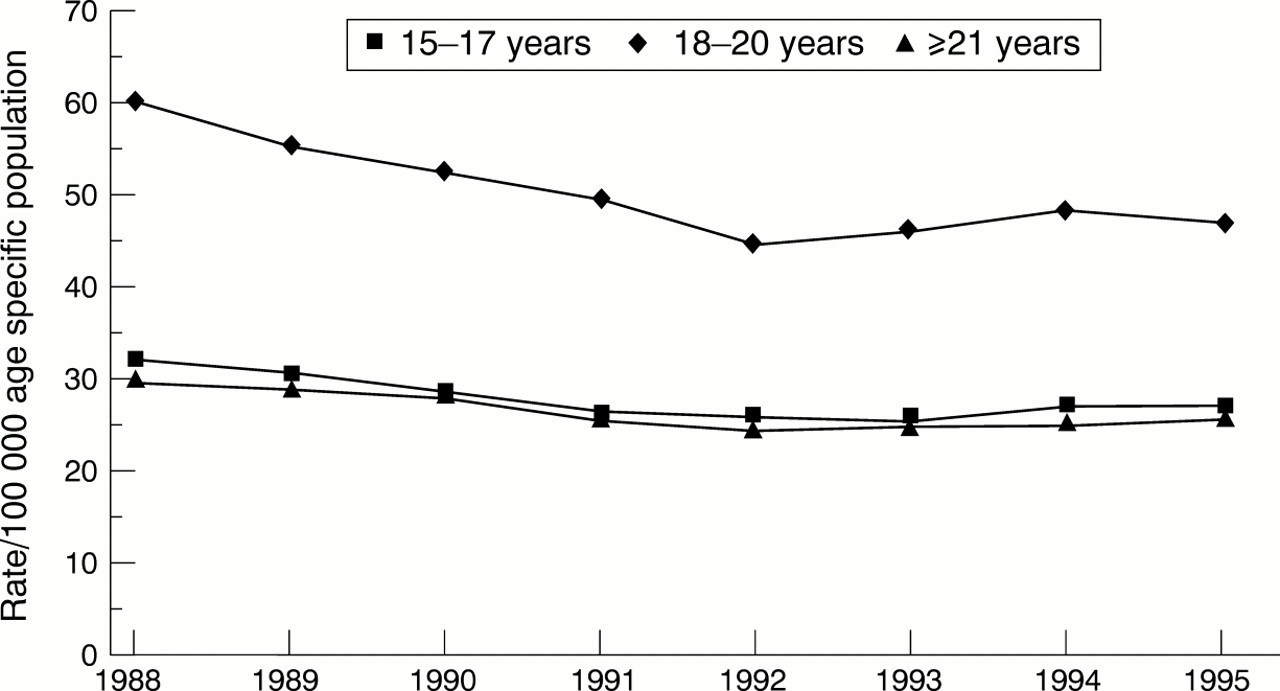
Rates of driver involvement in fatal MVCs, by age group, United States, 1988–95.
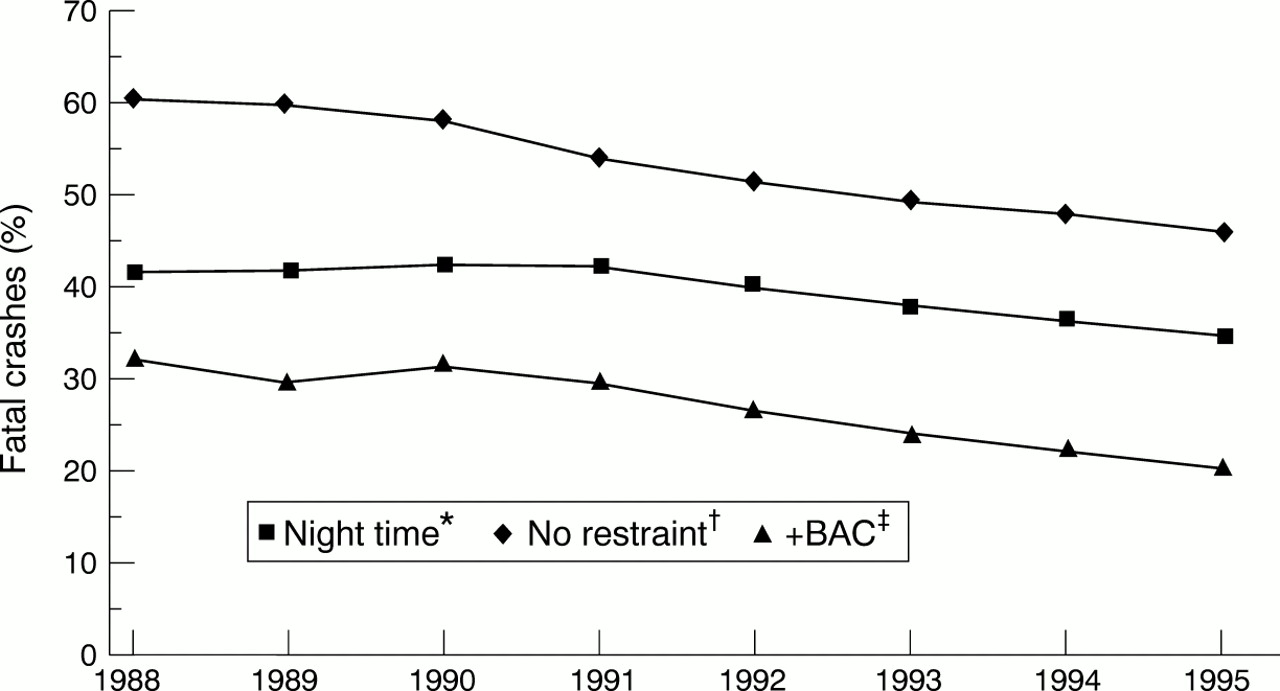
From 1988–95, 18 599 young drivers (27.3%) had BACs ≥0.01 g/100 ml and of these, 12 048 (64.8%) were ≥0.1 g/100 ml (that is, legally intoxicated). Alcohol related traffic fatalities were responsible for 32.1% of fatal MVCs among young drivers in 1988 and for 20.3% in 1995. More than half of the total number of young drivers involved in fatal MVCs, or 36 655, were not using restraints and 27 144 (40%) of MVCs occurred between 9 pm and 5 am. In 1988, 60.4% of those involved in fatal MVCs were not using restraints and in 1995 the percentage dropped to 46.0%. Involvement in night time fatal crashes declined from 41.7% in 1988 to 35.2% in 1995 (fig 2).

Risk behaviors for MVCs among young drivers 15–20 years, United States, 1988– 95. *Night time = 9:00 pm to 4:59 am; †no restraint = no motorcycle helmets or safety belts; ‡positive blood alcohol concentration (+BAC) =≥0.01 g/100 ml.
All three age groups also showed declines in fatal night time crashes. In 1988, 1279 (36.8%) drivers 15–17 years involved in fatal MVCs were driving during the night. In 1995, 911 (30.4%) were involved in night time crashes, a drop of 17.4%. The other age groups experienced smaller declines in the percentage of night time fatal MVCs (13.6% for those 18–20 years and 13.7% for those ≥21 years). All age groups also experienced declines in fatal MVCs where restraints were not used. The percentage of these declined most among those older than 20 years (28.0%); the age group 15–17 experienced a drop of 24.5% and the 18–20 years group experienced a drop of 23.5%. The rate of fatal crashes involving restrained drivers increased over time. During 1988–95, decreases in the proportion of drivers involved in alcohol involved fatal crashes were greater for persons 15–17 years (46.4%) and 18–20 years (31.7%) than for persons ≥21 years (20.4%) (table 1). The rate of non-alcohol involved fatal crashes slightly declined over this period.
Percentage of drivers involved in fatal motor vehicle crashes by risk factor and age group, United States, 1988–95
There were missing values in the data file. Missing restraint use information for ages 15–20 dropped from 12% in 1988 to 9% in 1995; the missing time of day information was no more than 1% for the study period.
Discussion
For most of this century, the risk of dying in a MVC has decreased while the number of miles driven has increased.14 Our data suggest that younger drivers as well as older ones have shared in this decline. Likely factors contributing to these declines include alcohol related legislation and enforcement, such as the increased minimum drinking age (that is, since 1988, the minimum drinking age has been 21 years in all states). Hingson et al compared states that lowered the BAC limit for drivers under 21 years to nearby states that had not changed this limit. He found that the proportion of fatal crashes that involved single vehicles at night declined 16% among young drivers in lower BAC states, and that it rose 1% among drivers of the same age in comparison states.15 In Canada, Mann et al found that legislative changes and high visibility enforcement were associated with a decreased prevalence of alcohol use and a decline in young fatally injured drinking drivers.16
Another contributing factor to these declines is the increased number of people from all age groups who are using restraints due to many factors including the heightened enforcement of safety belt laws (that is, 49 states have mandatory safety belt laws).17
This study is subject to several limitations. First, because this analysis examined only fatal crashes, the findings do not indicate the total level of involvement by young drivers in MVCs. For example, in 1995, 7993 young drivers were involved in fatal MVCs (14% of the total number of fatal crashes), while approximately 2 million were involved in all police reported crashes (17% of the total number of police reported crashes).6 Second, risk behavior may be misclassified. Knowledge of restraint use depends on police observation which varies in completeness and accuracy.18 Moreover, BAC testing may be somewhat dependent on the age of the driver. Because BAC is not available for all persons involved in fatal crashes, imputed data were used to determine BAC for drivers with unknown data. The National Highway Traffic Safety Administration estimates the number of alcohol related traffic fatalities based on a discriminant analysis of information from all cases for which driver or non-occupant BAC data are available.19 Nationwide, BAC test results are known for approximately 68% of all fatally injured drivers.20 Lastly, the number of licensed drivers was not used as a denominator because a portion of 15 year olds drive without a license or with a learner's permit, and that would decrease the accuracy of the denominator. The changing number of vehicle miles traveled over time makes it difficult to use as a denominator.
Despite the decline in their involvement in fatal MVCs, young drivers remain at the highest risk of MVC compared with all other age groups. The rates of those 18–20 years involved in fatal MVCs and the percentage of their fatal MVCs that occur during the night are higher than for any other age group. This is partly due to the fact that young drivers do more of their driving at night and on weekends here in the United States and elsewhere.4, 21, 22 In addition, the percentage of their fatal MVCs without restraints or with a positive BAC is almost always higher than for any other age group. For the 18–20 year age group, the increasing number of miles driven and increasing access to alcohol also increases their risk for MVCs.8, 23 Many persons younger than age 21 continue to drink alcoholic beverages and then drive. Enforcement of alcohol related legislation varies in intensity from state to state. For instance, the Insurance Institute for Highway Safety found that in 1991, 19–20 year olds could easily buy a six pack of beer in Washington, DC or in a New York City suburb.23
Implications for prevention
Lowering allowable blood alcohol limits for young drivers is one possible intervention. Data support the hypothesis that zero tolerance, or a 0.02 g/100 ml maximum BAC for drivers younger than 21, reduces single vehicle night time fatal crashes among adolescents (the type of crash most likely to involve alcohol) and that the lower the limit is set, the greater the reduction.15 Adoption of zero tolerance for young drivers is estimated to reduce the number of fatal single vehicle crashes at night by 20%.15 Currently, 35 states and the District of Columbia have established zero alcohol tolerance for drivers younger than age 21.24 Federal legislation passed in 1995 encourages states to pass laws with lower BAC limits (for those states that have not done so) to combat alcohol impaired driving among underage drinkers. States that fail to enforce zero tolerance for drivers younger than 21 by October 1998, will lose federal funds.25
The GDLS is another strategy for promoting safe driving behaviors and reducing the frequency and severity of MVCs among young drivers. The GDLS enables young drivers to acquire driving experience in low risk settings by increasing the amount of supervised driving practice, by gradually removing restrictions so that new and more complex traffic conditions are encountered, and by requiring crash and violation-free driving performance for a minimum period before advancing to the next level of licensing.26 All drivers under 21 are subject to zero alcohol tolerance, all occupants must use restraints when a person 21 or younger is driving, and novice drivers are subject to restricted hours of night time driving.
Evaluation in three states where a GDLS has been implemented shows promise. In 1988, California reported a 5% reduction in crashes for drivers aged 15–1727; Maryland reported a 5% reduction in crashes and a 10% reduction in convictions for drivers aged 16–1728; and Oregon reported a 16% reduction in crashes for male drivers age 16–17.29 In other countries, GDLSs have also shown promising results. In New Zealand, the hospitalization rate for motor vehicle related injuries declined 7% among 15–19 year olds after implementation.30 In Ontario, 16–19 year old drivers experienced an estimated 9% fewer total crashes, 10% fewer injury crashes, and 24% fewer fatal crashes due to the late night curfew component of the GDLS. However, it was also estimated that the road restriction component increased crashes for this age group resulting in a net increase in crashes.31 These types of estimates are needed for each component of the GDLS so that only those portions that decrease crashes are recommended. This may lead to different recommendations for different countries.
To date, most states have not implemented a complete graduated system. In the absence of a GDLS, parents are encouraged to implement their own form of graduated licensing by requiring a longer period of supervised driving, restricting driving with passengers, restricting night time driving, and encouraging driver's education courses.