Article Text

Statistics from Altmetric.com
Our Healthier Nation, a consultation paper from the Department of Health, identifies accidents as one of four key areas for improving the health of the population.1 It sets a target to reduce accidental injuries requiring a hospital visit or consultation with a family doctor by at least a fifth (20%) by the year 2010. The paper notes that accidents are the greatest single threat to life for children and young people. Treating injuries costs the NHS about £1.2 billion each year. Mental health is also identified as a key area for improving health. Although suicide rates are declining, the strategy sets a target to reduce the death rate from suicide and undetermined injury by at least a further sixth (17%) by 2010. Thus two of four key government targets for improving the health of the nation involve injuries. In this section, we will review the extent of the child injury problem in this country and compare it with other countries, describe trends in child injury deaths and some of the determinants, and discuss the scale of the injury problem in terms of costs.
Extent of the problem in children
ALL INJURY DEATHS
In England and Wales in 1995, 590 children aged 1 month to 15 years died as a result of injury or poisoning (table 1).2 Injury and poisoning deaths, both unintentional and intentional, accounted for nearly one in five deaths among children in this age group (18.5% of the total), and were the leading cause of death among children aged 28 days to 15 years.2 (Published national data are not available for older teenagers, for example 15–19 years, as their deaths are combined with those of adults in the age groupings.)
Leading causes of death among children aged 28 days to 15 years*; values are number (%)
AGE AND SEX CHARACTERISTICS
Injuries* account for a greater proportion of all-cause deaths as children become older. In 1995, injuries accounted for 4% of deaths among infants aged 1–11 months, 22% among children aged 1–4, 26% among children aged 5–9, and 33% among those aged 10–14.2 The proportion of deaths attributable to injuries is higher for males (21%) than for females (15%).2 The sex differential is greatest for ages 10–14 years. In this age group, injuries caused 43% of all deaths among males compared with 19% among females.
DiGuiseppi and Roberts analysed unpublished national data for 1992 for children and young people aged up to 19 years, which show that injury death rates vary substantially by age.3 The death rate per 100 000 population from all external causes of injuries was 11.7 among children under 1 year of age, 7.4 for ages 1–4 years, 4.1 for ages 5–9 years, 6.4 for ages 10–14 years, and 25.9 for ages 15–19 years (table 2).
Injury death rates among children and teenagers in England and Wales, 1992 (age in years). (
)INTENT AND CAUSE OF DEATH
In 1992, there were a total of 1422 injury deaths among children and teenagers aged 0–19. Of these, 1120 were unintentional injury deaths, a rate of 8.6 deaths per 100 000 population (table 2).3 Unintentional injuries accounted for 79% of all injury deaths in this age group. In addition, there were 109 (8%) suicides (0.8/100 000), 48 (3%) homicides (0.4/100 000), and 145 (10%) deaths of unknown intent (1.1/100 000).
These proportions and rates varied substantially by age. Most unintentional injury deaths (53%) occurred among teenagers aged 15–19 years, who had the highest unintentional injury death rate, at 19.0/100 000 per year. Virtually all suicides (99%) occurred in teenagers aged 15–19, among whom the suicide rate was 3.5/100 000. The majority of homicides (44%) also occurred in this age group, although the highest homicide rate occurred in infants (1.4/100 000).
Of the 1422 total injury deaths among children and teenagers, 698 (49%) were attributable to motor vehicle traffic, for a rate of 5.4 deaths/100 000 population. Traffic was the leading cause of injury death for all age groups after the first year of life. The majority of the traffic deaths were to motor vehicle occupants (49%) and pedestrians (29%). Thus, transport related deaths are the most important single cause of injury death among children aged 0–19 in England and Wales.
Causes of injury death vary by age group. The highest cause specific injury death rate among adolescents aged 15–19 involved motor vehicle occupants (9.1/100 000). For children aged 5–9 and 10–14, pedestrian injury was responsible for the highest death rates (1.5/100 000 and 2.2/100 000, respectively). For children aged 1–4, fire and flames (1.5/100 000) and pedestrian injury (1.3/100 000) showed the highest cause specific death rates. Among children under 1 year of age, the most important cause of injury death was suffocation (2.7/100 000), most of which involved inhalation or ingestion.
INTERNATIONAL COMPARISONS OF DEATH RATES
When child mortality data from England and Wales are compared with similarly reported US and Australian data, several important differences emerge.3–5 Overall, and for every age group, child injury death rates in England and Wales are less than half those in the US. The rates in England and Wales are also less than those in Australia, although the difference in rates for children under 1 year of age is small. The largest difference between England and Wales and Australia occurs in the 15–19 year age group, most of which is accounted for by the higher rates of occupant and firearm injury deaths in Australia.
The international differences in firearm mortality are striking.6 Firearms accounted for 27% of injury deaths in the US, 6% of such deaths in Australia, but only 1% of injury deaths among children in England and Wales. Rates of firearm deaths per 100 000 children aged 0–19 years were 7.8 in the US but only 0.9 in Australia and 0.1 in England and Wales. Teenagers aged 15–19 contributed the majority of firearm deaths in all three countries, accounting for 83% of firearm deaths in the US, 85% in Australia, and 92% in England and Wales. Death rates per 100 000 in this age group were 27.8 in the US, 3.2 in Australia, and 0.35 in England and Wales. The majority (64%) of firearm deaths in the US are homicides, while in Australia suicide accounts for 75% of such deaths. International differences in firearm mortality may be explained at least in part by differences in gun ownership and availability.
Pedal cyclist and pedestrian death rates are similar in all three countries, although these comparisons do not take into account any differences in children's exposure to walking and cycling activities. International comparisons suggest large differences between countries in the extent to which children walk and bicycle.7 Motor vehicle occupant injuries are nearly two times higher in Australia and three times higher in the US than in England and Wales. At least some of the variation may be explained by children travelling a greater average number of miles by car in the US and Australia compared with England and Wales. Differences between countries in case fatality rates or in the risk from car travel per mile travelled are also possible but likely to be less important explanations.
INJURY MORBIDITY
Only a small proportion of the injuries that occur to children result in death. In England in 1994–95, there were 52 000 NHS hospital episodes due to injuries to children aged 0–4 and 80 000 among children aged 5–14, accounting for 8% of all inpatient episodes among children.8 Injuries are the second leading cause of hospital episodes among children aged 5–14, and they are the leading cause among boys in this age group. A large number of injuries do not result in hospitalisation but do lead to consultation with a family doctor. In a survey of general practice in England and Wales, the annual rate of consultation was 13% among children aged 0–4, 14% among children aged 5–14, and 15% among teenagers and young adults aged 16–24.9 Rates were higher for males than females in all age groups. The most common causes of general practice consultation among children and young people were sprains, superficial injuries, and contusions; among children under 5 years of age, facial lacerations were also important.
Trends
With the more widespread recognition of the public health importance of childhood injury, a number of epidemiological studies have attempted to identify modifiable risk factors. These studies aim to identify factors that can be changed which place some children at greater risk of injury than others. However, an effective public health response to the problem of childhood injury demands that we also understand the determinants of the population incidence rate, attempting to understand why injury rates change over time.10 If the determinants of the incidence rate can be identified, it might be possible to control them, with important gains for the whole child population. The following information draws on new analyses of mortality data† as well as previously published analyses by the authors.
TOTAL INJURY DEATH RATES
Over the period 1980 to 1995, there were a total of 30 835 deaths from injury and poisoning among people aged 0–19 years in England and Wales. Of these deaths, 25 474 (83%) were classified as unintentional (E800-E949), and 5361 (17%) were classified as intentional (E950–999, including injuries of undetermined intent in the latter category). Between 1980 and 1995, there has been a substantial fall in the unintentional injury death rate, but no reduction in the intentional injury death rate (fig 1). Intentional injuries comprised 13% of injury and poisoning deaths in 1980, and 25% of injury and poisoning deaths in 1995.

Trends in injury death rates.
UNINTENTIONAL INJURY DEATHS
Of the 25,474 unintentional injury deaths between 1980 and 1995, males accounted for 74%. Children aged 0–4 years accounted for 19% of unintentional injury deaths (9.3 deaths/100 000 population), those aged 5–9 years accounted for 12% (6.0/100 000), those aged 10–14 years accounted for 15% (7.2/100 000), and those aged 15–19 years accounted for 55% (24.1/100 000). Motor vehicle traffic accidents (E810-819) were responsible for 63% of all unintentional injury deaths.
Trends in unintentional injury death rates, children aged 0–14 years
Cause specific trends in injury death rates for children aged 0–14 years are shown in fig 2. Between 1985 and 1992 there was a steady decline in the unintentional injury death rate for children age 0–14 years.14 Pedestrian injury accounts for approximately one third of all unintentional injury deaths in this age group and over these years the pedestrian injury death rate fell by 37%. However, over the same time period, the average distance walked per year by a child aged 0–14 years fell by 20%, from 247 miles to 197 miles. The death rate per mile walked fell by only 24% between 1985 and 1992.14 Thus, changes in children's exposure to risk as pedestrians appear to account for a large part of the decline in these death rates.

Changes in mortality from specific causes for children aged 0–14 years between 1985 and 1992. This figure was first published in the BMJ (DiGuiseppi C, Roberts I, Li L. Influence of changing travel patterns on child death rates from injury: trend analysis. BMJ 1997;314:710–3) and is reproduced by permission of the BMJ.
Bicyclist deaths account for approximately 8% of all unintentional injury deaths and these death rates have also declined by an amount similar to pedestrian death rates (38%). Once again, much of this may be due to reduced exposure to risk. The average distance cycled in a year declined by 26% between 1985 and 1992, while the death rate per mile cycled fell by only 20%.14 Some of the decline in pedestrian and bicyclist death rates is also likely to be due to the fact that the chances of surviving after a severe injury has increased (see section 5). Over the comparison period there has been a 16% annual decline in the trauma case fatality rate (the proportion of injured children who die) among children and young adults, probably due to improvements in trauma care.15
There has also been a decline in the death rate for child motor vehicle occupants, despite a 40% increase in the annual number of miles children travelled by car.14 In this case, the decline in death rates per passenger mile (42%) is considerably greater than the decline per head of population (21%). This suggests that along with declining case fatality rates, car travel has become safer but that increases in the distance travelled by car have offset many of these effects. The fall in occupant death rates may be due to a reduced occurrence of road crashes, or to increased survival. This, in turn could be due to factors related to vehicle design, such as airbags and child restraints, or to better hospital care.
Fire deaths account for about 13% of unintentional injury deaths. Between 1985 and 1992, deaths from fire and flames in childhood declined by 30%. Increasing smoke alarm ownership may account for some of this decline. Between 1985 and 1995, alarm ownership has increased from 0% to around 80%. The decline in fire death rates has been greatest for children under 5 and corresponds closely with the increase in alarm ownership.16
Trends in unintentional injury death rates, teenagers aged 15–19 years
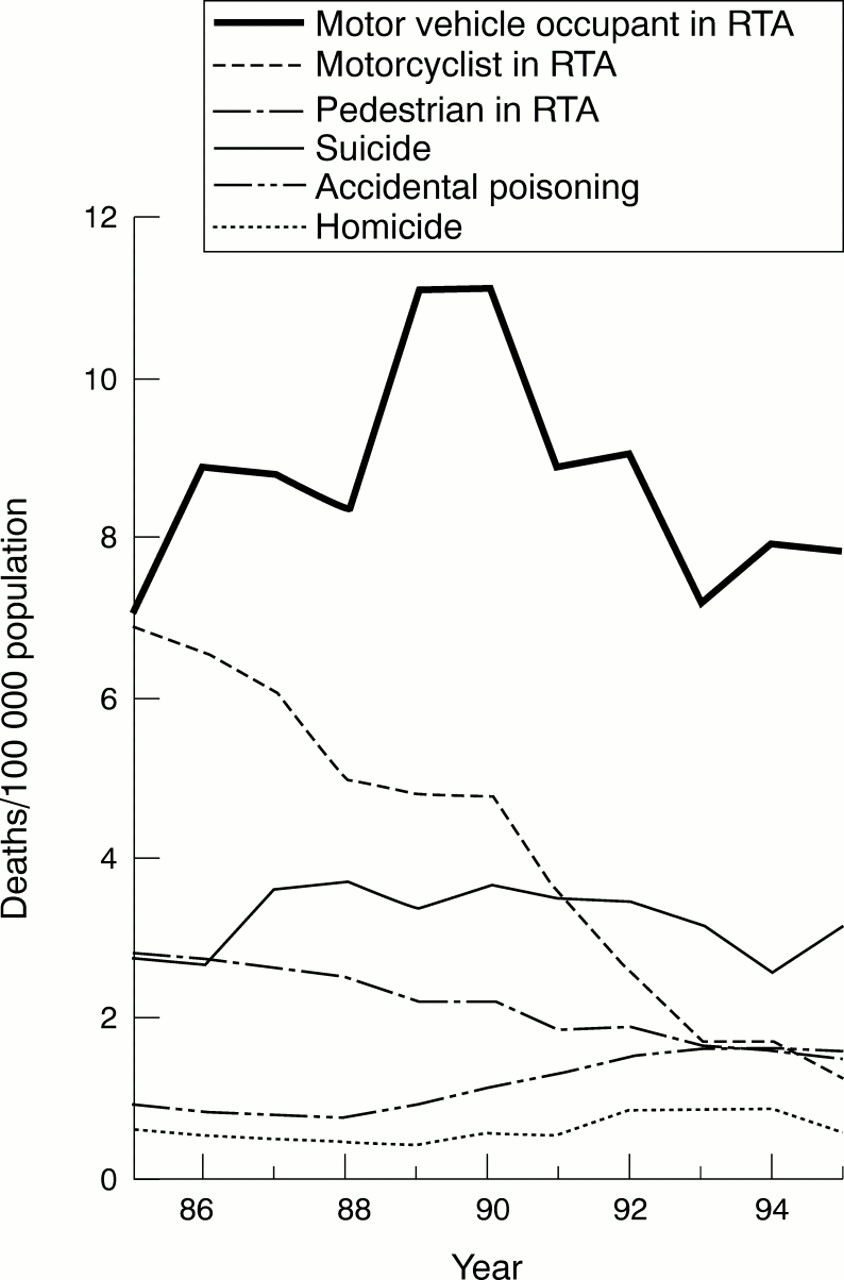
Cause specific trends in injury death rates for teenagers are shown in fig 3. Between 1985 and 1995, the total unintentional injury death rates among teenagers aged 15–19 years declined by 32%. Most (76%) injury deaths in this age group involve road users, where there have been large declines in death rates for motorcyclists (78%), pedestrians (49%), and cyclists (38%), but not for motor vehicle occupants (2%).17 Once again, the trends in injury death rates are likely to reflect changes in transportation patterns. The 78% decline in motorcycle death rates corresponds closely to the 78% decline in average annual motorcycle mileage among teenagers, a fall from 154 miles in 1985 to 34 miles in 1995. Average annual miles walked fell by 24% and cycle mileage fell by 31%.

Changes in mortality from specific causes for teenagers aged 15–19 years between 1985 and 1995 (RTA = road traffic accident).
On the other hand, car mileage increased by 35%, from 2819 miles per year to 3793 miles. Because of this large increase, the 27% reduction in death rates per car passenger mile has been almost completely nullified.17 Overall, teenagers are motorcycling, walking, and bicycling less and driving more—trends that have important effects on the trends in death rates.
In contrast to the declines in transport related deaths, accidental drug poisonings among teenagers increased by 8% per year between 1985 and 1995.18 Over the 11 year period, there was a cumulative increase of 125% in accidental drug poisoning death rates among teenagers. Within this category, the largest increases occurred in poisoning by opiates and related narcotics (27% per year) and by other psychotropic agents (23% per year). These increases have occurred concurrently with large increases in the number of teenagers exposed to drugs.19
INTENTIONAL INJURY DEATHS
Of the 5361 intentional (and intent undetermined) injury deaths between 1980 and 1995, males accounted for 69%. Children aged 0–4 years accounted for 18% (1.9/100 000), those aged 5–9 years accounted for 5% (0.5/100 000), those aged 10–14 years accounted for 7% (0.7/100 000), and those aged 15–19 years accounted for 70% (6.4/100 000). Of the 5361 deaths, 45% were classified as injury undetermined whether accidentally or purposely inflicted, 35% were classified as suicide, and 20% as homicide.
Trends in intentional injury death rates, children aged 0–14 years
Among children under 15 years of age, injury undetermined whether accidentally or purposely inflicted accounted for 54% of intentional injury deaths, homicide accounted for 42%, and suicide accounted for 4%. There were no significant changes in death rates in any of these categories over the 15 years since 1980.
Trends in intentional injury death rates, teenagers aged 15–19 years
Among teenagers aged 15–19 years, suicide accounted for 48% of intentional injury deaths, homicide accounted for 10%, and injury undetermined accounted for 42%. Over the period 1980 to 1995, there was no significant change in homicide death rates in this age group (fig 3), but there was an increase in suicide rates of 1% per year (p=0.02), and an increase in undetermined deaths of 2% per year (p<0.001).
SOCIAL CLASS GRADIENTS IN INJURY DEATH RATES AND CHANGES OVER TIME
The social class gradient for deaths due to injuries is steeper than for any other cause of death in childhood. At the time of the 1981 census, the injury death rate for children in social class V was three and a half times that of children in social class I (table 3).20 However, because there was a differential decline in death rates between 1981 and 1991, the gradient became steeper. At the time of the 1991 census the death rate for children in social class V was five times that of children in social class I.
Trends in unintentional injury deaths/100 000 children (age 0–15 years) in England and Wales, by social class
The magnitude of the social class gradients in unintentional injury death rates varies widely depending on the mechanism of injury.21 The gradient is steepest for fire deaths: the risk of fire related death for a child in social class V is 16 times that of children in social class I. The corresponding figure for pedestrian death is a fivefold elevation in risk. Gradients are least for motor vehicle occupant injuries, probably because children in the most disadvantaged social groups do not have access to a car.
There are also strong social class gradients for homicide and for injury deaths of undetermined intent (table 4).22 For homicide, the death rate for children in social class V is 17 times that for children in social class I. In contrast, there is little evidence for a social class gradient for suicide deaths among children. This is likely to reflect the low numbers of suicides among children aged 15 or less, with the possibility that random variability may have obscured any gradient.
Trends in intentional injury deaths/million children (age 0–15) in England and Wales, by social class
For all intentional injury deaths, and for homicide and injury deaths of undetermined intent, the social class gradient is steeper for the four year period 1992 to 1995 than for the period 1980 to 1983 (table 4). These data underscore the strong relationship between violence and poverty, and suggest that as income inequality has widened, with the poorest families becoming even poorer, levels of violence involving children in these families has increased.
Costs of childhood injury
ROAD TRAFFIC ACCIDENTS
Unintentional injuries among children aged up to 15 years account for about 600 deaths each year of which about one third are the result of road traffic accidents.2,3 In the age group 15–19 years a further 400 lives are lost annually from injuries sustained in road traffic accidents. In this age group, traffic fatalities account for about one quarter of all deaths and about three quarters of accidental deaths.
The police collect information when they attend a road traffic accident, or have details reported to them, about the type of road users involved or injured, where the accident happened, and the circumstances of its occurrence. The report includes an estimate of severity broadly classified as fatal (death within 30 days), serious (for example, broken bones or injuries requiring hospitalisation), or slight ( for example, minor cuts, bruises and shock not requiring hospitalisation). Details are transferred to a database known as Stats19 from which statistical data are published annually by the Department of the Environment, Transport and the Regions (DETR).23
The DETR has estimated values of preventing fatal and non-fatal road traffic accidents. These values are required so that the costs of accident prevention initiatives can be compared in monetary terms with the benefits of reducing the number of deaths or casualties. The estimates valuing the prevention of road traffic injuries are based on willingness-to-pay procedures, whereby individuals place a value on a decrease in the risk of injury.24,25 At 1994 prices the total value used by DETR of avoiding a fatality is £784 090. This total includes the value of avoidance of injury (£510 880 for a fatality), lost output (£272 696), and medical costs (£510). The corresponding values for serious injuries at 1994 prices are £70 910 for avoidance of injury, £11 500 for lost output, and £6790 for medical costs, a total of £89 200. For slight injuries, the figures are £5190, £1220, and £520, totalling £6930. By calculating the proportions of different severities of injury, the average value of saving a casualty is estimated at £28 100.
In the context of road traffic accidents involving injury to children aged 0–15 years, the total annual number of casualties reported to the police is about 44 000. Using the average cost of preventing a casualty, the monetary value at 1994 prices is about £1230 million. The fatalities considered alone can be valued at £180 million for the 0–14 year olds but when the deaths among 15–19 year olds are also included, this figure rises to £494 million‡.
HOME ACCIDENTS
The DETR values are calculated for road traffic accidents. Similar studies have not been performed in such detail for other accident types. Hence, we do not have accurate estimates of values of preventing other kinds of injury. Hopkin and Simpson undertook a study in which they estimated the value of preventing a home injury.26 They used as a starting point the road accident values and assumed that the value of a fatal injury was the same for both. However, this assumption does not hold for non-fatal injuries because the serious injuries sustained in the home tend to be less severe, on average, than those sustained on the road. Therefore, they require a shorter stay in hospital and less time afterwards to recover.
From this first attempt to derive basic values for preventing injuries in the home, it was estimated that the value for preventing a serious home injury is £28 830, a slight injury treated by the hospital is £3920, and a slight injury treated by the general practitioner is £120. The value of a fatal injury was the same as for road accidents (£784 090), which brings the average value to £9460.
About 150 deaths a year result from injuries in the home among 0–14 year olds,2,3 giving an estimated monetary value of £118 million. Approximately one million children annually attend the accident and emergency departments of British hospitals as a result of injuries in and around the home.27 Thus, taking the average value of a home accident derived by Hopkin and Simpson, the value to society of preventing these injuries is £9460 million.
HIDDEN COSTS OF INJURY
A study carried out by Murray et al estimated the cost of long term disability from road traffic accidents.28 Whiplash and fracture injuries were studied and length of time to recovery recorded over a four year period. While most people recovered fully during the first year, a substantial minority (8%) were not fully recovered after four years.
In addition to tangible losses and associated costs, psychological long term effects were also identified. These effects are an important hidden cost of childhood injuries. Heptinstall undertook a study that investigated the need for and provision of emotional support to children who were treated at accident and emergency departments.29 She concluded that children not admitted to hospital received little or no emotional support other than comfort and reassurance by the hospital staff, and those who were admitted received little or no support upon discharge. While allowances are made in the valuation of injury costs for physical rehabilitation, no allowance is made for providing support for the emotional problems that may endure for quite some time even after fairly minor accidents and injuries.
SUMMARY
These values are only broad estimates, but they serve to show the scale of the problem in monetary terms. They provide professionals with information to help them decide between priorities and they enable the calculation, in cost-benefit terms, of the effectiveness of different prevention measures. Monetary values can be applied to injury prevention initiatives that allow cost-benefit appraisals to be made, thus providing a tool to aid choice between alternatives. The application of these values serves to highlight the great benefits that can be achieved with the introduction of well planned, effective injury prevention initiatives. More work needs to be done to refine the way the willingness-to-pay procedures are applied to injury types other than road traffic accidents, but notwithstanding, the human costs are high.
Conclusions
At the beginning of the 20th century, infectious disease was the “captain of the kings of death” among children in the UK. At the end of the century, childhood injury now holds that title. As was the case for infectious disease, childhood injury is a disease of poverty. Social class gradients for childhood injury are steeper than for any other child health problem, and the gradients are widening. But just like infectious disease the injury epidemic can be tackled, provided there is the political will to do so. The decline in residential fire deaths that has accompanied increasing smoke alarm use shows that population level injury control can be achieved in less than a decade when there is strong support from central government. Similarly, the decline in injury case fatality shows what can be achieved by national organisations working in concert.
There are, however, many challenges ahead that will be met only by central government, local communities, and individuals working together. The prevention of road traffic death and injuries in particular requires such a coordinated approach. When looking at the decline in road death rates to vulnerable road users, we must remember it is likely to be as much the result of changing travel patterns as successful efforts in prevention. The cost of childhood injury is high: road accidents and home accidents between them are estimated to cost the community in Britain over £10 000 million each year. But the hidden costs of injury, in particular the personal tragedies of children and their families should not be overlooked. Tackling infectious disease is the defining feature of progress in child health in this century, tackling childhood injury must be the defining feature of the next.
-
Injuries are a leading cause of mortality and an important cause of morbidity among children and youths in England and Wales.
-
The government has set targets to substantially reduce accidents and suicides by the year 2010, identifying these as key to improving the health of the nation.
-
There has been a steep decline in death rates from unintentional injury but much of this can be explained by changes in travel patterns, especially a reduction in walking and cycling by younger children and a reduction in motorcycling by teenagers. Over the same period there has been virtually no decline in death rates for intentional injury.
-
Social class gradients for both unintentional and intentional injury have widened over the past decade.
References
Footnotes
↵* In the remainder of this document, “injury and poisoning” is referred to as “injuries”, except when otherwise specified.
↵† A data file containing the anonymised records of all injury and poisoning deaths for people aged 0–19 years inclusive, resident in England and Wales, was obtained from the Office for National Statistics. Each record included the external cause of injury code (E code), age, sex, year of death, and parents' occupational class. Population denominator data were obtained from published sources.11 Trends in overall and cause specific injury death rates were examined using Poisson regression modelling.12 Class specific death rates were estimated using the Registrar General's Standard Occupational Classification.13 For deceased children aged less than 15 years, social class is based on the father's social class, unless this is missing, in which case it is based on the mother's. Teenagers aged 15–19 are assigned their own social class but because many people in this age group are in full time education, assigning social class on the basis of the Standard Occupational Classification is problematic. For this reason we restricted our analyses of social class gradients in injury death rates to children under 15 years. To increase the precision of class specific injury mortality rates, an eight year period (1985–92) was used. Class specific denominator data were obtained by linear interpolation using data from the 1981 and 1991 censuses.
↵‡ The Stats 19 figures published by DETR give casualty figures for children aged 0–15 years while those published by the Office for National Statistics in the Mortality Statistics series give 0–14 years.