Article Text

Abstract
Objective: To establish injury profile of collegiate rugby union in the USA
Design/setting: 31 men’s and 38 women’s collegiate rugby union teams prospectively recorded injuries during games and practice during the 2005–06 season. Three teams withdrew before data collection. An injury was defined as one: (1) occurring in an organised intercollegiate game or practice; and (2) requiring medical attention during or after the game or practice, or (3) resulting in any restriction of the athletes’ participation for ⩾1 day(s) beyond the day of injury, or in a dental injury.
Main outcome measures: In total, 847 injuries (447 in men; 400 in women) during 48 026 practice (24 280 in men; 23 746 in women) and 25 808 game (13 943 in men; 11 865 in women) exposures were recorded.
Results: During games, injury rates of 22.5 (95% CI 20.2 to 25.0) and 22.7 (20.2 to 25.5) per 1000 game athletic exposures or 16.9 (15.1 to 18.9) and 17.1 (15.1 to 19.1) per 1000 player game hours were recorded for men and women, respectively. Over half of all match injuries were of major severity (>7 days’ absence) (men 56%; women 51%) and the tackle was the game event most often associated with injury (men 48%; women 53%).
Conclusions: Collegiate game injury rates for rugby were lower than rates recorded previously in men’s professional club and international rugby and lower than reported by the National Collegiate Athletic Association Injury Surveillance System for American football, but similar to rates reported for men’s and women’s soccer in 2005–06.
Statistics from Altmetric.com
Rugby union is ranked second in participation only to soccer as a football code.1 It is the most popular worldwide team contact sport involving collision,2 and is perceived as having one of the highest levels of injury.3 There have been several studies on rugby union in the USA and Canada,4 5 and reported rugby injuries at collegiate6–8 and club level9–11 and during women’s rugby.7 9 10 12 Although it is a rapidly developing sport in North America, it has yet to be studied on a large scale prospectively. In contrast to its popularity worldwide, rugby union is not fully recognised by the National Collegiate Athletic Association (NCAA). This precludes recording of injury data through the NCAA Injury Surveillance System (ISS). The NCAA ISS was developed in 1982 to provide data on injury trends in intercollegiate athletics.13 Injury and exposure data are collected yearly from a representative sample of institutions. Rugby union’s development in the USA may be tempered by its perception as a sport with a high injury rate. For instance, although the NCAA approved women’s rugby as an emerging sport in 2002,14 concerns were raised that no published injury information directly comparable with the NCAA ISS existed.
Prospective injury surveillance is necessary both to evaluate the risk of the collegiate game and to help develop injury-prevention strategies. Although rugby union is played by the same regulations worldwide, the competitive level of US collegiate rugby is perhaps lower than the level of competition in recent prospective surveillance,15–17 hence the injury rate may be lower than perceived.
The purpose of this study was to report injuries and present data from men’s and women’s collegiate teams within the New England Rugby Football Union (NERFU) district during the 2005–06 seasons. Our hypothesis was that the injury rate for US collegiate rugby union would be lower than rates recorded for men’s professional and international rugby and similar to injury rates for other intercollegiate sports in the USA
METHODS
The study was approved by institutional review board for human research at the Children’s Hospital, Boston.
All 122 collegiate level men’s and women’s teams in the NERFU district were invited to participate in a prospective cohort study of rugby injuries during the autumn season of 2005 and spring season of 2006. In total, 31 men’s and 38 women’s teams accepted the invitation; 3 subsequently withdrew before data collection.
Affiliated athletic trainers and emergency medical technicians collected the injury data when available (12); in teams without medical personnel (57), coaches or an identified player collected the data.
Data collection were facilitated by the use of a modified injury report questionnaire, derived with permission from The England Rugby Injury and Training Audit.15 16 Alterations were made to allow direct comparison with data acquisition with the NCAA ISS dataset.13 Injury data collected included activity during injury (match or training), nature and location of injury, injury incident and player position. The injury data were collected by appointed personnel directly observing the injury incident. Game and practice exposure data were collected on a weekly basis by coaches or an identified player, using a standardised form. Training for the injury and exposure data acquisition process were provided.
Game injuries were reported per 1000 player game hours (PGH) and per 1000 game athletic exposures (GAE). Practice lengths were not recorded, hence injuries sustained during practice were reported per 1000 practice athletic exposures (PAE) only.
Injury definition
Similar to the NCAA ISS,13 an injury was defined as: (1) occurring as a result of participation in an organised intercollegiate game or practice; and (2) requiring medical attention by a team athletic trainer, physician or other person during or after the game or practice, or (3) resulting in any restriction (self-restricted or restricted by a medical professional) of the athletes’ participation for ⩾1 days beyond the day of injury, or resulting in a dental injury, regardless of time loss.
Both medical attention„ (2) and time loss„ (3) injuries were reportable,18 making the reporting definition„ 19 of injury more inclusive than the England Rugby Injury and Training Audit.15 16 20 Medical attention„ injuries that did not restrict participation were designated as no time off„ (NTO) injuries and were reported as a category of severity.21 22 Minor injuries were divided by time loss into 1 day, 2–3 days and 4–7 days.23 Severity was otherwise reported in accordance with the NCAA definition13 and other researchers19 24–26 where an injury resulting in >7 days' absence from participating in games or practice from midnight of the day of injury is designated as major„.
Players were identified by a team code and identification number and no personal identification data were submitted. Data collection occurred weekly, and the designated collectors were contacted if their team’s data were not received. For each weekly exposure sheet submitted, the team was reimbursed a nominal fee. Data were entered into a Microsoft Excel database and SportsWare 2005 injury tracking software (Computer Sports Medicine Inc., Stoughton, Massachusetts, USA). Entered data were independently verified for accuracy by matching all forms with the study database. Discrepancies were reported and corrections were made.
Poisson log-linear regression analysis was used to compare the incidence of injuries between men and women in games and practices.27 The Wilson method for constructing 95% confidence intervals with continuity correction was used.28 Two-tailed p values of <0.05 were considered statistically significant. Statistical analysis was performed using SPSS V.15.0 (SPSS Inc, Chicago, Illinois, USA).
RESULTS
In total, 847 injuries were reported (table 1). The incidence of injury during games was significantly higher than that during practice, with a rate ratio of 4:1 for both sexes. Injury incidences for both men and women were found to be very similar, both in games and in practices. A greater proportion of major injuries occurred during games (56 and 51%) , whereas minor injuries predominated during practices (56 and 60%). Very few reported injuries were NTO injuries (<10% games or practices).
Demographics
To be eligible to play, all collegiate rugby union players must be playing within 5 years of the date on which they enrolled in college.29 The majority were 17–21 years old; more specific demographic information was not obtained during the study.
Table 2 describes the injury rates and severity experienced in different positions. Flankers (men) and centres (women) were the most frequently injured during games (fig 1). The highest percentage of major injuries was reported for the No 8 position during games (men and women). There were no significant differences between male and female players in each position.

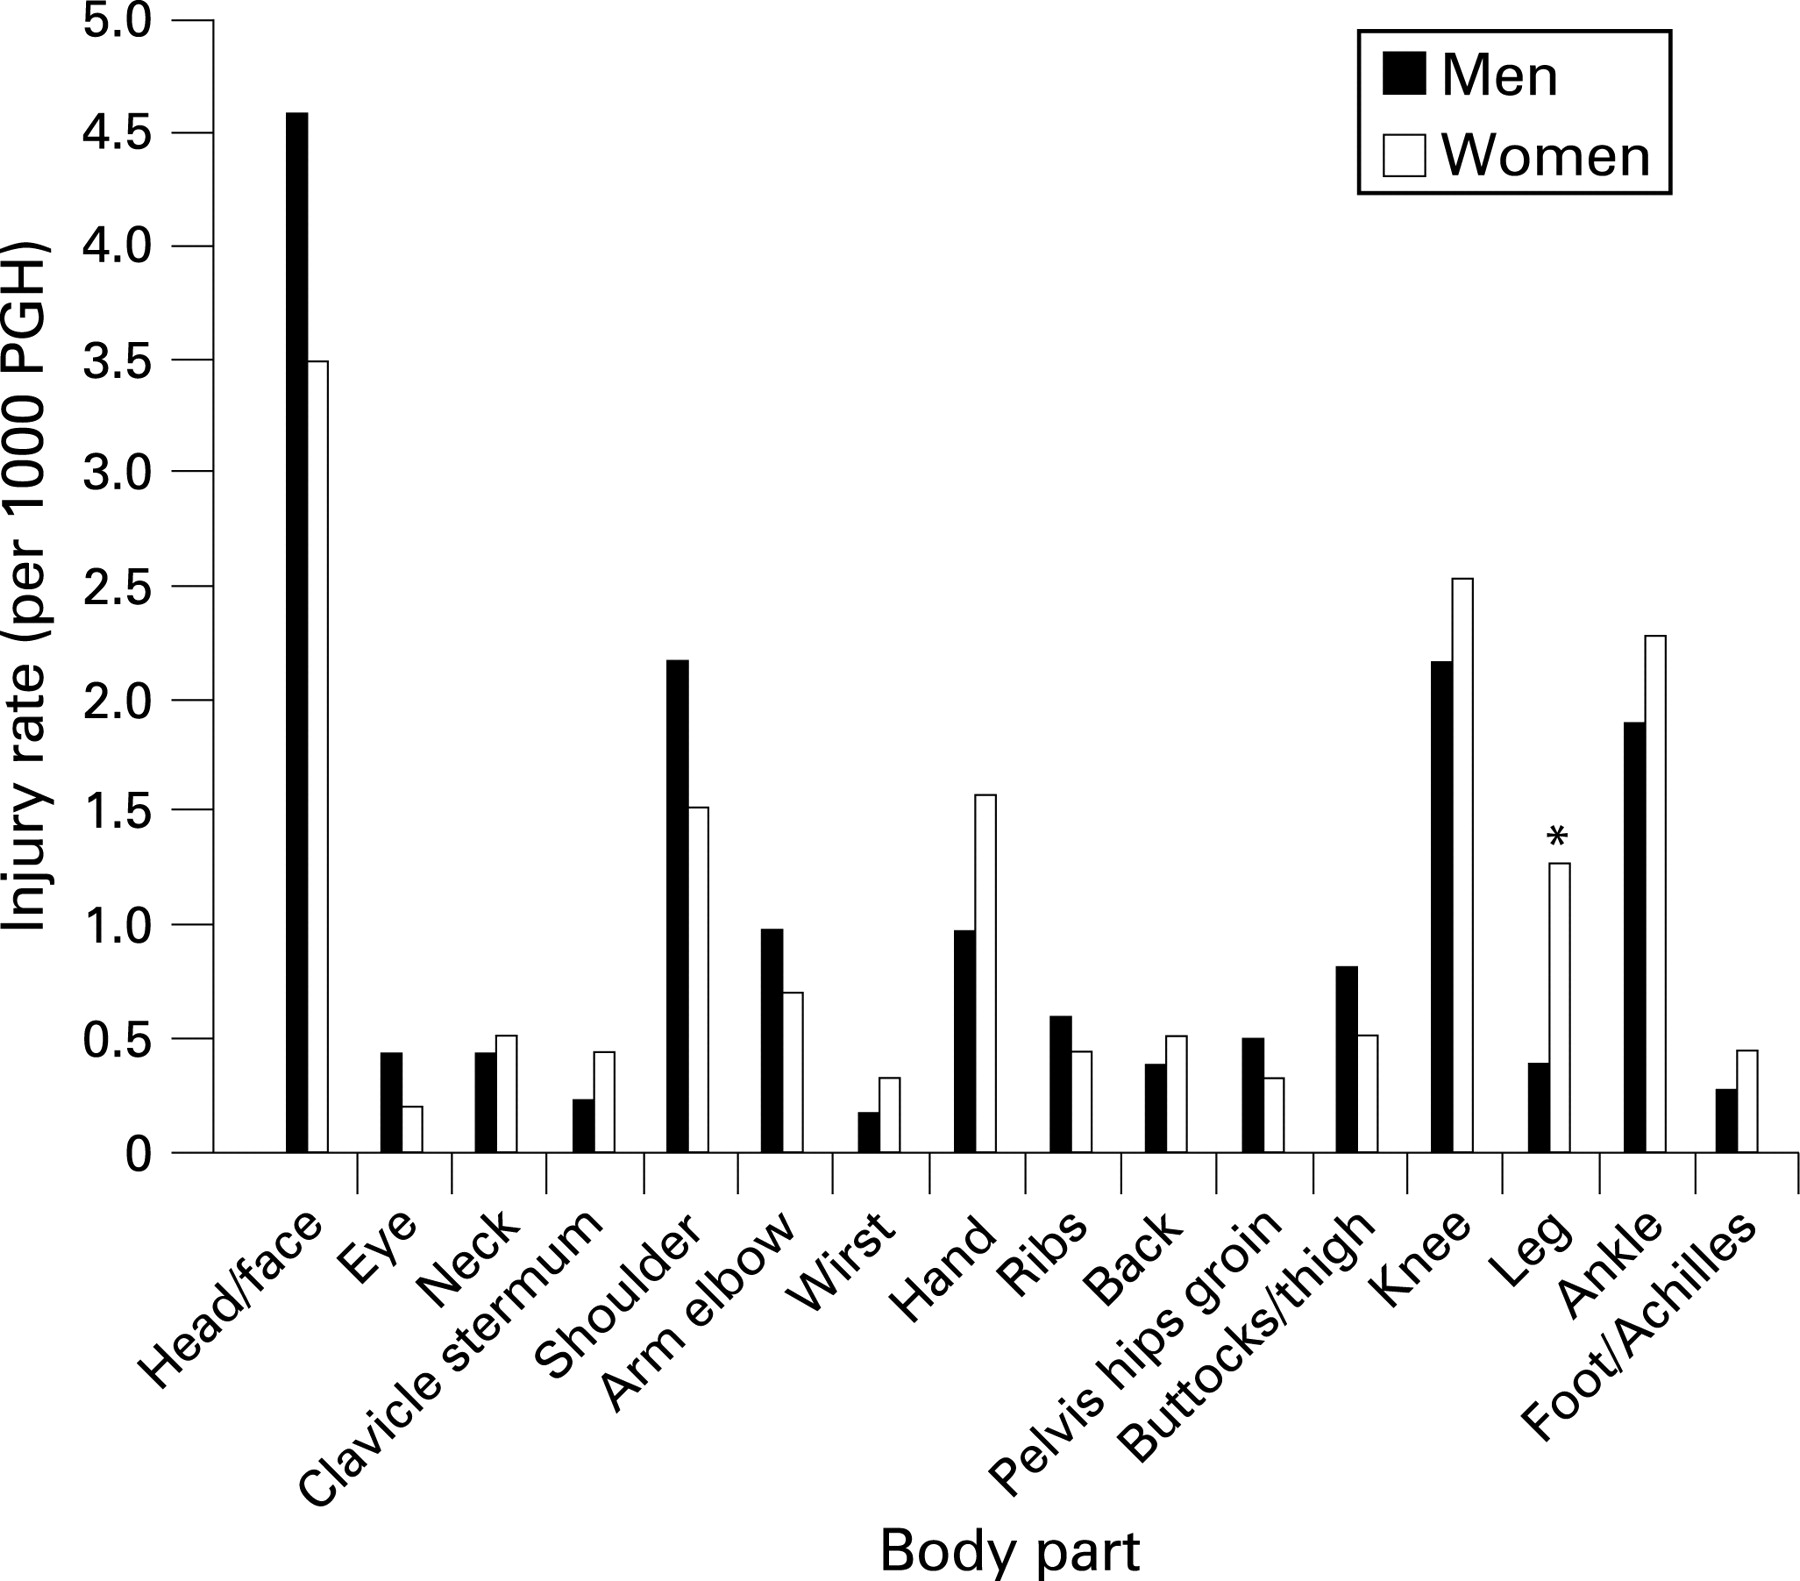
The head/face was the most commonly injured body site (games), and such injuries were predominantly of major severity (men and women) (table 3). Men had a higher incidence of head/face injuries than did women (games and practice), although this did not reach significance. Women experienced a significantly higher rate (p = 0.006) of lower leg injuries during games (⇓figs 2 and 3).


The highest incidence of injury during practice was reported for the head/face (men) and the knee (women) (table 4) with injuries of minor and major severity occurring in similar proportions. Men had a significantly higher rate of shoulder injuries in practice than women (p = 0.018) and a significantly lower incidence of injury to the buttocks and upper leg (p = 0.043).
There were no spinal cord injuries reported during the study, and all documented injuries were non-catastrophic in nature.23 This was verified by discussion with NERFU division heads after data collection was complete.
The overall incidence of major injury during games was 9.4 and 8.7 per 1000 PGH for men and women, respectively (by body site injured illustrated in fig 4). Major shoulder injuries were significantly more common for men.

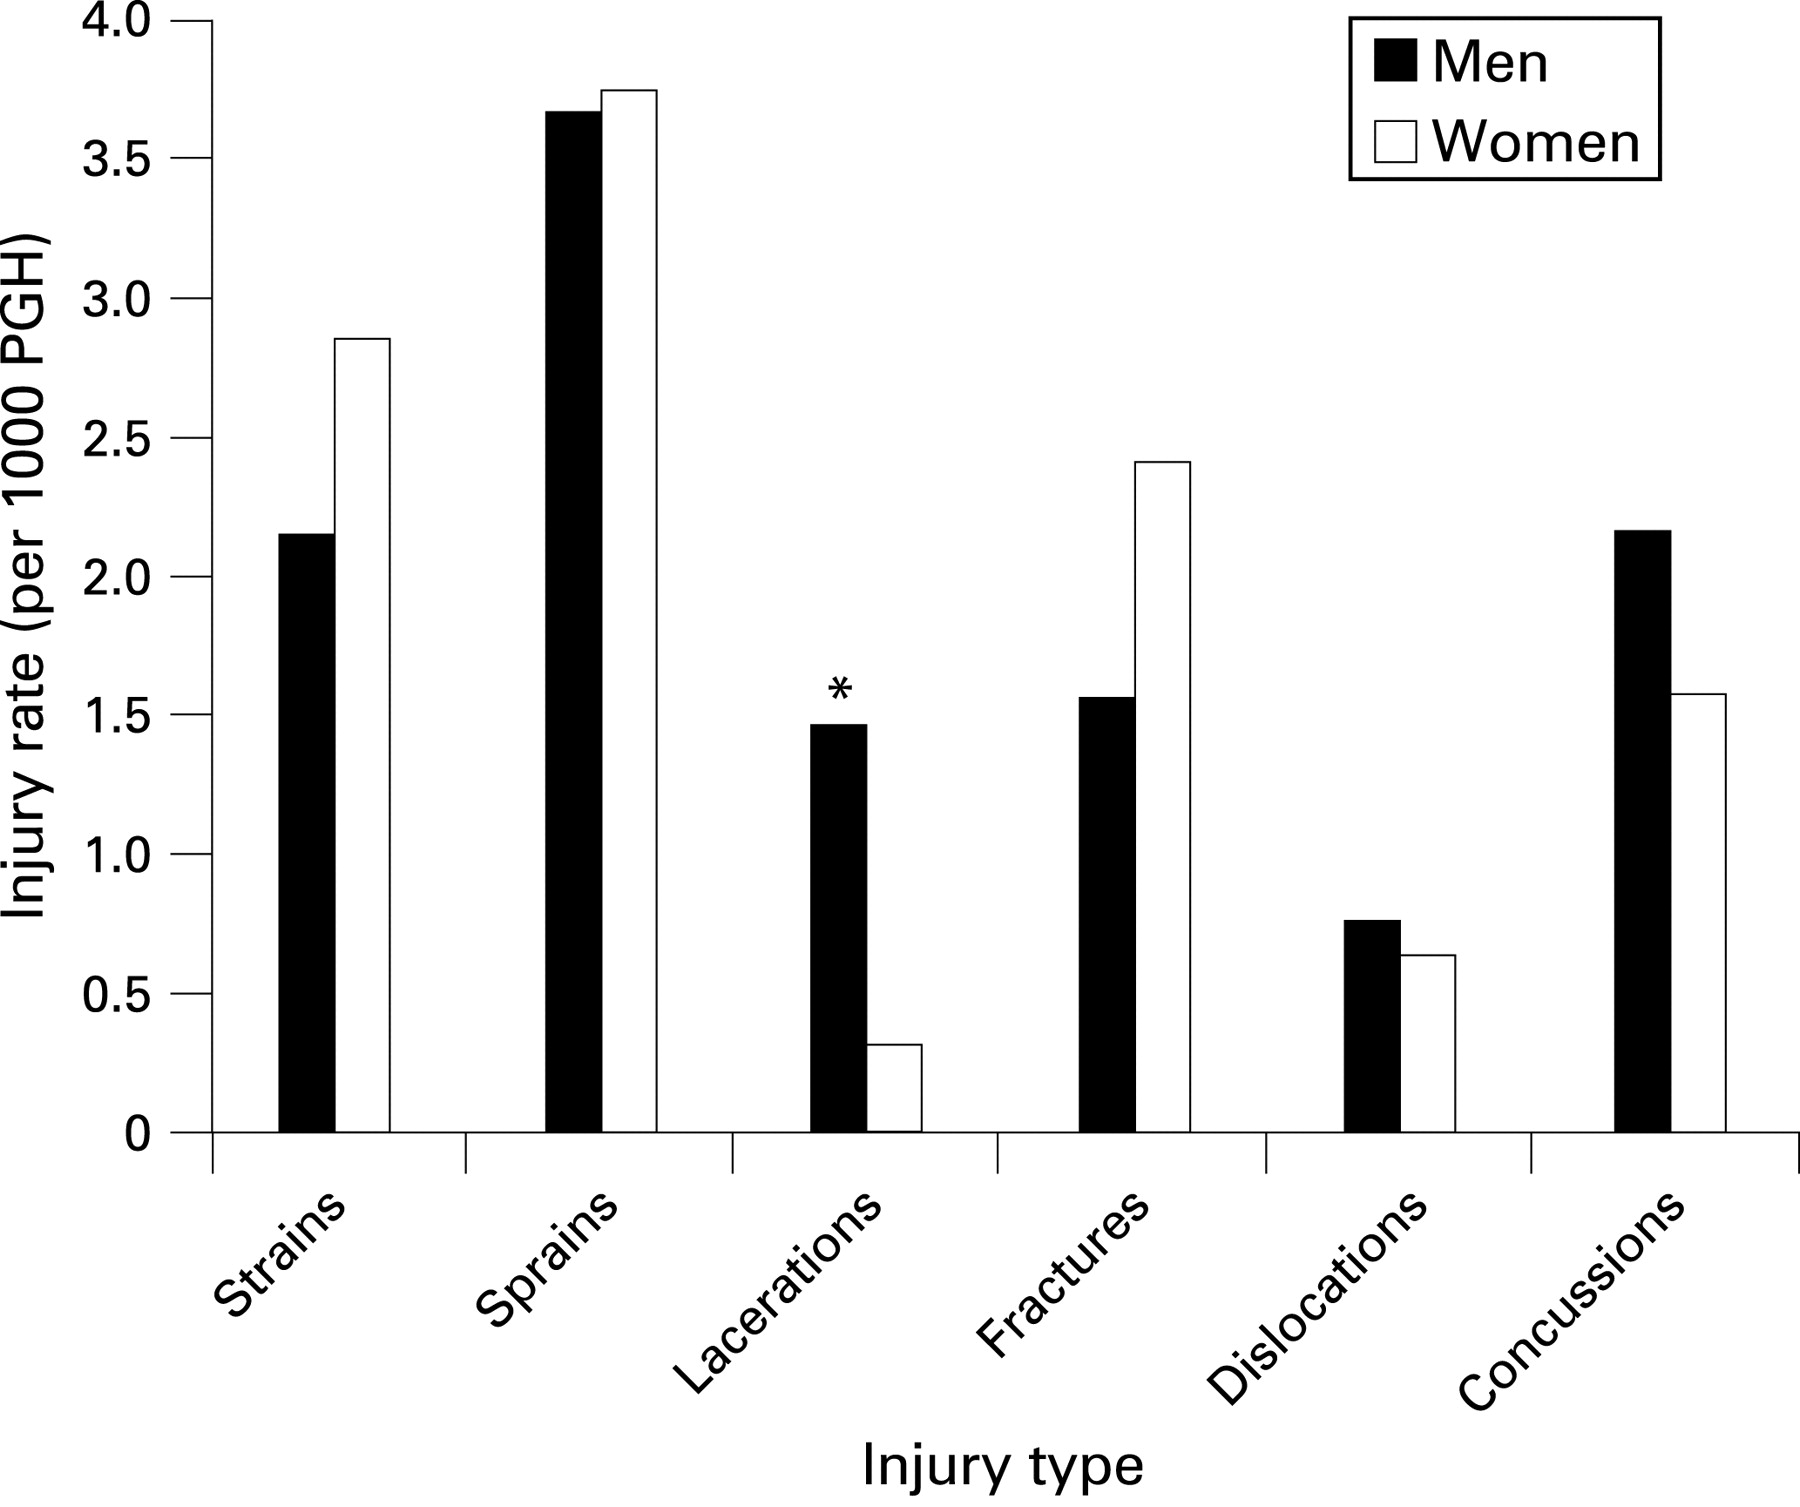
During games (table 5) and practice (table 6), sprains and strains were the most common injury types (fig 5). Men had a significantly higher number of lacerations during games than women (p = 0.002). PGH, player game hours.

Injury incident
During games and practices, for both sexes, most injuries occurred during contact with another player (⇓tables 7 and 8). The contact resulting in injury was most commonly being tackled, tackling and the ruck or maul (fig 6). Foul play was responsible for a slightly higher proportion of game injuries for men (4.5%) than for women (1.9%).

DISCUSSION
Our reported injury rates are similar to those rates reported for US collegiate soccer collected during the same time period (table 9), but much lower than for American football games.
Our game injury rates ( 16.9 vs 17.1 per 1000 PGH for men vs women) are also lower than previously recorded for amateur rugby (10.6–108 per 1000 PGH).6 31 32 Collegiate rugby players in the current study were of an equivalent age to 20–24-year-old amateur male players (20.4/1000 playing hours)31 and under-21 male Colts (81 per 1000 PGH and 12 per 1000 PAE)32 and female injury rates (20.5–48 per 1000 game hours and 7 per 1000 practice hours previously reported.12 32 33
Other investigations have suggested that rugby is associated with a significantly higher rate of injury than is soccer (table 10).22 Although we found a lower incidence of rugby injury overall, our rate for major injuries was higher than that reported by Junge et al.22
Methodological differences, such as use of a time loss definition, may result in reporting a lower injury rate.20 Our injury definition included medical attention injury, hence definitional issues alone are unlikely to explain our significantly lower injury rates. Under-reporting has been considered responsible for lower reported rates by some authors,34 although a high response rate can be achieved from amateur teams.31 The methodology used in this study and weekly communication with the teams facilitated consistent data collection. Injury rates are reported to increase as the standard of play increases.32 35–38 We believe that the lower level of US collegiate rugby union play is the most likely factor responsible for the lower rates of injury we report, although under-reporting remains a theoretical concern.
What is already known on this topic
Rugby union has a high injury rate during international and professional competition.
What this study adds
The lower competitive level of US collegiate rugby union may be responsible for the considerably lower injury rates we report here.
Competitive level of play dictates such variables as ”ball in play” time. For example, at the 2003 Men’s Rugby World Cup (RWC), the ball was in play 42% of the time.39 At the under-21 RWC in 2006, this decreased to 40%, with an average of 134 rucks/game.40 At the Women’s RWC in 2006, the ball in play time was 41% and an average of 131 rucks/game were reported.41 Fuller et al42 reported the propensity of contact events to cause injury, documenting 221.0 tackle events/game in professional rugby with 6.1 per 1000 tackle events resulting in injury.
US collegiate games may have a lower ball in play time and fewer rucks and tackles per game. Additionally, US collegiate players may exhibit different strategies and biomechanics in the tackle. The majority of injuries reported by Brooks et al43 were caused by tackling head-on (56%), although tackles from the side were associated with more severe injuries. Experience of the sport influences such skill levels. The majority of men’s players injured in our cohort had had 1–3 years experience of playing rugby union (<1 year 22.1%, 1–3 years 50.9%, >3 years 25.7%), and there were relatively more women injured playing their first season (<1 year 37.1%, 1–3 years 43.8%, >3 years 17.6%).
Comparing contact event injury rates between professional and collegiate rugby (table 11) suggests that collegiate players are four times less likely to be injured while tackling and three times less likely to be injured during rucks. Tackling or being tackled remained the game events with the highest incidence of injury, rather than the scrum or lineout, which is similar to previous reports.15 32 35 44 Foul play has previously been implicated in 6–13% of injuries;15 32 however, rates were lower (men 4.5%; women 1.9%) in our cohort.
US collegiate male game major injury rate was >4 times lower (9.4 per 1000 PGH) than previous estimates (40 per 1000 PGH;15 45 per 1000 PGH45) when similar definitions were used.
Our game to practice injury rate ratio was 4:1 for both sexes. Others have reported higher ratios (8.3,32 9.2,12 45.515 16). Assuming that practices averaged 90 minutes, our practice injury rates could be estimated at ∼3.7 per 1000 PGH, which is similar to previous reports (2–12 PGH15 16 32). A higher level of competitive play may correlate with higher injury rates in games, but not in practices; rates in practices are often determined by the specific activities inherent to the practice.20
In the current study, women had a very similar rate of injury to men (games and practices). This differs from previously documented rate ratios (1.6–2.2),33 where men have had higher rates. Recent estimates of female game injury rates (13.95–20.5 per 1000 PGH)12 are similar to ours (17.1 per 1000 PGH) and may have more relevance than earlier studies, performed while women’s rugby was becoming organised.31 32 Further injury surveillance is warranted to substantiate whether the competitive level of collegiate women’s rugby now resembles men’s, resulting in equivalent injury rates. Data from the Women’s Rugby World Cup suggests that the women’s game no longer differs from men’s in “ball in play” time and rucks/game.41
During games, we found that the flanker was the men’s position where most injuries occurred; others have identified locks,32 hookers and fly-halves,15 or the No 81 45–47 position as being the most frequently injured. We found that the highest percentage of major injuries occurred to the players in the No 8 position during both male (82%) and female (79%) games. Evaluation of contact events per position in the US collegiate game is critical to determine whether higher game injury rates for loose forwards are associated with a higher frequency of contact events in these positions. Fuller et al42 reported that backs were more likely to be injured in the tackle, where forwards were more likely to be injured in mauls and rucks. Given that centres were the most frequently injured female positions in our study, whereas others have reported that most injuries occurred to inside backs,32 attention to the tackle and particularly to differences between male and female players in this phase is warranted.
The highest incidence of injury by body part during collegiate rugby games was for the head/face (men and women), consistent with emergency room data for US rugby players,5 US high school rugby48 and others.1 33 45 47 49–51 Lacerations and concussions are the most commonly reported head injury types.33 45 We found that men had a higher game incidence of concussions (2.16 vs 1.58 per 1000 PGH) and lacerations (1.46 vs 0.32 per 1000 PGH) than did women, reaching significance for lacerations (p = 0.002), though lower than in elite rugby union (concussions 4.4 per 1000 PGH; lacerations 0.83 per 1000 PGH15). Caution is warranted in interpreting concussion incidence, as the diagnosis was not often made by a healthcare professional in the current study. The importance of recognition of concussion has been highlighted by many organisations, such as the Center for Disease Control in the USA.52 The relatively high frequency of this injury in male collegiate players is a clear indication that this should be an avenue for future research. Teams are recommended to follow the International Rugby Board guideline of 3 weeks’ mandatory exclusion from participation when a concussion is diagnosed,53 although established return-to-play guidelines differ.54 55
The leg was the most frequently injured body part in other investigations.15 16 32 Garraway and Macleod found the knee had the highest incidence of injury in amateurs (1.78 per 1000 playing hours in 1993, 2.36 per 1000 playing hours in 1998), and 3.99 per 1000 playing hours in professional players.31 35 Our reported incidence of knee injuries ( 2.16 vs 2.53 per 1000 PGH for men vs women) is also similar to reports in US women’s rugby.7 Knee injuries had the highest game injury severity in the current study (men and women), which again was similar to previous reports,15 56 with the tackle phase (particularly for backs) being the most frequently associated game event.
We found that women had a significantly higher rate of lower leg game injuries than men, and a significantly higher incidence of practice injury to the buttocks/thigh. These differences warrant further investigation with focus on hamstring strains, which may be preventable.57 Dislocations were more frequent for men in games (0.76 vs 0.63 per 1000 PGH for men vs women) and practices (0.17 vs 0.04 per 1000 PAE) in the current study. Men had significantly higher rates of shoulder injuries in practice (0.7 vs 0.21 per 1000 PAE for men vs women, p = 0.018) and of major shoulder injuries in games (p = 0.006). Higher incidences of shoulder injury (1.03 per 1000 playing hours)35 and shoulder dislocation rate (1.3 per 1000 player hours)15 have been described. Headey et al58 reported more severe shoulder injuries occurring during practice than games, highlighting defensive training sessions as carrying the highest risk of injury. Shoulder injuries, in particular dislocations and episodes of instability, represent another area worthy of further investigation of differences between the sexes in the game tackle phase and defensive training.
Limitations
Data collection was voluntary and was the responsibility of various members of our participating rugby teams. The majority (83%) were undertaken by non-medically qualified people, and hence the Orchard59 diagnostic classification was not applied.
Calculation of exposure rates for games in player hours was made possible by collection of game length data. This was not mandated for practices, which limits reporting of overall injury rate to rates per 1000 PAE. Although sufficient for comparison with NCAA ISS sport-specific injury incidence, this hampers comparison with injury incidence internationally.
Finally, our injury severity determination focused on documentation of playing absence ⩽7 days. Injuries resulting in greater absences were categorised as ”major” without documentation of the eventual length of absence. This precludes calculation of risk, and deserves greater attention in the future.
CONCLUSIONS
To our knowledge, this study provides the largest prospective cohort of collegiate rugby union in the USA to date. Our data indicate that US collegiate rugby union has a similar incidence and severity of injury to published rates for US collegiate soccer and a much lower game injury rate than collegiate American football (41.4 per 1000 exposures).30 Although participation in any activity has an inherent injury risk, US collegiate rugby union perhaps deserves recognition as a relatively safer sport than previously perceived. Continued injury surveillance is necessary to help the sport’s growth and reinforce this conviction.
Acknowledgments
The study was funded by the International Rugby Board, whom we sincerely thank. The considerable work of staff at the Division of Sports Medicine, Children's Hospital. Boston and team representatives collecting data is recognised and greatly appreciated. We also thank the IRB, US Rugby and the New England Rugby Football Union for their help in completion of the project.
REFERENCES
Footnotes
-
Funding: The International Rugby Board.
-
Competing interests: None.