Article Text

Abstract
Objective—To describe the trends in recreational sports injury in Perth, Western Australia.
Design—A prospective cohort study of sports injuries during the 1997 winter season (May to September).
Setting—Sample of Australian football, field hockey, basketball, and netball players from the Perth metropolitan area, Western Australia.
Methods—A cohort of sports participants was followed over the five month winter sports season. Before the season, participants completed a baseline questionnaire and during the season were interviewed every four weeks by telephone.
Results—Overall, 92% of participants (n = 1391) who completed a baseline questionnaire completed at least one follow up telephone interview. About half (51%) of the cohort sustained one or more injuries during the winter season accounting for a total of 1034 injuries. Most injuries were of moderate (58%, n = 598) or minor (40%, n = 412) severity, with only 3% (n = 24) requiring emergency department treatment or a hospital stay. The injury incidence rate was greatest for football (20.3/1000 hours of participation), similar for field hockey and basketball (15.2/1000 hours and 15.1/1000 hours respectively), and lowest for netball (12.1/1000 hours). The incidence of injury was greatest in the first four weeks of the season, and participants aged between 26 and 30 years had about a 55% greater risk of injury than those aged less than 18 years.
Conclusions—This is one of the first studies to show that recreational sports are safe. Although the likelihood of injury was greatest in the first month of the season, few injuries required admission to hospital or emergency department treatment. A greater emphasis on prevention in the early part of the season should help to reduce the elevated incidence of injury found at this time.
- injury incidence
- prospective study
- time at risk
Statistics from Altmetric.com
Take home message
An emphasis on prevention in the early part of the sports season may help to reduce the elevated incidence of recreational sports injury observed at this time.
There has been an increase in participation in regular physical activity among Australians.1 This is partly in response to the role it plays in the management and prevention of a number of conditions such as coronary heart disease,2 diabetes, osteoporosis, hypertension,3 and mental health disorders.4, 5 Although participation in regular physical activity is being promoted, attention is also being focused on another important health goal for Australia: to decrease the incidence and severity of injuries associated with sport and recreational activities.6–8 With increased participation in sport, the potential for an increase in the number of injuries is likely. As such, the benefits attributed to sport and recreational pursuits should be considered in the light of the physical risks as well as the direct and indirect costs associated with injury.
Sport related injuries are of concern internationally,9–11 as they have a significant social and economic impact on society. It is estimated that each year one in 17 Australians is injured sufficiently while playing sport to miss a game or training, to leave the field of play, or to seek medical or first aid attention.12 Three quarters of these injuries have been reported to occur in eight popular sports: Australian football, rugby league, rugby union, soccer, netball, basketball, field hockey, and cricket.12 Sports injuries are estimated to cost the Australian community about one billion Australian dollars a year.12
Despite these figures, there are only limited data about the occurrence of sports injuries in Australia, particularly at the community level of participation.13 One of the major reasons for this is that surveillance of sports injuries is particularly difficult.14 A review of emergency department or hospital admission records will only identify the more severe injuries.15 Also, the records are not comprehensive because of the lack of appropriate classification of sports injuries under the International Classification of Diseases, Ninth Revision external cause of injury codes. Furthermore, it is difficult to define the population at risk. Hence, it is virtually impossible to calculate the incidence of sports injury. Therefore, although there has been a documented increase in the number of people actively involved in sport and recreational activities,1, 16 the full extent of the sports injury problem is still to be elucidated.
In general, sports injury research in Australia has been fragmented,13 with most of the research focusing on a limited number of sports and often only including elite athletes.17–19 Consequently, few studies have produced information about the wider sporting community. Furthermore, it is likely that injuries incurred at the community level of participation differ from those for elite and professional players. It is important therefore to understand the incidence and nature of sports injuries at the community level. Continued research that focuses only on high or elite level sport, which is most of the published data, severely hampers the development and implementation of public health strategies for sports injury prevention at the community level.
This paper describes the epidemiology of sports injuries in Perth, Western Australia, reporting for the first time the incidence of injury per time spent participating in selected sports. This is the first prospective study of sports injuries at the community level in Australia.
Methods
OVERVIEW
A random sample of Australian football, field hockey, basketball, and netball clubs from the Perth metropolitan area (population of about 1.3 million) was identified. Participants from these clubs were selected and followed over the five month winter sports season between May and September 1997. To be eligible for inclusion in the study, participants needed to be competing at a non-professional or first class level; they were also required not to have sustained a sports injury in the three months before the study. A sports injury was defined, according to the Council of Europe definition, as an injury that occurs while participating in sport and leads to one of the following consequences: a reduction in the amount or level of sports activity, the need for advice or treatment, and/or adverse economic or social effects.20
Study participants were approached to complete the questionnaire by research staff before a training session or a match at the beginning of the winter season. The self report questionnaire took about 30 minutes to complete and was developed after an extensive review of the literature and a critique of instruments used in similar studies.21 The questionnaires were reviewed and modified after consultations with focus groups comprising health professionals and sports participants. The questionnaire was then pilot tested on a sample (n = 16) of the target audience and further modified when ambiguity occurred. The questionnaire included items about previous sports injury history, along with questions on preseason training, warm up, and cool down patterns. Specific questions about the equipment used, such as footwear and protective devices, were included as well as general health, lifestyle, and physical activity questions. To cover the domain of sports psychology, two validated instruments were incorporated into the questionnaire: the Five Factor Personality Inventory Test22 and the Athletic Life Experience Survey.23 The sports injury risk and protective factors alluded to above are not examined in this paper, but will be discussed in a future paper. Finally, demographic details were recorded.
Follow up of participants was undertaken each month (over a five month period) by a telephone interview, which took about five minutes. The telephone interviews were conducted by supervised staff from a telephone market research company using a computer assisted telephone interviewing (CATI) system. About 10% of all telephone interviews were supervised, a further 10% of phone calls were validated by a follow up phone call by a second interviewer, and no interviewer undertook more than 20% of the total telephone interviews. Structured questions were asked about how many training sessions and or matches were played during the preceding four weeks. These questions provided information about exposure to the risk of injury.
The severity of the injuries was classified into three levels: severe, requiring hospital admission; moderate, requiring health care attention (including treatment by a sports trainer); minor, requiring self treatment. The severity of injury was determined by self report. To assist with recall of information, each participant was supplied, at the time of recruitment, with a diary to record specific information on training, participation, and injuries.
If the participant was not available at the time of the telephone call, a further three attempts were made. The number of missed telephone calls was minimised by scheduling the calls at the most convenient time to the participant (this information was provided at the time of recruitment).
SAMPLE
The sample comprised participants in four sports that ranked in the top six in Western Australia on the basis of player registrations16 and injury rates12: Australian football, netball, field hockey, and basketball. On the basis of a 1993 census of Western Australian sports participants,16 a sampling frame of sports clubs across these four sports was established. The sports clubs were randomly selected with a sampling probability in proportion to the number of registered teams in each club. In addition, the sampling frame reflected the distribution of participation in the four sports: 36% of the clubs were Australian football, 25% netball, 25% field hockey, and 14% basketball. Depending on the number of participants needed to be recruited from each club, the club provided access to either one or as many as four teams. Research staff approached the selected teams to recruit participants.
The sample size estimate was based on data taken from previous research.12 On the basis of an injury rate of 10%, 1260 participants were necessary. This number was adjusted for the design effect (necessary because of the effects of clustering at the club and team level) and for a 10% attrition rate over the sports season. As a result of these adjustments, a sample (from the four sports) of 1512 was recruited. Table 1 reports the total sample size recruited and the proportion followed each month over the observation period.
Longitudinal cohort of sports participants' response, baseline to last follow up 1997
STATISTICAL ANALYSIS
A description of the demographic characteristics of the cohort and their putative risk factors was undertaken using SPSS software.24 Univariate statistics were computed, and variations in proportions were assessed using the Pearson χ2 test, with continuity correction where appropriate. Means across the four sports were compared using one way analysis of variance and, where appropriate, independent t tests. Age and sex specific incidence rates per 1000 hours of participation were calculated using the following formula: (number of new injuries in sport during the season × 103)/(number of participants in sport × total hours of participation in sport during the season). In this formula, the numerator includes new injuries sustained during the observation period. This means that the rate includes multiple new injuries to the same person. The total hours of participation reflects a combination of the number of training sessions multiplied by the average duration (in hours) of training sessions, and the number of games played multiplied by the standard game time for the sport. Statistical significance of time trends was assessed by computing a z score and corresponding p value around the rate differences. For rate ratios, we first computed the variance of the ratio of two rates using Kish's formula,25 and then computed 95% confidence limits around the ratio. Rate ratios were considered to differ significantly from one another if the 95% confidence interval (CI) excluded the value 1.0. The incidence rates and 95% CI were generated using SUDAAN software.26 This software took account of the complex nature (which was due to clustering) of the samples.
Results
COHORT DESCRIPTION
Overall, 92% of the participants (n = 1391) who completed a baseline questionnaire completed at least one (out of a possible five) follow up telephone interview. The reasons for not participating in the follow up interviews included: no follow up contact details provided at baseline (n = 42); participants did not meet the eligibility criteria (n = 11) or did not wish to participate in the study after completing the baseline questionnaire (n = 9). Comparison of key demographic variables across non-participants and participants showed few differences. No differential non-participation was evident on the basis of the sport code (χ2 = 5.67, p>0.05), and there was little difference between the mean age of non-participants and participants (22.2 and 23 respectively). However, significantly more men than women were non-participants (71% v 29%, χ2 = 8.41, p<0.001).
Some 68% (n = 1022) of the cohort participants were interviewed four or more times over the observation period. The follow up (four or more interviews) of participants varied between the four sports represented in the study, with the highest participation rates in field hockey (74%) and the lowest in basketball (62%) (table 1).
PERSONAL CHARACTERISTICS
The mean age of the participants (n = 1512) was 23 (range 9–56), with 54% (n = 814) being male. Table 2 reports their demographic characteristics by sport. Participants were predominantly single (69%), students (32%), either attending or having completed high school (80%), and with an annual household income of $30 000 or less (45%); 62% had private health insurance. There is an association between the demographic characteristics occupation (χ2 = 190.4, p<0.001), income (χ2 = 111.7, p<0.001) and education (χ2 = 137.7, p<0.001) and the sports code. For example, more field hockey players reported professional occupations (35%), household incomes in excess of $60 000 a year (22%), and a university education (38%) than footballers, netballers, and basketballers.
Demographic characteristics of cohort at baseline by sport
The distribution of males and females varied across the four sports. Australian football and netball had exclusively male (100%, n = 547) or predominantly female (93%, n = 352) participants respectively. Participation rates in field hockey favoured females (60%, n = 223) while in basketball, more males participated (54%, n = 107).
Questions about health related behaviour that may predispose participants to the risk of injury were asked at baseline (n = 1512). Overall, participants reported their health as being good to very good (83%, n = 1253), with 53% (n = 806) reporting no recurrent health problems in the past year. The most often reported health problems in the others were back ailments (17%, n = 249), asthma (16%, n = 240), and being overweight (6%, n = 91). Two thirds (n = 1015) of the participants indicated that they had no skeletal problems such as scoliosis or “knock knees”, but 18% (n = 266) reported having either “pronated feet” or “dropped arches”. At the time of recruitment in to the study, 85% (n = 1281) reported drinking alcohol on at least two days a week.
Two thirds (n = 1005) of the participants considered that they were physically active compared with colleagues of the same age and sex. Some 80% (n = 1199) reported undertaking vigorous exercise—that is, exercise that made them “breathe harder or puff and pant”—beyond participation in their nominated sport, with the majority exercising vigorously for more than two hours a month (61%, n = 928).
PREPARATION FOR SPORT
A total of 1214 participants (80%) reported that they trained in the preseason for their sport. There was an association between the sport code and preseason training (Π2 = 135.8, p<0.001), with football (92%, n = 505) and field hockey (85%, n = 333) players more likely to undertake preseason training than netball (69%, n = 262) and basketball (59%, n = 114) players. Throughout the season, football and field hockey players spent significantly more hours training (37 and 31 hours respectively) than basketball and netball players (20 and 14 hours respectively, F = 82.1, p<0.001). Some 79% (n = 1194) of the participants reported that they “very often” or “always” warmed up before training and the game. Warm up sessions generally involved skills work—that is, rudimentary and/or generic actions and skills of the sport—with less than 10 minutes jogging (76%, n = 1156) and stretching (73%, n = 1104). Very few undertook cycling (7%, n = 100), skipping (9%, n = 125), or aerobics (9%, n = 134) as part of their warm up. About one quarter (24%, n = 355) of the participants did not cool down after a game. Among those who did report cooling down after a game, 83% (n = 1259) indicated that they spent less than five minutes jogging and 63% (n = 951) spent less than five minutes stretching.
The remaining results relate to the 1391 participants who responded to one or more of the follow up interviews.
SPORTS EXPOSURE
On average, cohort participants spent 27.9 (range 0–185) hours training and 16.5 (range 0–96) hours playing in one of the four sports codes during the 1997 winter season. The median number of hours of participation in sports training and competition per month was higher for both field hockey (9.1) and football (10.1) players than basketball and netball players (about six). A decline in participation over the season was only evident for basketball players, decreasing from a median of eight hours in month 1 to 5.3 hours in month 5.
SPORTS INJURIES
Half (n = 701) of the participants sustained one (n = 231) or more (n = 470) injuries over the observation period, accounting for a total of 1034 injuries. This breaks down to 46% (n = 323) sustained by footballers, 28% (n = 198) by field hockey players, 16% (n = 112) by netballers, and 10% (n = 68) by basketball players. A significant difference (t = 2.17, df = 1424, p<0.01) was evident between the mean age of the injured and non-injured participants, with the injured participants being older (24 v 23). Also, there was an association between sex and the likelihood of injury (χ2 = 32.1, p<0.001) with more men than women being injured (62% v 38%). Some 58% (n = 598) of injuries were of moderate severity requiring health care attention, 40% (n = 412) of minor severity requiring self treatment, and the remainder (3%, n = 24) were classified as severe, requiring treatment at an emergency department or hospital. Most injuries requiring health care attention were seen by either a physiotherapist (42%, n = 254) or general practitioner (33%, n = 195).
The three most often reported injuries were muscle strain or tear (28%, n = 294), bruising (contusion/haematoma; 25%, n = 263), and a ligamentous strain or tear (21%, n = 214). The frequency of injury diagnoses varied between sports. Of the 279 injuries in field hockey, the most commonly reported diagnosis was contusion/haematoma (39%, n = 109). In contrast, of the 347 football injuries, 34% (n = 118) were muscle strains or tears, while ligament strains or tears were common in basketball (36%, n = 33) and netball (37%, n = 54).
INCIDENCE RATES
The injury incidence rate (IR) for the entire cohort was 16.7 injuries per 1000 hours of sports participation (95% CI = 15.8 to 17.6) (includes competition and training). It was greatest for football (20.3/1000 hours, 95% CI = 18.9 to 21.8), similar for field hockey and basketball (15.2/1000 hours, 95% CI = 13.6 to 16.8 and 15.1/1000 hours, 95% CI = 12.3 to 17.8 respectively), and lowest for netball (12.1/1000 hours, 95% CI = 10.3 to 13.9). Figure 1 reports the trends in incidence rates for the four sports at each follow up period. It is evident that they were greatest for all participants in the first four weeks of the season (April to May 1997) and then declined. Of particular note is the minimal rate of decline (18%, z = −0.691, p>0.05) between the first and second follow ups (month 1 to month 2) for basketball compared with significant declines of about 43% in the other sports codes. It is not until the fourth follow up period (July to August 1997) that a significant (z = −2.21, p<0.05) decline is evident in the incidence rate of basketball injuries.

Incidence rates of sports injury by sport code.
Of interest is the highest incidence of injury in the first four weeks of the season (April to May 1997) for footballers (IR = 29.1/1000 hours, 95% CI = 25.6 to 32.8) and netballers (IR = 28.9/1000 hours, 95% CI = 20.7 to 37.0). However, the incidence of injury in netball declined in the second month, and this sport showed the lowest overall injury incidence rate of the four when all follow up periods were combined.
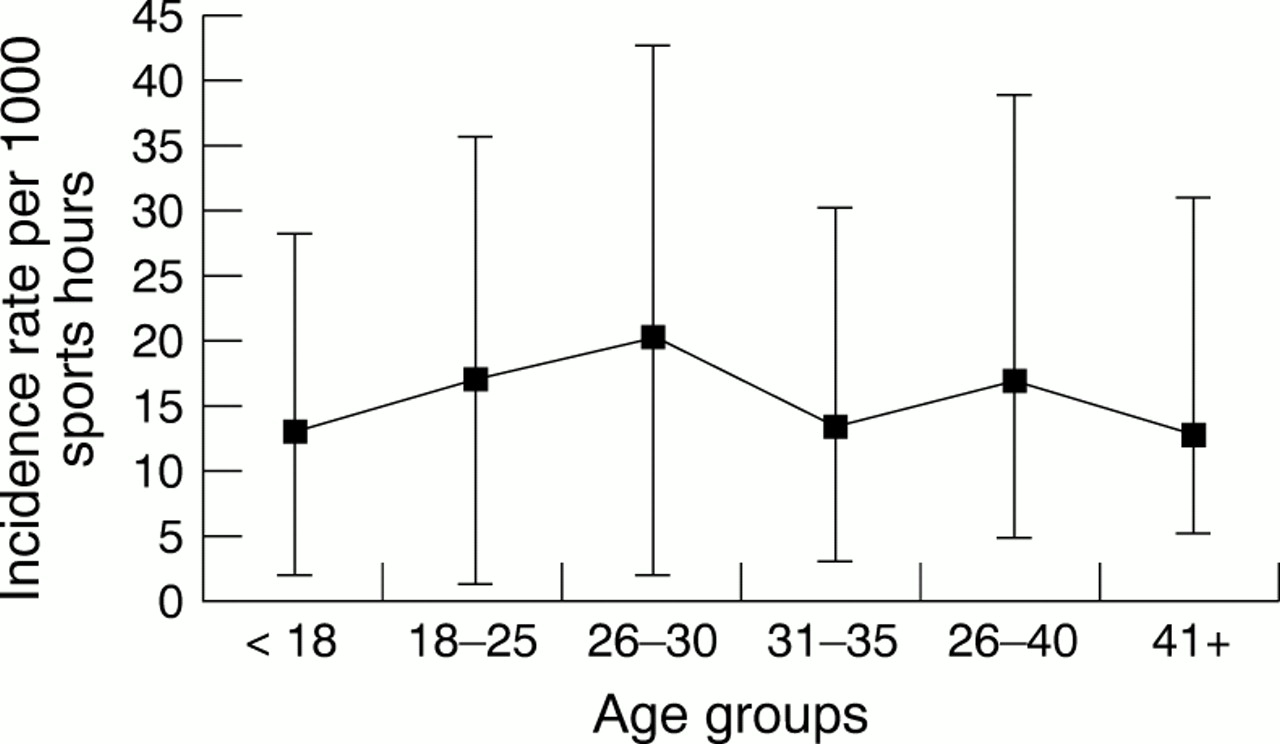
Men had a greater risk (IR = 19.0/1000 hours, 95% CI = 17.7 to 20.2) than women (IR = 13.6/1000 hours, 95% CI = 12.3 to 14.9). The IR reached a peak in the age group 26–30 years (20.2/1000 hours, 95% CI = 18.0 to 22.3). It is evident from fig 2 that a plot of the incidence of sports injury is “m” shaped, with lower rates of sports injury among the youngest players (aged less than 18 years), participants in their early thirties (aged 31–35), and the oldest participants (aged 41 years and older). The rate ratio for sports injury between participants aged 26–30 years compared with those less than 18 years was 1.55 (95% CI = 1.16 to 1.93), indicating that those aged between 26 and 30 years have significantly higher (about 55% higher) risk of injury than those aged less than 18 years. The rate ratio is also elevated for participants aged 18–25 years compared with those less than 18 years (1.31, 95% CI = 1.00 to 1.63).
Incidence of sports injury by age group.
Discussion
In contrast with other longitudinal studies investigating the incidence of sports injuries,21 this study recruited sportspeople who were not participating at the elite level and who played sports with the largest proportion of player registrations. Also, the design of the study minimised limitations of previous research,21 namely recall bias of injury events, by including monthly interviews with each participant. The frequent follow up also enabled estimates of the time at risk of injury to be collected for each participant.
Some 92% of participants completed at least one follow up telephone interview, and 68% completed four or more. The participation rate was lowest at the first follow up and this was due, in part, to the staggered recruitment of the cohort. Consequently, about 47% of baseline questionnaires (which contained the contact details needed for telephone follow up) were not received until at least two to three weeks into the first four week follow up period. The participation rates also varied between the four sports, with basketball having the lowest rate. This may reflect, in part, the lack of structure for this sport at the community level. For example, many of the participants played in local recreation centre social teams, and a characteristic of these teams is the lack of the formalised club structures found in other sports.
Half of the participants sustained one or more sports injuries over the period of the study (five month season). This is considerably lower than an estimate from a study undertaken in New Zealand, which reported that 82% of participants were injured during the 1992 winter season (5.5 months).21 However, the latter study only included rugby union players, and, as this is a full contact sport, it is not directly comparable with the current study, in which 25% of the cohort participated in a non-contact sport. However, comparing the results from the New Zealand study with the results for a contact sport in this study, Australian football, the proportion of participants injured still was considerably lower (22% lower). It is unlikely that the large difference in the proportion of injured players between the two studies can be explained by the length of follow up (there is a two week difference in follow up between the studies) or differences in study design (both are prospective cohort studies). Furthermore, the lower injury rate in Australian football than in rugby union cannot be explained by differences in the definition of sports injury; the definition of injury in this study was likely to include more cases than that used in the New Zealand study. It is likely therefore that the differences in the injury rates are, in part, due to the distinct differences between the football codes.
In this study, 20% of netball players sustained an injury that required attention by a health care professional. This is in contrast with a descriptive study of netball injuries by Hopper et al27 which reported that 5% of participants sustained an injury that required health care attention. The reason for this is related to the exposure period of interest. We included both training and match time whereas Hopper et al27 included only match time. It is not surprising that our estimate is higher given that the time spent training is generally twice that spent playing.
The injuries sustained by the cohort participants were almost all of an acute traumatic nature. However, as our definition of injury was not sensitive to overuse injuries, we were unable to determine to what extent injuries were due to overuse. Despite this, there were relatively few serious injuries reported in this study, and this may reflect the fact that the sample did not include elite athletes. Other studies have indicated that competition at the elite level produces more severe injuries.27 Our finding that only 2% of injuries required emergency department treatment and 1% admission to hospital is in contrast with an earlier report by Egger12 that estimated 20% of sports injuries required a hospital stay. However, Egger's estimates were not population based and relied on crude models, which may explain why his figures overestimate those in the present study. Our figures are consistent with a recent community based study of sports participation and associated injury in the Latrobe Valley in Victoria.28
An interesting finding from this study is the increased incidence of injury during the first month of the season. Although the incidence of injury is elevated during the first month for the four sports, it is particularly so for Australian football and netball. Other than the difference in sex between the participants of the two sports, the most striking difference is that netball is a non-contact sport. The non-contact nature of netball should therefore reduce the risk of injury. Consequently, it is difficult to discern what features of netball place players at the same risk as footballers in the early stages of the season. The increased incidence of injury in netball may, in part, be attributed to the fact that only 69% of participants undertook preseason training compared with 92% of footballers. Also, given that ankle injuries were the most commonly reported injury in netball, the reduced participation in preseason training may place the participants at greater risk. For example, inadequate skills training and match preparation may contribute to poor proprioception which is necessary for ankle stability. It is not sufficient simply to indicate that the elevated incidence at the beginning of the season is due to lack of match fitness. It could also reflect the participants' intense motivation to win at the beginning of the season,29 although this explanation should apply across all sports codes in the study. To date, there is a paucity of research that examines the association between injury and motivation.
Almost 80% of the participants reported that they warm up before training or playing and 76% reported cooling down after training or playing. Although most reported warming up or cooling down, the sessions were not comprehensive and lasted less than 10 and five minutes respectively. It has been suggested that warm up and cool down sessions contribute to reduction and prevention of injury.30 However, recent literature suggests this may be a moot point.31 Further research is necessary to determine whether warm up and cool down sessions actually are protective against injury. Until the research is undertaken, before and after training or game preparation should continue to be advocated.
There are a number of limitations that need to be considered when interpreting the findings from this study. Firstly, it was beyond its scope to validate injury outcomes, and therefore all injuries were self reported. The likely consequence of this is unreliable numerator estimates in the incidence rates as well as unreliable estimates of self reported injury severity. We believe, however, that the bias is minimal because of the following strategies that were incorporated into the design of the study: frequent follow up, filter questions in the telephone survey to determine correct classification of injury status, and objective criteria for classifying the severity of injury. A second source of error is the level of accuracy of self reported participation in training and/or playing matches. We were aware that this was a potential threat to the validity and therefore adopted two approaches to minimise the bias. Firstly, all participants maintained diaries (refrigerator magnets) upon which they recorded their weekly training and or matches. At each monthly phone interview, the interviewer asked the participant to refer to the diary to assist with recall of exposure. Secondly, we restricted the level of participation to aggregate levels such as the number of games played and training sessions attended per month. As alluded to earlier, limitations in the definition of a sports injury applied in this study also meant that overuse injuries may not be reflected in the statistics. Finally, although every attempt was made to minimise loss to follow up, 32% of participants did not complete four out of five telephone interviews.
This is one of the first studies to show that recreational sports are safe. Although the likelihood of injury was greatest in the first month of the season, few injuries required admission to hospital or emergency department treatment. A greater emphasis on prevention in the early part of the season should help to reduce the elevated incidence of injury observed at this time. Consequently, in their efforts to promote physical activity for the management and prevention of chronic disease, clinicians can safely encourage recreational sports participation.
Acknowledgments
We would like to thank Ms Karen Jones and Ms Anne Johnston from Sports Medicine Australia (Western Australia Branch) for overseeing the running of the project, Dr Michael Levitan for data management, and the participants for giving their time. The Western Australian Health Promotion Foundation (Healthway) provided financial support for the project.
Take home message
An emphasis on prevention in the early part of the sports season may help to reduce the elevated incidence of recreational sports injury observed at this time.