Article Text

Abstract
Objective The objective of this study was to identify timing distribution and predictors of deaths following road traffic injuries among all age groups at Gondar Comprehensive specialised hospital.
Design A single-centre prospective cohort study.
Setting The study hospital is a tertiary hospital in North West Ethiopia.
Participants We enrolled 454 participants who sustained road traffic injuries in to the current study. All age groups and injury severity were included except those who arrived dead, had no attendant and when the injury time was unknown.
Primary and secondary outcome measures The primary outcome was time to death measured in hours from injury time up to the 30th day of the injuries. Secondary outcomes were prehospital first aid, length of hospital stay and hospital arrival time. The article has been registered, with a unique identification number of research registry 6556.
Results A total of 454 victims were followed for 275 534 person hours. There were 80 deaths with an overall incidence of 2.90 deaths per 10 000 person hours of observation (95% CI 2.77 to 3.03). The significant predictors of time to death were being a driver (AHR=2.26; 95% CI 1.09 to 4.65, AR=14.8), accident at interurban roads ((AHR (Adjusted HAzard Ratio=1.98; 95% CI 1.02 to 3.82, AR (Attributable Risk)=21%)), time from injury to hospital arrival (AHR=0.41; 95% CI 0.16 to 0.63; AR=3%), systolic blood pressure on admission of <90 mm Hg (AHR=3.66; 95% CI 2.14 to 6.26; AR=57%), Glasgow Coma Scale of <8 (AHR=7.39; 95% CI 3.0819 to 17.74464; AR=75.7%), head injury with polytrauma (AHR=2.32 (1.12774 4.79; AR=37%) and interaction of distance from hospital with prehospital care.
Conclusion Though the maturation of trauma centres in many developed countries has changed the temporal pattern of deaths following any trauma, our study demonstrated that trauma deaths follow the traditional trimodal pattern. That implies that potentially preventable causes of death continued in low-resource countries.
- accident & emergency medicine
- public health
- orthopaedic & trauma surgery
- trauma management
Data availability statement
Data are available upon reasonable request. Extra data can be accessed via the Dryad data repository at http://datadryad.org/ with the doi:10.5061/dryad.s4mw6m979.
This is an open access article distributed in accordance with the Creative Commons Attribution Non Commercial (CC BY-NC 4.0) license, which permits others to distribute, remix, adapt, build upon this work non-commercially, and license their derivative works on different terms, provided the original work is properly cited, appropriate credit is given, any changes made indicated, and the use is non-commercial. See: http://creativecommons.org/licenses/by-nc/4.0/.
Statistics from Altmetric.com
Strengths and limitations of this study
As far as our search is concerned, this is the first study of its kind investigating road traffic injury prospectively using an advanced statistical method (survival analysis).
Follow-up of victims was extended after discharge from the hospital up to 30 days.
The dropout rate was minimal.
Out of hospital deaths were excluded.
Background
Annually, nearly 6 million people die from injury, which is more than deaths caused by a combination of HIV, tuberculosis and malaria.1 Besides, every fatal injury is responsible for 20–50 non-fatal injuries that influence productivity and consequently affect economic development.2 3 Road traffic injuries are among the leading causes of trauma that affect a country’s economies. That is because it mainly affects the economically active segment of the population.4 It impacts more than 3% of gross domestic product for most countries.5 For example, it resulted in 2.1% of economic losses in Ethiopia in 2015.6 The World Bank estimated that the cost of road crash injuries is about 1% of the gross national product in low‐income countries, 1.5% in middle‐income countries and 2% in high‐income countries.7 Road traffic injury-related mortality continues to increase from time to time globally, but its burden is more than three times higher in low-income countries.8 This discrepancy is partly due to the immature trauma care system, both in the prehospital and in-hospital settings.9–11 Even though Ethiopia has adopted safety legislation that protects vulnerable road users, there is still a considerable gap in practicing traffic laws on drunk driving, seat belt wearing, speed limits, helmets and child restraints. These are possible explanations for the high prevalence of road traffic injuries and mortalities in Ethiopia.12
Ethiopia is one of the poorest countries with a double burden of communicable and non-communicable diseases.13 The country has one of the highest road traffic injury-related mortality in the sub-Saharan region.14 Despite the efforts made in the training of key emergency personnel, there is no well-established emergency medical system to provide prehospital trauma care.15 The only available emergency service is the infrequent Ambulance transportation, which itself lacks healthcare professionals’ support.16 These are the main factors explaining the higher fatality following a traffic injury in Ethiopia.17 18
Among many factors affecting deaths following a trauma, time from injury to death has attracted the attention of several scholars for three decades.19–21 The mortality pattern was described as a trimodal pattern by Trunkey in 1983.19 According to Trunkey, there are three peaks of deaths following trauma. The first peak of death occurs immediately within minutes of the injury. Most deaths at the scene are from non-survivable injury to the brain and thorax.22
The second peak occurs within the first 4 hours of injury.23 The second peak occurs within the first 4 hours of injury.23 The most common causes of death during the second peak are severe cardiovascular and intra-abdominal injuries.24–26 Well-organised prehospital care and timely definitive care at hospitals could avoid these deaths.27
The third peak of death following trauma, called ‘late deaths’, occurs after the first week of injury.28 Such deaths have resulted from late complications such as sepsis and multiple organ failure.29 The advance in the trauma care system in most developed countries has significantly reduced late deaths. That has changed the classical trimodal pattern of deaths following trauma into a bimodal pattern.21 27–30 However, studies from low-income countries showed that it still follows the classical trimodal pattern.31
Delays in hospital arrival are among various factors determining the time to death following injury.32 In most areas of low and middle-income countries, ambulance service is not available to transfer victims from an accident scene, and if at all available, there is poor coordination between ambulance staff and hospital staff. This poor coordination results in delays in trauma care at the healthcare facility.33 In countries like Ethiopia, where there is no prehospital trauma care system and poor road infrastructure, delays in hospital arrivals are apparent. That could be one reason for the high mortality rate following road traffic injuries. According to a WHO report, the mortality rate from road traffic injuries was 25.3 and 26.7 per 100 000 populations in 2015 and 2018, respectively.7 8
There is a paucity of information on the pattern of mortality following traumas in the study area. The few available studies are cross-sectional and document based which lacks information on important predictors. The previous studies are often institutional-based and only included deaths in the hospital ignoring late deaths at home.17 18 There was also a methodological gap in the analysis in that it ignores the time component of death.
There is also a scarcity of evidence on hospital arrival time, time to death and predictors of mortality following a road traffic injury in the study area. This study aimed to identify the proportion of victims who got prehospital care at the scene of injury. It also describes hospital arrival time, time to death and its predictors following road traffic injuries. The analysis of trauma-related death is a crucial step for the development and improvement of trauma care systems.
Methods
Study design
It is a single-centre prospective hospital-based follow-up study, from 1 May 2019 to 30 February 2020, at the north Gondar zone, North West Ethiopia.
Study settings
The study hospital is one of the referral and Teaching Hospitals in the country. With more than 500 bed capacity, it provides basic and advanced services at its different units, including a 24-hour emergency department receiving all emergency cases.
Musculoskeletal and head trauma cases are cared for by four orthopaedic surgeons and one neurosurgeon. General surgeons and specialists in other fields such as thoracic, gastrointestinal, genitourinary and maxillofacial surgery are also assigned 24-hour on-call to manage trauma cases. The emergency department is run by 29 nurses assigned on 24 hours rotation. Every day, five surgical residents and one senior orthopaedic surgeons deliver their expert care in the emergency department. The emergency department provides initial evaluation and resuscitation for trauma victims. The maximum observation time in the emergency department is 24 hours, after which the patient is either discharged, admitted to the appropriate unit or referred.
The hospital provides general operative services in two minor surgery facilities and one main theatre complex. There are also operative services at obstetric unit, fistula, dental and ophthalmic operative units.
The hospital has a radiology department staffed with five senior radiologists and other supportive technicians. The available imaging services include conventional radiology, ultrasonography, MRI and CT.
Based on our pilot study, trauma constituted nearly 30% of emergency-related admissions in the hospital. Concerning emergency response, the hospital provides 24 hours trauma services, but there are no established out-of-hospital emergency care services.
Eligibility criteria
All traffic injury victims regardless of age and sex were included except those who were dead on arrival, comatose and had no attendant. We also excluded victims when the time of injury was unknown. The enrolled participants were observed on daily basis using a predesigned checklist.
Study variables
The primary outcome was time to death measured in hours between road traffic injury and the 30th day of injury. Accordingly, those victims who died between injury times to the 30th day of injury were events, and those who were still alive on the 30th day were censored cases. Secondary outcomes were prehospital first aid, length of hospital stay and hospital arrival time. The exposure variable was having any degree of injury by any vehicle. The independent variables were sociodemographic factors (age, sex, educational status, occupation and residence of the victims and the distance between accident location and hospital), accident-related factors (road user category, type of vehicle, time of the accident, day of the week, lighting condition), prehospital first aid, means of transport to the hospital, hospital arrival time, anatomic body region injured, vital signs, neurologic status and injury severity score.
Data sources/measurement
We included all road traffic injury victims who visited the hospital during the data collection period. We excluded victims who arrived dead, were comatose and with no attendant and unknown injury time.
Four trained data collectors collect the data using a structured and tested checklist. The information collected includes epidemiological variables, crash characteristics and hospital arrival time. Additionally, we collected data on road user category, availability of prehospital first aid, type of transportation used to transfer the victim, clinical findings, the outcome in the emergency department and decision after evaluation at the emergency department. We collected data regarding road traffic injury-related events and prehospital factors from the victims or the relatives accompanying the victim.
Interviewing a victim was done after securing the initial lifesaving management at an emergency department. For seriously sick victims unable to communicate, we collect data from the caregivers. The maximum follow-up time was 1 month. Victims discharged before 1 month and sent home the same day were contacted by phone on the 30th day of injury to know their status.
We collected the immediate cause of in-hospital mortality from the victims’ medical records. For late deaths that occurred after hospital discharge, we collected verbal autopsies from family or attendants. Verbal autopsy was collected by phone.34 A checklist was developed for the verbal autopsy that incorporates relevant information. The verbal autopsy checklist comprised the clinical condition of the victims during the last days of survival.
Source of bias and minimising strategy
The severity of the injury is one possible source of bias in this study. Thus we enrolled participants regardless of an injury severity score. To minimise bias due to attrition, we explained the value of remaining in the study for participants.
We made a repeated attempt to contact participants after discharge from the hospital to know their status on the 30th day of injury. We also took multiple contact numbers to access the victims or proxy. The data collection tool was also piloted and standardised to avoid interviewer bias. Bias due to instrument error was minimised, by taking measurements repeatedly. Bias due to differential selection was minimised by including all degrees of injury (mild and severe cases) at the design stage. At the analysis stage, bias due to confounding was minimised, by conducting multivariable analysis and stratified analysis. We used a predefined and prepared data management plan to avoid selective reporting bias.
Sampling and sample size
The sample size was calculated using the sample size calculation formula for survival analysis using STATA V.14. Considering the following assumptions, α=0.05, β=0.2, HR=0.643, taken from a study conducted in Turkey indicating hazard of death among victims with low Glasgow Coma Scale (GCS) was 0.64%,35 probability of an event from pilot study=0.28 (SD=0.5), and amount of event/probability of an event. Therefore, event=121, n=amount of event/probability of event=121/0.28=432, and considering 5% loss to follow-up=454.
Operational definition
The trauma severity score was computed using the ‘Revised Trauma Severity Score’ based on three parameters. These parameters are the GCS, respiratory rate and systolic blood pressure (SBP).36 According to the revised trauma score (RTS), these three parameters are coded and summed up (table 1).
Parameters used to measure revised trauma score (RTS)
Data analysis
We used STATA V.14 software for analysis. Tables and graphs were used to summarise descriptive results. A Cox regression model was employed to identify factors that influence mortality. The Cox regression model is the most popular regression technique for survival analysis. Cox regression model examines the impact of various predictors of the risk of death and also accounts for censoring in the data.37 Variables with a p<0.25 in the univariate Cox regression model were included in the multivariate analysis. We estimated HRs and 95% CIs.
A cut-off value of p<0.05 was used for statistical significance. Non-parametric tests such as the Kaplan-Meir estimate, life table and log-rank tests were employed. Log-log survival curves were used to assess the proportional hazard assumption based on Schohenfield residuals. Both bivariable and multivariable analyses were employed. Interaction of covariates on the main outcome was examined as necessary. Multicollinearity was assessed using variance inflation factor. We used the Strengthening the Reporting of Observational Studies in Epidemiology Checklist for reporting. Missing data were handled using available case analysis.
Patient and public involvement
At the design stage, the proposed study was discussed with stakeholders, including the traffic office and zonal health departments. Because of the nature of the study, which involved emergency cases, we couldn’t involve patients at the design stage. We informed the participants during data collection about the importance of the study to the community in the future. The policy brief will be prepared in the local language (Amharic) and will be disseminated to decision-makers and programme implementers.
Results
Characteristics of the study subjects
Out of 11 960 trauma patients who visited the emergency department between 6 May 2019 and 30 February 2020, 3084 cases were trauma victims of which road traffic injury constituted (18.2%). Four hundred fifty-four participants were enrolled and studied during the study period, and we excluded 106 from analysis because of incomplete information (online supplemental file 1). The study participants comprised 327 (72%) men and 127 (28%) women, resulting in a male to female ratio of 2.6:1.
Supplemental material
The majority of the participants were in the productive age group. The mean age was 29±15.5 years. The median age was 27 years (IQR: 19–37 years). The majority of the road traffic injury victims were pedestrians (232), followed by passengers (168) and drivers (54). As to the educational status, only 130 (28.6%) of the victims completed secondary education, while 144 (31.7%) were unable to read and write. The majority of the victims, 116 (25.5%), were farmers by occupation, followed by students (70). Two hundred sixty-four (58.1%) of the victims were urban, while 190 (41.9%) were rural dwellers. Nearly 60% (240) of the victims were from urban areas. The majority of accidents, 402 (88.5%), were sustained during daylight. Tuesday and Friday were found to be, the days with the highest frequency of accidents (table 2).
Characteristics of road traffic injury victims, May 2019–February 2020
Prehospital circumstances, hospital arrival time and means of transportation to the hospital
The median distance from the scene to the hospital was 40 km; IQR (10–80 km). Three hundred twelve (68.7%) of the accidents were within 60 km from the hospital, while the rest 142 (31.3%) were sustained within the distance range of 61–500 km. Concerning hospital arrival time, 184 (40.5%) and 176 (38.9%) reported to the hospital within <1 hour and 1–4 hours, respectively. The total prehospital time interval in this study was 364 min. The mean hospital arrival time was 144 and 537 min for accidents sustained in the town and the rural areas, respectively.
None of the victims received prehospital care at the scene of the injury by trained personnel. Of the total injured, 283 (62.3%) were directly transferred from the scene, while 171 (37.7%) were referred from primary hospitals. None of the victims transferred from the primary hospitals got surgical intervention at the primary hospitals, except wound dressing, immobilisation with local materials and tetanus prophylaxis.
About means of transportation to the hospital, the majority, 311 (68.5%), were transferred by commercial vehicles. Only 93 (20.5%) were transferred by ambulance, but none received prehospital care by a trained ambulance crew. Ambulance service was not for free, and the victims had to cover the cost of fuel ranging from 400 to 800 Ethiopian Birr (US$40–80) (table 3).
Prehospital circumstances, hospital arrival time and means of transportation
Injury patterns and characteristics
Extremities and the heads were the most commonly injured body regions, accounting for 194 (42.7%) and 113 (24.9%) of cases, respectively. Multiple body region injuries accounted for 85 (18.7%), thoraco-abdominal body region accounted for 32 (7%), and other body regions including the face, teeth and the like accounted for 30 (6.6%).
We computed the injury severity score using the RTS. Accordingly, the mean RTS was 6.5±2.0. The injury severity score ranges from 0.29 to 7.55. According to our data, 41 (9%) had RTS of <3 (non-survivable injury score) and 56 (12.3%) had RTS of <4.
Based on the GCS score, 64 (14.1%) had a severe head injury, 18 (4%) had moderate head injuries and 372 (81.9%) had no head injuries. Moreover, the rate of mortality was 52 (65%) for severe, 8 (10%) for moderate and 20 (25%) for mild head injuries. Out of the observed 454 road traffic accidents, a fracture was sustained by 289 (63.7%) of victims. The most frequently involved bone was the lower extremity comprising 42% of all fractures followed by skull fracture (14.8%) (figure 1).

Commonly sustained fractures among RTI (Road traffic injury) victims, hospital, Ethiopia.
Management of outcomes of road traffic injury victims
Out of the total 454 victims, 76 (16.8%) were evaluated and treated at an outpatient department, while 378 (83.2%) were admitted to the hospital for further evaluation and treatment. Of the total admitted, surgical intervention was required, for 162 (35.7%) cases. The most frequently performed major surgical procedure was craniotomy, 25 (15.4%) followed by intramedullary nailing 15 (9%). From the minor procedures, wound debridement was the most frequently performed procedure, 64 (39.5%) followed by immobilisation using plaster of paris 42 (25.9%). The mean hospital stay was 6.2±10 days, ranging from 1 day to 100 days. Reasons for discharge were on physician advice in 246 (65%) cases followed by death in 71 (18.7%), against medical advice in 38 (10%), and referred for better management to higher centres in 24 (6.3%) cases (table 4).
Management outcome of road traffic injury victims; 6 May; 2019 to February 2020
Survival analysis
Four hundred fifty-four participants were followed, for a total of 275 534 person-hours. There were 80 (17.60%) deaths and 15 (3.30%) losses to follow-up. We used the available case analysis technique as a missing data management option. From the total deaths, 13 (16.25%) deaths occurred within the first hour of injury, 11 (13.75%) between the first and 4 hours of injuries and 18 (22.50%) occurred between 4 and 24 hours of injury. Thirty-two (40%) of the deaths occurred after 24 hours up to the first 7 days, while the rest six deaths occurred after a week of injury (figure 2).
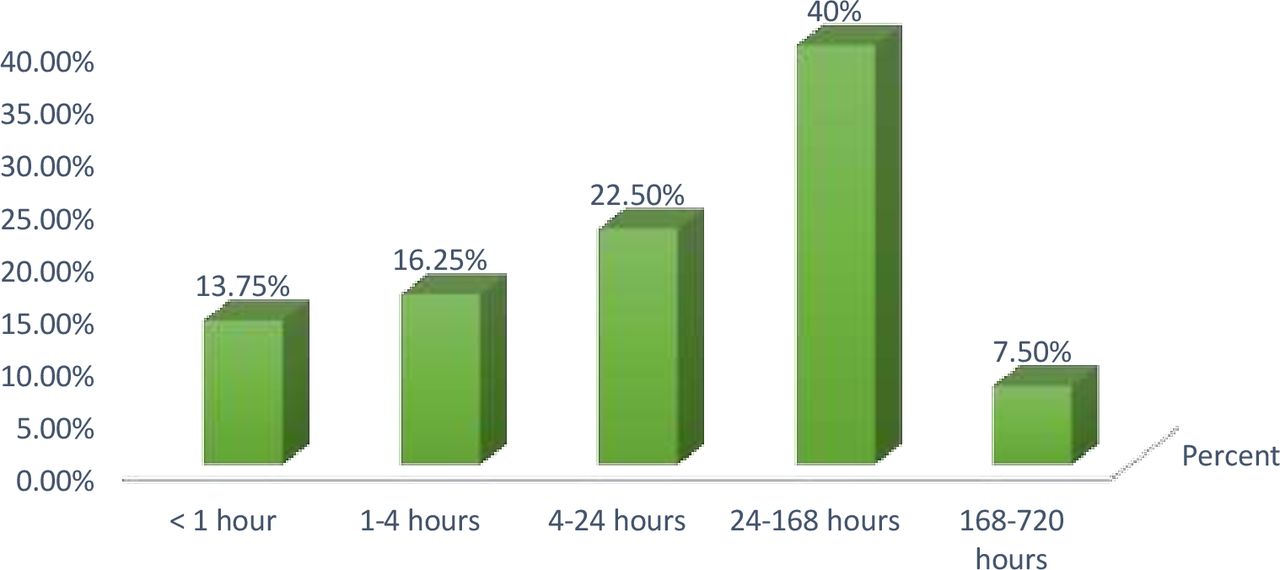
Timing distribution of mortality following road traffic injuries, 6 May; 2019 to 30 February 2020
The overall incidence rate of death was 2.90 deaths per 10, 000 person-hours of observation (95% CI 2.77 to 3.03). Since more than 75% of participants survived beyond the study time, we couldn’t compute the median survival. Instead, we computed the cumulative and mean survival times. The mean survival time was 607 hours or 25.30 days with a SD of 10 days. The cumulative proportion of surviving at the end of the first hour of injury was 97.30% (95% CI 95.39% to 8.49%). Similarly, it was 94.93% (95% CI 92.47% to 96.60%), 90.95% (95% CI 87.92% to 93.23%), 83.89% (95% CI 80.17% to 86.97%) and 82.34% (95% CI 78.51% to 85.56%) at the end of 4th, 24th, 168th and 720th hours of injury, respectively (table 5).
Overall life table of road traffic injury victims; May 2019–February 2020
Condition of victims on the 30th day of injury
Assessment on the 30th day of injury revealed that 30 (6.60%) were still in bed with unremarkable improvement, 263 (57.90%) had a better condition but not completely healed, 45 (9.90%) were healed with some limitation, 21 (4.60%) were completely healed, and back to work, 15 (3.30%) were lost to follow-up, while 80 (17.6%) died. Apart from those who died, 23 had functional losses (4 (0.88%) had lost teeth, 4 (0.88%) had an amputation of the limb, 3 (0.66%) had hearing loss, 3 (0.66%) had vision loss, 5 (1.10%) had impaired memory and 4 (0.88%) were paraplegic at 30th day of injury).
Immediate causes of deaths at a specific time interval
From the total of 17 deaths in the first hour of admission, 13 (76.5%) were due to non-survivable injury. The leading cause of death in the first 4 hours of admission to the hospital was haemorrhage (21.3%). Haemorrhage and secondary complications mainly aspiration pneumonia were the major causes of death between the first 4 and 24 hours. According to our data, late deaths have resulted from sepsis and multiple organ failure (figure 3). All deaths were confirmed by the clinician in charge of patient care.

Immediate causes of deaths following a road traffic injury at a specific time interval, May 2019–February 2020.
Predictors of mortality following a road traffic injury
The significant predictors of time to death for road traffic injury victims were being a driver (AHR=2.26; 95% CI 1.09 to 4.65, AR=14.8), accident location at the rural residence (AHR=1.98; 95% CI 1.02 to 3.82; AR=21%), time from injury to hospital arrival (AHR=0.41; 95% CI 0.16 to 0.63; AR=3%), SBP on admission of <90 mm Hg (AHR=3.66; 95% CI 2.14 to 6.26; AR=57%), GCS of <8 (AHR=7.39; 95% CI 3.0819 to 17.74464; AR=75.5%), GCS between 9 and 13 (AHR=8.1565 (3.36 to 19.82, AR=39%)), combined head injury with multiple body site (AHR=2.33 (1.13 to 4.80; AR=37%)) and interaction of long distance from hospital (AHR=2.98 (1.46 to 4.39; AR=5.5%)) (table 6).
Predictors of mortality following a road traffic injury, May 2019–February 2020
Impact of the study
We have calculated the attributable risk for the predictors of mortality. Our study showed that accidents at interurban locations had an increased hazard of death when compared with those accidents in urban areas. The high mortality in these locations was partly due to lack of timely care on-site and delays to hospital arrival, mainly due to poor transport access and long distance from the hospital. This finding implies that the establishment of emergency medical services and improved access to healthcare facilities could reduce such deaths by 21%.
Those victims who had an SBP of less than 90 mm Hg on admission had a risk of death by more than 3. That implies restoring the hemodynamics of victims as early as possible can reduce deaths following an injury by 57%. With this regard, the role of emergency medical response at the scene of the injuries and early transfer of victims to definitive care units will have a vital role in reducing reversible causes of mortality.
The study demonstrated that those victims who had head injuries had a higher risk of death when compared with non-head injury cases. Accordingly, victims with an isolated head injury and multiple injuries had more than twice the risk of death when compared with other body regions. Hence, the use of protective materials such as helmets could potentially reduce mortality following a road traffic injury by 26%–32%.
Discussion
The current study demonstrated that deaths following a trauma follow the classical trimodal pattern in low-resource countries, and prehospital care is rarely available for victims of road traffic injuries. Free ambulance transportation was in-available for trauma victims resulting in a delay in hospital arrival for accidents sustained on rural roads. Driver, accident location in rural areas, low SBP, low GCS on admission, injury site and interaction of providing prehospital care and long-distance were significantly associated with time to death among road traffic injury victims.
The current study demonstrated that deaths following a trauma follow the classical trimodal pattern in low-resource countries, and prehospital care is rarely available for victims of road traffic injuries. Free ambulance transportation was in-available for trauma victims resulting in a delay in hospital arrival for accidents sustained on rural roads. Being a driver, accident location in rural areas, low SBP, low GCS on admission, injury site and interaction of providing prehospital care and long-distance was found to be predictors of time to death among road traffic injury victims.
The classical trimodal distribution of trauma deaths was described by Trunkey, in 1983.38 Different previous studies had disproved this traditional distribution of mortalities due to a reduction in the number of early and late hospital deaths.39 Our study demonstrated that road traffic injury mortality still followed the traditional trimodal pattern. According to the current study, there were two peaks. One peak was in the first 24 hours and the second at the end of the first week of the injury. Nearly half of the deaths occurred in the hospital after a week of admission. A similar finding was reported by a study conducted in Iran showing two peak times.31 Poor operative services for severe head injury cases and lack of intensive care unit (ICU) for severely injured victims could explain the reason for late deaths in our hospital.40 The surgical setup in our case is not optimum to perform surgical intervention for severely injured head injury victims. Besides, there is no well-equipped surgical ICU service to support victims with ventilatory failure. On the other side, the in-availability of prehospital basic life support care could have resulted in clinical deterioration of victims that could result in late complications.10
In this study, none of the victims received prehospital care at the scene of injury. This is consistent with previous studies that showed prehospital emergency care is underserved or unavailable in most low and middle-income countries.41 42 The finding is also consistent with a study conducted in Addis Ababa, where none of the victims got prehospital care.17 The current study also indicated that full package ambulance service was unavailable for all the victims, and only 20% received transportation service without trained personnel accompanying the victims. Our finding is in line with a systematic review, indicating ambulance service was underserved in many low-income and middle-income countries43 and a study conducted in Pakistan that reported the majority of participants did not want to call ambulance for emergency cases because the ambulances did not function properly.44 On top of this, the available ambulance service was not for free. The victims or the family have to cover the cost of fuel and per Diem of drivers. A similar finding was reported in Cambodia.45
The current study also showed that many trauma victims who were referred from primary hospitals would have been treated, at those hospitals. This is in line with a study conducted at Southern India, which showed that trauma care was unnecessarily delayed and liable for unnecessary referrals due to poor resources for trauma case management31 and another study demonstrated that there are many deficiencies in emergency care services ranging from in-availability of drugs and lack of training to provide the required emergency care.46
According to our study, the overall incidence of road traffic injury deaths was 29 per 100 000 hours of observation. This finding is higher when compared with a study conducted at Tikur Anbessa Hospital, Addis Ababa, which was 10/100 000 hours of observation.17 The discrepancy could be explained by the fact that the Tikur Anbessa Hospital has a better trauma management setup including an ICU. Hence, the quality of care could explain the lesser death at the Tikur Anbessa Hospital.17 Another explanation could be because follow-up continued after discharge from the hospital in the current study, while the mentioned study didn’t follow victims after discharge that ignored deaths at home after discharge.
The study revealed that pedestrians are the most frequently affected road user categories when compared with passengers and drivers. This is in line with the federal police commission report47 and studies conducted in the capital city, Addis Ababa.48 Both studies showed pedestrians to be the road user categories most frequently affected by RTI. But severe and fatal injuries were more likely to occur among drivers and passengers in our study. Though the number of injured drivers was less in number when compared with both passengers and pedestrians, the proportion of fatality was higher among drivers. This could be explained by the fact that the majority of drivers in Ethiopia are reluctant in using seat belts and they are more likely to have crashes resulting in a fatality. From a previous study, it was found that 57.5% of drivers unfasten their seat belts while driving.49 This finding was consistent with a previous study that indicated fatal injuries were more likely among drivers and passengers.50 But another study reported a contradictory finding, showing pedestrians are more likely to die from a vehicle accident.51
Our study demonstrated that accidents sustained in rural areas were more likely to result in a fatal outcome than in urban locations. Our finding is consistent with a study conducted by Zwerling et al. that showed injury severity and fatality were more than three times higher in the rural area than urban areas.52 Lack of appropriate healthcare facilities and limitation of transportation access could explain the finding. That will, in turn, result in bad outcomes.53 Risky driving behaviour such as over speeding is more common in rural areas due to poor traffic control. That could explain the high mortality in rural areas.
Previous evidence showed that accident intensity increases when a crash is caused by a speedy vehicle.54
Low SBP on admission was significantly associated with time to death among road traffic injury victims. This finding is in line with previous studies that showed victims with low blood pressure on admission were more likely to experience death than their counterparts.16 55 56 Exsanguination from severe injury explains the drop in blood pressure.57 Low SBP could increase mortality via poor organ perfusion and consequent organ failure.58 Nosocomial infections and sepsis are likely in haemorrhagic shock resulting in acidosis and poor perfusion.59 60 These are the possible explanations for low SBP and increased mortality.
The current study revealed that hospital arrival time is associated with 30 days of mortality following a road traffic injury. Accordingly, victims who arrived at the hospital between 1 and 4 hours were more likely to die than those who arrived within 1 hour of injury and beyond 4 hours of injury. The finding is contrary to the concept of the ‘Golden hour’ of trauma that depicts the outcome of trauma, which is better when victims arrive within 1 hour of injury.61 62 That could be because victims who are seriously injured and have non-survivable injuries were more likely to be directly transferred to the hospital immediately after injury, while less severe injury cases took their time.
The study showed an interaction between long distances from the hospital and prehospital first aid to be significantly associated with 30 days mortality following a road traffic injury. The possible explanation for this finding could be due to delays in definitive care. Though essential trauma care is vital to treat time-sensitive issues, delayed expert-requiring procedures could result in poor outcomes.63 This is particularly the case in low-resource countries like Ethiopia where the majority of primary hospitals are not in a position to provide essential trauma care.64
Limitation of the study
As our participants were only those victims who visited the hospital during the data collection period, we excluded deaths at the scene of the injury and minor cases who did not come to the hospital. Such exclusion might underestimate the actual injuries and mortalities from a road traffic injury. Besides, the exclusion of minor cases might introduce selection bias. Besides, the exclusion of minor cases might introduce selection bias. The time interval between injury and hospital arrival was determined based on self-report or family report. We expect a recall bias in such a stress full situation. The direct cause of death was assessed using verbal autopsy for those deaths that occurred at home after discharge. This may not be precise without autopsy and physician judgement.
Because many of the drivers escape or were arrested after the accidents, we could not assess driver-related risk factors such as speed, presence of drunk driving, age and experience of driving which could be a source of variability for the outcome of the injury.
Conclusions
This study demonstrated that the classical trimodal pattern of mortality is still occurring in low-resource settings. The study showed that there is a gap in both prehospital trauma care and primary trauma care at district hospitals in the study area. Being a driver, accidents at the interurban roads, low SBP, low GCS on admission and presence of head injuries were predictors of time to death following road traffic injuries.
The regional and zonal health sectors need to revise the prehospital trauma care service implementation including ambulance access and package. The hospital needs to improve trauma care services, especially surgical and supportive interventions such as mechanical ventilatory support for severely injured victims. Future studies should be conducted to assess the capability of primary hospitals in the area in providing essential trauma care, and barriers to establishing emergency medical service in the country at large, and the study area in particular.
Generalisability of the study: we tried to use a representative sample based on appropriate power calculation and use a pretested and piloted tool to collect data; hence, we can generalise the result from this study for all road traffic injury cases in the Amhara region.
Data availability statement
Data are available upon reasonable request. Extra data can be accessed via the Dryad data repository at http://datadryad.org/ with the doi:10.5061/dryad.s4mw6m979.
Ethics statements
Patient consent for publication
Ethics approval
This study involves human participants and was approved by ethical clearance was obtained from the University of Gondar Ethical review board (R.N. O/V/P/RCS/051049/2019), and a permission letter was obtained from Gondar University Comprehensive Specialized Hospital. Informed written consent was obtained from participants, caregivers, or proxy as appropriate. The purpose of the study was explained to every victim or an appropriate proxy. On arrival at the emergency department, only hospital arrival time was registered and other information was collected after all the necessary medical care was secured. During our observation, any abnormal finding or complaint such as pain was communicated to the appropriate medical care team for intervention. For those victims who were discharged against medical advice, we continued our follow-up by phone and some of them changed their minds and returned and continued their medical follow-up. Participants gave informed consent to participate in the study before taking part.
Acknowledgments
We would like to forward our gratitude to the University of Gondar for giving us the chance to conduct this study and providing financial assistance. We thank also the supervisors, data collectors, and our study participants. We are grateful to the University of Gondar's Specialized Comprehensive Hospital for letting us conduct the study.
References
Supplementary materials
Supplementary Data
This web only file has been produced by the BMJ Publishing Group from an electronic file supplied by the author(s) and has not been edited for content.
Footnotes
Contributors ZAD designed the study, analysed the data and drafted the manuscript. MOY, TA, GAB and KAG were involved in the design of the study, analysis and critically evaluated the manuscript for intellectual content. All authors read and approved the final manuscript. ZA is a guarantor for overall content.
Funding The authors have not declared a specific grant for this research from any funding agency in the public, commercial or not-for-profit sectors.
Competing interests None declared.
Provenance and peer review Not commissioned; externally peer reviewed.
Supplemental material This content has been supplied by the author(s). It has not been vetted by BMJ Publishing Group Limited (BMJ) and may not have been peer-reviewed. Any opinions or recommendations discussed are solely those of the author(s) and are not endorsed by BMJ. BMJ disclaims all liability and responsibility arising from any reliance placed on the content. Where the content includes any translated material, BMJ does not warrant the accuracy and reliability of the translations (including but not limited to local regulations, clinical guidelines, terminology, drug names and drug dosages), and is not responsible for any error and/or omissions arising from translation and adaptation or otherwise.