Article Text

Abstract
Background Investments in traffic calming infrastructure and other street design features can enhance pedestrian safety as well as contribute to the ‘walkability’ of neighbourhoods. Pedestrian–motor vehicle collisions (PMVCs) in urban areas, however, remain common and occur more frequently in lower income neighbourhoods. While risk and protective features of roadways related to PMVC have been identified, little research exists examining the distribution of roadway environment features. This study examined the relationship between roadway environment features related to child pedestrian safety and census tract income status in Toronto.
Methods Spatial cluster detection based on 2006 census tract data identified low-income and high-income census tract clusters in Toronto. Police-reported PMVC data involving children between the ages of 5 and 14 years were mapped using geographical information system. Also mapped were roadway environment features (densities of speed humps, crossing guards, local roads, one-way streets and missing sidewalks). Multivariate logistic regression was used to examine the relationship between roadway environment features (independent variables) and cluster income status (dependent variable), controlling for child census tract population.
Results There were significantly fewer speed humps and local roads in low-income versus high-income clusters. Child PMVC rates were 5.4 times higher in low-income versus high-income clusters.
Conclusion Socioeconomic inequities in the distribution of roadway environment features related to child pedestrian safety have policy and process implications related to the safety of child pedestrians in urban neighbourhoods.
- children
- pedestrians
- socioeconomic status
- built environment
- urban
Statistics from Altmetric.com
Introduction
In the urban planning context, walking as a mode of transportation is valued because of the well-established environmental, health and social benefits. From the safety perspective, however, pedestrian–motor vehicle collisions (PMVCs) are an important cause of death and disability. The PMVC fatality rate among children 0–14 years in Canada is around 0.3/100 000/year, and PMVCs account for almost one-third of all road user fatalities among children.1
Pedestrian risk is increased in socially disadvantaged areas. Among children 0–14 years, the risk of death because of PMVC increases by 13% per unit change in census income quintile from highest to lowest in Canadian urban areas.2 This inverse association between socioeconomic status and PMVC has been noted in urban settings in western countries since the 1950s.3 Disparities in PMVC rates between low-income and high-income areas may be explained by differences in traffic speed, vehicle and pedestrian volumes, unsupervised walking to school and the roadway built environment.
Major roadways (a proxy for vehicle speed) and higher traffic volumes have been shown to be more common around schools in low-income areas.4 Indicators of lower socioeconomic status, such as less car ownership and lower parental education, have been associated with more road crossings and less supervision of children while walking to school.5–7 Some authors have also identified a ‘spatial displacement of risk’, where the combination of street hierarchy and socioeconomic factors leads to an increased pedestrian risk in lower-income neighbourhoods as non-local drivers move through those neighbourhoods.8
With regard to the roadway built environment, there is good evidence that traffic calming measures—generally found on lower speed residential roads—reduce the frequency and severity of pedestrian injuries by 50%–75%.9 10 Roberts et al suggested that 18 child pedestrian deaths per year could be prevented in New Zealand if funds were redirected to traffic calming rather than to education.11 Rothman et al found a 43% reduction in child PMVC following the installation of speed humps in the City of Toronto,12 and Tester et al found a 2.5-fold lower odds of a child PMVC for children living within a block of a speed hump.13
In addition to roadway environment modifications such as installation of speed humps, other child pedestrian safety approaches include speed limits, enforcement of traffic laws, school crossing guards and ‘Safe Routes to School’ programmes. In general, the ‘walkability’ of neighbourhoods is related to neighbourhood income level.14 Few studies, however, have specifically addressed differences in the roadway built environment related to child safety by neighbourhood socioeconomic indicators.14 15 Zhu and Lee found that schools with higher neighbourhood poverty rates had better neighbourhood-level walkability, more students living close to the school and higher percentages of sidewalk completeness. However, street-level walkability in these neighbourhoods was lower because of fewer physical amenities and lower perceived safety.16 Social equity concerns—unlike environmental and economic concerns—have not yet been widely adopted as a considerations in pedestrian planning, although it is likely that this issue varies across urban areas.17 The primary objective of this study was to examine the relationship between income (at the level of census tract) and roadway environment features related to child pedestrian safety in the City of Toronto, Canada. A secondary objective was to examine the relationship between income and risk of child PMVC.
Methods
Socioeconomic status at the census tract level was measured using 2006 Canadian Census data, based on the percentage of households below the after-tax low income cut-off.18 PMVC data involving children (5–14 years) over the 10-year period 2001–2010 were obtained from Toronto Police Services and mapped by census tract. PMVC rates were calculated using the roadway length as the denominator. Highways were excluded. Police data included information on the age of the pedestrian, and the date, time and location of collision (x, y coordinates). Population data on children (5–14 years) in Toronto were obtained from the 2006 Canadian census.
Data on roadway environment features related to child pedestrian safety were obtained from the City of Toronto and Toronto Police Services. Data were collected on speed hump density as of 2012 (#/100 km road), local road density (km/10 km road), school crossing guard density as of 2014 (#/10 km road), one-way street density (km/10 km road) and missing sidewalk density (km/10 km road), and mapped onto census tracts. Local roads are defined by the City of Toronto as having lower posted speed limits (30–50 km/h) and daily motor vehicle traffic volumes of less than 2500 vehicles per day.19 Of note, traffic calming measures in general, which include traffic circles, chicanes speed humps and so on, are effective in reducing traffic-related injuries.10 20–22 However, because speed humps represented 99.5% of all street design calming measures in Toronto (as of 2011), only speed hump density was included in the analysis.23
Spatial cluster analysis
Spatial analyses were used to identify clusters of low-income and high-income census tracts. A priori, a decision was made to examine the extremes of the socioeconomic spectrum, given the disparity in PMVC frequency between low-income and high-income areas. Spatial distribution of census tract socioeconomic status was determined using the local Moran’s I tool (in ArcGIS V.10.3) to identify clusters of census tracts with significantly low (cold spot) or high (hot spot) low-income values.24 25 Local Moran’s I detects clusters by comparing the actual spatial distribution under a null hypothesis of complete spatial randomness. The analyses were conducted by setting the parameters to consider the inverse (Euclidian) distance without any distance threshold limit, meaning nearby neighbouring features had a larger influence on cluster identification than features that were further away.”26 A p value of <0.05 was used to identify clusters of low-income and high-income census tracts. PMVC and roadway environment features were mapped onto the low-income and high-income clusters.
Statistical analysis
Univariate comparison of low-income and high-income census tract clusters by roadway environment features compared mean values of features using two-tailed t-tests. Multivariate logistic regression used income cluster (low vs high) as the dependent variable. Roadway environment features that were significant in the univariate analyses were entered into the multivariate logistic regression model as independent variables by order of least significance, and removed if not significant at p<0.05, after controlling for child population. Multicollinearity was assessed by determining if the tolerance was <0.20 if the variance inflation factor was >10. ORs and 95% CIs were calculated. A secondary analysis examined the distribution of PMVC in low-income versus high-income clusters and used t-tests to examine differences in mean age, and Pearson’s χ2 test to examine differences in proportions of police-reported injury severity (none, minimal, minor, major).
Results
The study area contained 524 census tracts; 44 of these census tracts (8%) were low-income clusters and 58 census tracts (11%) were high-income clusters. Over the 10 years of study, there were a total of 2185 PMVCs involving children 5–14 years. Of these, 344 PMVCs occurred in the census tracts identified by the spatial analysis with 212 PMVCs in low-income clusters and 132 PMVCs in high-income clusters.
The proportion of low-income families was almost seven times higher in low-income versus high-income clusters (table 1). The average number of children (5–14 years) in low-income cluster census tracts was 714 compared with 438 children in high-income cluster census tracts. The child PMVC rate was 5.4 times higher in low-income compared with high-income clusters (1.13/1000 km road/10 years vs 0.21/1000 km road/10 years, respectively).
Descriptive statistics comparing low-income and high-income clusters in the city of Toronto
With respect to roadway environment features, there was no significant difference in one-way street density between low-income and high-income clusters. All other roadway features, however, were significantly different based on the univariate analyses (table 1). For example, speed hump density was almost four times lower and local road density was 1.4 times lower in census tracts in low-income clusters compared with those in high-income clusters. In high-income cluster census tracts, however, road length was two times higher and missing sidewalk density was 4.1 times higher compared with low-income cluster census tracts. Last, school crossing guard density was twice as high in census tracts in low-income clusters compared with those in high-income clusters. Of note, 90% of crossing guards in census tracts in low-income clusters and 95% of crossing guards in census tracts in high-income clusters were located at intersections with at least one arterial road. In total, 37% of the road network was made up of arterial roads in census tracts in low-income clusters compared with only 27% in high-income clusters.
Significant correlates in the final multivariate logistic regression model, after adjusting for child population, are shown in table 2. There was no evidence of multicollinearity. Multivariate analysis showed that speed humps and local roads were significantly less likely in low-income compared with high-income clusters (OR 0.09, 95% CI 0.01 to 0.77 and OR 0.61, 95% CI 0.46 to 0.82, respectively).
Multivariate analysis (low-income vs high-income clusters) by roadway environment features
For illustrative purposes only, the distribution of speed humps in a randomly selected area of the city is shown in figure 1 to highlight the difference between census tracts in low-income and high-income clusters in Toronto.

Spatial distribution of road segments with speed humps in the city of Toronto, 2016. CT, census tract.
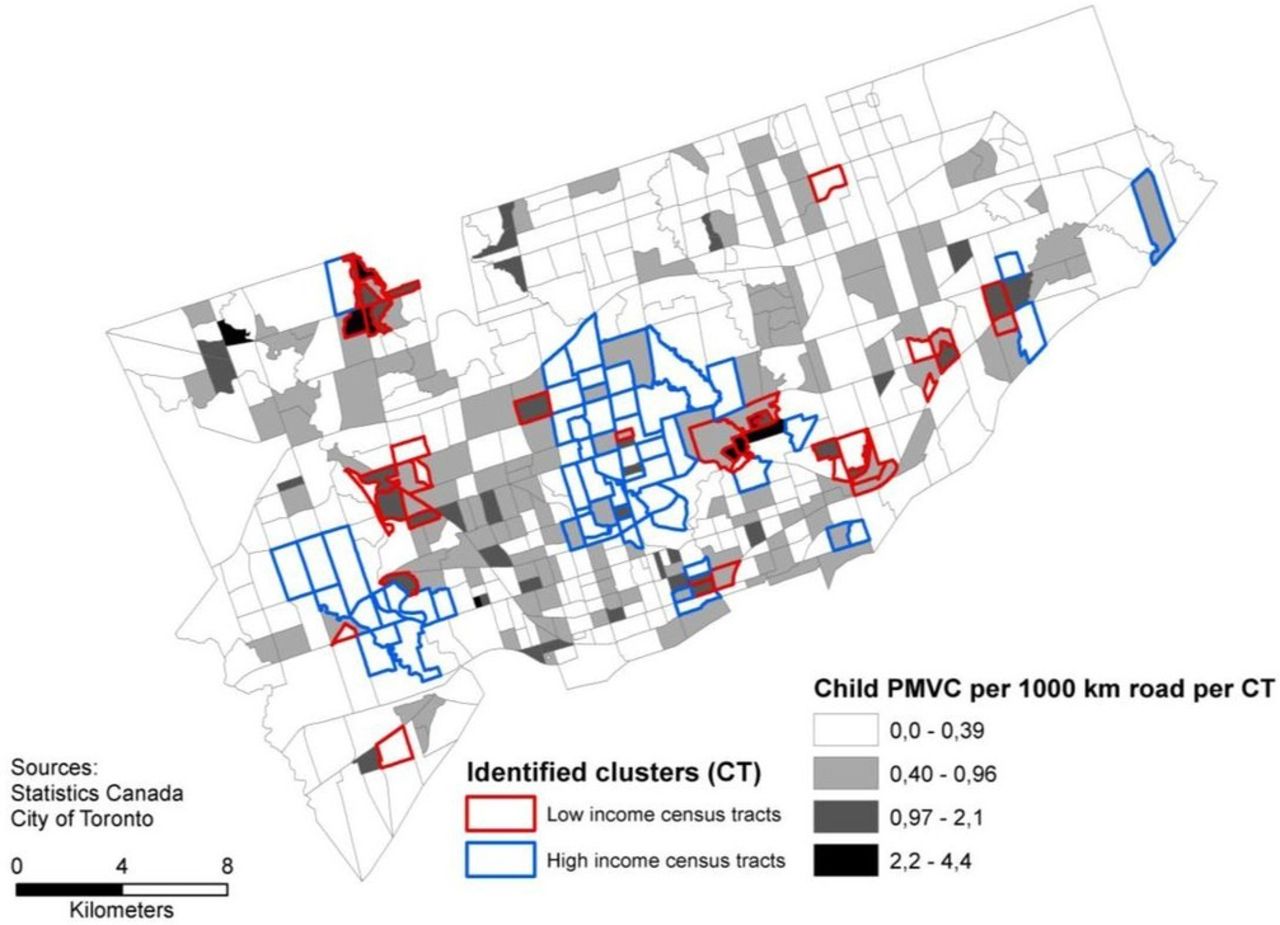
Child PMVC rates were more than five times higher in low-income versus high-income clusters. Figure 2 shows the spatial distribution of child PMVC rates by census tract cluster. Many high-income census tracts did not have any collisions (n=17/58, 29%). The average age of children injured in low-income clusters was marginally higher than those in high-income clusters (10.82 vs 10.17, p=0.04). There were no significant differences in police-reported injury severity by cluster. In total, 15 children had no injury (4%), 135 (39%) had a minimal injury, 171 (50%) had a minor injury requiring a visit to the emergency department and 23 (7%) had major injuries requiring hospital admission. There were no PMVC fatalities over the 10-year time period.

Spatial distribution of child pedestrian–motor vehicle collision (PMVC) per 1000 km road by census tract (CT) in the city of Toronto, 2001–2010.
Discussion
This study found differences in the distribution of road environment features related to child pedestrian safety between low-income and high-income census tract clusters in the City of Toronto, Canada. There were lower densities of speed humps and local roads in low-income versus high-income clusters. Of note, Rodgers et al found that socially deprived areas in England and Wales had substantially more traffic calming than wealthier areas; however, traffic calming features were scarce in both settings.27
Our study also showed that child PMVC rates were more than five times higher in low-income clusters compared with high-income clusters. Other studies of PMVC have incorporated zonal income in their analyses and have consistently found an inverse relationship between income level and PMVC rate. Studies have used different zonal units including residence ZIP, traffic analysis zones, block groups and census tracts. The finding of the inverse relationship between income level and PMVC should therefore be considered robust, given the consistency in the relationship regardless of the zone and scale used across studies.28 29 The use of spatial methods to identify clusters of census tracts by characteristics such as income, roadway environment features and PMVC rates may be a useful approach in urban planning as implementation of road safety interventions, such as traffic calming, could then be made on an area-wide approach, rather than a narrow focus on a single census tract.
In Toronto, it is the community that generally initiates the request for traffic calming features, such as the installation of speed humps. It is likely that communities differ on knowledge of the political process and levels of political engagement, given that higher levels of political engagement have been shown among those with higher socioeconomic status.30 The inequity in the spatial distribution of speed humps in the City of Toronto by income found in this study may therefore be a function of process. It could be argued that a request-based process to implement a proven road safety feature may not be the most equitable method of identifying and meeting community need.
Differences in the distribution of roadway environment features by census tract income in Toronto may, in part, explain the differences in child PMVC rates between low-income and high-income clusters. In addition to fewer speed humps, low-income clusters also had fewer local roads and more arterial roads compared with high-income clusters. Local roads have lower posted speed limits and lower vehicle volumes compared with collector and arterial roads.19 Toronto data show average vehicle speeds of 35 km/h on local roadways compared with average vehicle speeds of 49 km/h on major arterial roads. Vehicle volumes were also more than 13 times higher on the major arterial roads (6156 vehicles/day) compared with local roads (468 vehicles/day) in Toronto.31 Lower vehicle speeds are associated with fewer and less severe PMVCs.32 Based on these data, interventions directed at speed reduction in lower-income areas may be necessary to reduce child PMVC risk.
A limitation of the study is the use of 2006 rather than 2011 Canadian census data to estimate census tract income. The 2006 data were used because the 2011 Canadian census was voluntary and had subsequent data quality issues because of the low response rate.33 It was assumed for these analyses that census tract income status estimates were accurate, given that census divisions within the City of Toronto are well established. Another important limitation of this study (and of most studies of child PMVC) is the lack of comprehensive data on vehicle speed, traffic volume and pedestrian volume reflecting ‘exposure’ to risk. The City of Toronto does not routinely collect traffic speed and volume data on local roadways (where the majority of children walk) or on pedestrian volumes. In this analysis, we used roadway type (local vs arterial) as a proxy for vehicle speed and traffic volume, and child population within the census tract as a proxy for pedestrian volume. Measures that have been used to estimate ‘pedestrian exposure’ include population within a defined area, pedestrian counts (where available), travel survey data and roadway length.29 34–38 This study used length of roadway as the denominator for the calculation of child PMVC rates. Other studies have also used roadway length as the denominator for collision rates.36–38 LaScala et al emphasise that the length of the roadway system is a natural metric for PMVC, given that PMVCs occur exclusively on or near streets and that traffic and pedestrian flow takes place on these streets.38
A case–control study in New Zealand found that the inverse association between pedestrian injury and indices of material disadvantage persisted, although slightly attenuated, after controlling for traffic volume and speed.39 In addition, higher school disadvantage in Toronto (based on a composite index of income, parental education and single-parent status) was shown to be associated with higher child PMVC rates, even after controlling for child pedestrian volumes (children observed walking to school) and roadway environment features around schools.34
Last, a key limitation of our study is the cross-sectional design, which limits inferences regarding causality. Simply put, the findings of our study are the associations between census tract income level, roadway environment features and risk of child PMVC in Toronto. In this context, traffic calming features and the presence of school crossing guards may be indicators of current or previously hazardous locations, and a cross-sectional analysis using historical collision data cannot tease out direct causal relationships. Of note, other research in Toronto using pre–post quasi-experimental designs has found protective effects of traffic calming on PMVC and no clear effect of school crossing guards.12 40
Conclusion
While socioeconomic differences in the rates of child PMVC have previously been demonstrated, there has been little research on social inequities in the distribution of roadway environment features. This cross-sectional study showed significant differences in the spatial distribution of roadway environment features related to child pedestrian safety between low-income and high-income census tract clusters in Toronto. The process of implementation of roadway environment features highlights procedural equity in transport planning, in other words, the issues of who has access to participate and have their voices heard in public decisions on safe infrastructure.41 Objective methods to determine the need for road safety features, such as identifying matrices of intersections by pedestrian collisions, higher speed roadways and dangerous driving citations, are warranted. The results of this study have implications for policies and procedures related to the design of safe neighbourhoods in Toronto and beyond. Policies and procedures must take into account the potential for socioeconomic inequities to ensure safe pedestrian environments for all.
What is already known on the subject
Pedestrian–motor vehicle collisions are common.
Pedestrian risk is increased in socially disadvantaged areas.
Few studies have specifically addressed socioeconomic inequities related to the roadway built environment.
What this study adds
Differences in the distribution of roadway environment features related to child pedestrian safety were found between low-income and high-income areas in Toronto, Canada.
Differences in the distribution of roadway environment features by income status may, in part, explain the socioeconomic inequity in child pedestrian–motor vehicle collision rates.
Acknowledgments
The authors would like to thank the various departments at the City of Toronto for sharing their data.
References
Footnotes
Contributors LR was responsible for the conceptual framework and study design, data acquisition, data analysis and interpretation, and writing and editing of the manuscript. M-SC contributed to the conceptual framework and study design, data analysis and interpretation, and writing and editing of the manuscript. KM contributed to the conceptual framework and study design, interpretation, and writing and editing of the manuscript. AWH contributed to the conceptual framework and study design, interpretation of data and editing of the manuscript. AKM contributed to the conceptual framework and study design, interpretation of data and editing of the manuscript. CM contributed to the conceptual framework and study design, data analysis and interpretation, and writing and editing of the manuscript. All of the authors approved the final version of the manuscript for publication.
Funding This work was funded by a CIHR Team Grant: Environments and Health: Intersectoral Prevention Research, IP2-150706.
Competing interests None declared.
Patient consent for publication Not required.
Provenance and peer review Not commissioned; externally peer reviewed.