Article Text

Abstract
Objectives The purpose of this study was to investigate the contribution of neighbourhood disorder around alcohol outlets to pedestrian injury risk.
Methods A spatial analysis was conducted on census block groups in Baltimore City. Data included pedestrian injury EMS records from 1 January 2014 to 15 April 2015 (n=858), off-premise alcohol outlet locations for 2014 (n=693) and neighbourhood disorder indicators and demographics. Negative binomial regression models were used to determine the relationship between alcohol outlet count and pedestrian injuries at the block group level, controlling for other neighbourhood factors. Attributable risk was calculated by comparing the total population count per census block group to the injured pedestrian count.
Results Each one-unit increase in the number of alcohol outlets was associated with a 14.2% (95% CI 1.099 to 1.192, P<0.001) increase in the RR of neighbourhood pedestrian injury, adjusting for traffic volume, pedestrian volume, population density, per cent of vacant lots and median household income. The attributable risk was 10.4% (95% CI 7.7 to 12.7) or 88 extra injuries. Vacant lots was the only significant neighbourhood disorder indicator in the final adjusted model (RR=1.016, 95% CI 1.007 to 1.026, P=0.003). Vacant lots have not been previously investigated as possible risk factors for pedestrian injury.
Conclusions This study identifies modifiable risk factors for pedestrian injury previously unexplored in the literature and may provide evidence for alcohol control strategies (eg, liquor store licencing, zoning and enforcement).
- alcohol
- pedestrian
- geographical / spatial analysis
- urban
Statistics from Altmetric.com
Introduction
The majority of pedestrian injuries occur in urban areas,1 yet the distribution of pedestrian injuries and injury risk factors across neighbourhoods is not uniform.2–4 Injury events disproportionately cluster in census tracts with higher rates of unemployment, lower educational levels, lower incomes and more non-white residents.4 5 While the unequal distribution of risk factors such as traffic volume4 and traffic safety infrastructure6 may account for some of this discrepancy, they may not completely explain the antecedents of the high burden of pedestrian injuries in resource-deprived neighbourhoods.
The distribution of alcohol outlets across communities may help explain the inequitable distribution of pedestrian injuries across urban areas.4 Resource-deprived census tracts and predominantly black census tracts have significantly more liquor stores per capita than more affluent communities and predominantly white communities.7 8 Alcohol outlets, particularly off-premise packaged goods stores, are often surrounded by signs of social and physical disorder.9 10 Physical disorder is the deterioration of the urban landscape—including graffiti, litter and vacant lots—while social disorder indicates behaviour that may be considered threatening, such as verbal harassment on the street or public intoxication.11 The accumulation of these social and physical conditions around alcohol outlets are often viewed as troublesome and potentially threatening by residents and visitors, who may drive or cross the street unsafely to avoid this undesirable activity.12–14 No studies have investigated the impact of neighbourhood disorder around alcohol outlets on pedestrian injury risk.
We conceptualise the mechanisms by which alcohol outlets and neighbourhood physical and social disorder impact pedestrian injury risk using the concept of reciprocal determinism from Social Cognitive Theory—the dynamic interaction of the person, the behaviour and the environment in which the behaviour is performed.15 In this conceptual model, we propose that structural/environmental factors, interpersonal relationships and individual cognitive and biological events may manifest in pedestrian and driver behaviour (figure 1). The scope of this study focuses on the structural-level factors that contribute to pedestrian injuries in areas around alcohol outlets.

Conceptual model illustrating the mechanisms by which alcohol outlets and neighbourhood physical and social disorder impact pedestrian injury risk.
The purpose of this study was to investigate the impact of alcohol outlets on the neighbourhood RR of pedestrian injury. We hypothesised that increased numbers of alcohol outlets in a neighbourhood would correspond with increased RR for pedestrian injuries. We also aimed to investigate indicators of neighbourhood physical and social disorder as possible contributors to neighbourhood pedestrian injury risk. We hypothesised that neighbourhoods with greater physical and social disorder would also experience greater RR for pedestrian injury.
Methods
This research was approved by the Institutional Review Board at the Johns Hopkins Bloomberg School of Public Health.
Data sources
Pedestrian injury data were gathered through emergency medical services (EMS) records collected from 1 January 2014 to 15 April 2015 (n=848). The Baltimore City Fire Department operates the city’s EMS system; as Baltimore City is served by a single EMS system, these data are representative of all EMS calls for pedestrian injuries. Paramedics on the scene confirmed that the injury was caused by an MVC. Drug and alcohol use indicators were recorded for only 23% (n=194) of injured pedestrians by EMS staff; positive indicators were present in 6.3% (n=53). Consequently, we were unable to stratify by intoxication status. However, a study of MVC victims admitted to a level 1 trauma centre in Baltimore City found that approximately 27% of pedestrians tested positive for alcohol use.16 We, therefore, assume that a majority of pedestrians included in this study were sober at the time of the crash.
Locations of alcohol outlets in 2014 were obtained through the Board of Liquor License Commissioners for Baltimore City. This study focused on the four licensure classes concerned with sale of package goods for off-premise consumption (n=693). On-premise and off-premise outlets differentially impact injury risk. Off-premise outlets are more strongly associated with drinking problems, crime and violence compared with outlets licenced for on-premise consumption only.17 18 Restaurants, hotels/motels, entertainment venues and non-profit private clubs were not included in this study as these establishments only allow on-premise alcohol consumption.
Neighbourhood data: assessments of the neighbourhood environment were obtained using The Neighborhood Inventory for Environmental Typology (NIfETy).19 NIfETy is a standardised inventory designed to assess characteristics of the neighbourhood environment related to violence, alcohol and other drug exposures.20 For this analysis, we used data collected from July to November 2012, the last year city-wide data collection took place; data collection took place on a random sample of 802 blocks located throughout the city. Full details of the data collection methodology and block selection can be found in Furr-Holden et al.19
Vacant lots: addresses for all vacant lots in 2015 were compiled by the Baltimore City Housing Authority (BCHA); BCHA updates its list of vacant lots twice a month for the purposes of monitoring code violations and streamlining remediation projects.21 Digital parcel maps of all lots were available through the Maryland State Department of Planning.22 Vacant lots are an important indicator of neighbourhood disorder and have significant effects on community health and safety.23 A qualitative study of vacant lots’ impact on community well-being found that vacant lots overshadowed positive aspects of the community, eroding community cohesion, attracting crime and increasing residents’ fear and anxiety.14 To calculate per cent of vacant lots per census block group, we aggregated the count of vacant lots and the count of all lots to each census block group. We then divided the number of vacant lots by the total number of lots to calculate the per cent of vacant lots in each block group.
Pedestrian safety infrastructure: no comprehensive database cataloguing Baltimore City’s traffic safety infrastructure exists, in part because of the logistical and methodological challenges of maintaining such a database.24 The Inventory for Pedestrian Safety Infrastructure (IPSI) is a standardised instrument designed to assess the presence of street-level infrastructure for preventing pedestrian injury.25 The IPSI includes three domains: roadway features, midblock features, and intersection features. The majority of items had good or excellent levels of inter-rater reliability (intraclass correlation coefficient (ICC)≥0.8), with intersection features showing the highest agreement across raters.25 The IPSI also has been validated for use with Google Street View (GSV) in place of in-person data collection; GSV images are time-stamped with the month and year an image was processed, and many locations allow the user to travel back in time to every previous image taken at a location. Full details of the IPSI tool creation and validation and data collection methodology can be found in Nesoff et al.25
Data collection took place on the same sample of 802 blocks selected by the NIfETy sampling methodology. IPSI data were collected from December to February 2017, but IPSI measures were collected for images taken on or before April 2015 to coincide with the dates of EMS data collection.
Traffic volume: traffic volume is an important predictor of pedestrian injury risk.4 26 Average Daily Traffic Volume for 2013—the most recent year of data availability—was collected by the Maryland State Highway Administration’s Traffic Monitoring System.27 Traffic counts are recorded at a specific point on the roadway referred to as a ‘count station’ but extrapolated to represent the entire segment or section of roadway by a linear referencing system integration process. These data are then mapped for use as both a point file and a segment file. There are 752 count stations in Baltimore City; 168 (22.3%) count stations located on highways were excluded to create a measure of residential traffic volume. For this study, we used Annual Average Daily Traffic (AADT) so as to include a measure of weekend traffic flow. AADT represents a typical traffic volume count any time or day of the year at a count station. We used the join function in ArcGIS V.10.4 to join segment data to each census block group to calculate an average of AADT values for each census block group. Traffic volume was measured in units of 1000 vehicles to better facilitate interpretation of coefficients.
Walk Scores for Baltimore neighbourhoods were obtained from Live Baltimore.28 Walk Score is a commercially available walkability index calculated by mapping out the distance to amenities in nine different categories, including grocery stores, restaurants, shopping, coffee shops, banks, parks, schools, book stores/libraries and entertainment venues.29 Walk Score serves as a proxy measure for pedestrian volume as higher Walk Scores are correlated with higher volumes of pedestrians.30 A high walkability score (on a scale of 0–100) signifies that daily errands can be easily performed on foot, while lower scores indicate a neighbourhood’s automobile dependence.
Demographic variables for each census block group in Baltimore City (n=653), including population totals and median household income, were taken from 2014 Census estimates.31 Increased population density and median household income have been associated with reduced pedestrian injury risk in previous research.4 32 Population density was calculated by taking each block group’s total population and dividing by the block group’s area in square miles. Population density was measured in units of 1000 residents, and median household income was measured in units of $1000 to better facilitate interpretation of coefficients.
Measures
Physical disorder and social activity scales
Eighteen binary items from the NIfETy, used in previous analyses, were used to classify the neighbourhood physical and social environment.33–36 Physical disorder included broken windows; abandoned buildings; vacant houses; vacant lots; unmaintained properties; broken bottles; graffiti; evidence of vandalism; presence of intoxicated people, signs of using alcohol/drugs or signs of drug selling; syringes or vials; baggies, blunt guts/wrappers or pot roaches; and alcohol bottles. Social activity included youth playing, youth sitting in a group, youth in transit, positive adult interactions, adults sitting on steps and adults watching youth. Items were summed to create two scales. Physical disorder score ranged from 0 to 12, with higher scores indicating higher levels of physical disorder (Cronbach’s alpha=0.79). Social activity score ranged from 0 to 6, with higher scores indicating higher levels of positive social activity (Cronbach’s alpha=0.66).
Intersection and roadway safety infrastructure scales
Two four-item scales were developed from IPSI to measure safety infrastructure at intersections and roadways using Exploratory Factor Analysis (see Nesoff et al for scale development details).25 Intersection items include: number of marked crosswalks at an intersection at the site of a walk signal, stop light or stop sign; number of streets with traffic lights; number of pedestrian crossing signals; and number of streets with stop line set back from crosswalk.25 Roadway items include: number of street lanes, presence of driveways, on-street parking (parallel or diagonal/back-in parking); and presence of bus stops.25 Items were summed to create two infrastructure scales. Intersection scores ranged from 0 to 21, with higher scores indicating more infrastructure at intersections (Cronbach’s alpha=0.86).25 Roadway scores ranged from 0 to 8, with higher scores indicating more infrastructure on roadways (Cronbach’s alpha=0.60).25
Spatial lag of traffic volume
Rather than use the average AADT in a census block group, we estimated the spatial lag. Traffic on one road is spatially autocorrelated with traffic on adjoining roads because traffic flows through adjoining roadways; likewise, traffic in a census block group is spatially autocorrelated with traffic in the adjoining block groups. The spatial lag accounts for traffic volume in the surrounding census block groups, creating a weighted average of traffic volume over the local area. This smooths census block group traffic volume and allows for a more effective estimation of average traffic volume in each census block group.37
Data analyses
Statistical analysis
The unit of analysis for all analyses was the census block group (n=653). Locations of pedestrian injuries and alcohol outlets were geocoded and mapped in ArcGIS V.10.4. To assess the initial hypothesis of a relationship between locations of pedestrian injuries and alcohol outlets, we mapped kernel intensity estimates to assess geographic variability among alcohol outlets and pedestrian injuries and calculated the Cross K function to assess clustering of pedestrian injuries around the fixed locations of alcohol outlets using R V.3.3.38 We then aggregated each variable to the census block group level using the join tool in ArcGIS to compute the count of pedestrian injuries and alcohol outlets per block group so as to assess neighbourhood effects.
We performed Poisson regression in R, analysing the counts of pedestrian injuries per census block group. We first assessed the univariate relationship between count of pedestrian injuries and each covariate of interest. Covariates found to be significant in univariate analysis were then assessed in the multivariate model, adding each control variable in a stepwise fashion. As each control variable was added, we calculated overdispersion statistics and Residual Moran’s I (RMI) to assess residual spatial variation not accounted for by the model’s covariates.38 We also calculated Akaike’s information criterion (AIC) for each model to select the best-fitting and most parsimonious model.38 Because the best-fitting Poisson model was overdispersed with significant unexplained spatial variation, we repeated model selection with the negative binomial distribution using the same stepwise system of covariate selection. Negative binomial regression derives as an alternative to Poisson regression that accommodates overdispersion. We again calculated AIC and RMI to assess residual spatial variation and model fit. The final multivariate model presented here represents the best-fitting, most parsimonious model with the least residual spatial variation according to the above criteria.
To calculate pedestrian injury risk attributable to the presence of alcohol outlets, we compared population count per census block group to injured pedestrian count using the attribrisk package in R.39 In this analysis, every city resident has the potential to experience an injury. The characteristics of the census block in which a person resides influence the injury risk for every city resident. We calculated the baseline injury risk assuming no alcohol outlets in Baltimore City but controlling for population density, per cent of vacant lots, traffic volume lag, median household income and Walk Score. We next included alcohol outlets and compared the baseline pedestrian injury risk to the outlet-included injury risk.
Missing data
We aggregated the physical disorder, social activity, roadway and intersection infrastructure scales, as well as Walk Score, to the census block group level using the join tool in ArcGIS. Because of the small size of census block groups and the financial and temporal limitations of street sampling, 123 (18.8%) block groups lacked measures for physical disorder, social activity, roadway and intersection scales. We performed ordinary kriging to estimate a city-wide map of values for each of the four scales.38 Using a planometric map of all city streets, we assigned a kriged value for each scale to each street centroid. We then aggregated the centroid values to the block group to calculate the average estimated score for each measure for each block group.
Walk Scores were only available for certain neighbourhoods, with n=33 (11.9%) neighbourhoods missing Walk Scores; Baltimore’s neighbourhood boundaries also do not align with census block group borders. We used similar methods as described above to estimate a kriged Walk Score value for each census block group.
Sensitivity analysis
The downtown neighbourhood block group contained 40 injured pedestrians and 32 alcohol outlets; in comparison, the next highest block group contained 13 injuries and 10 outlets. To assess potential biases associated with clustering, we calculated the distance from the geographic centroid of the downtown block group to the centroid of each block group in miles and assessed distance from downtown as a predictor of pedestrian injury. We also excluded the downtown block group to check that the injury–alcohol outlet relationship was not driven by the excessive number of alcohol outlets and injuries in this block group.
Results
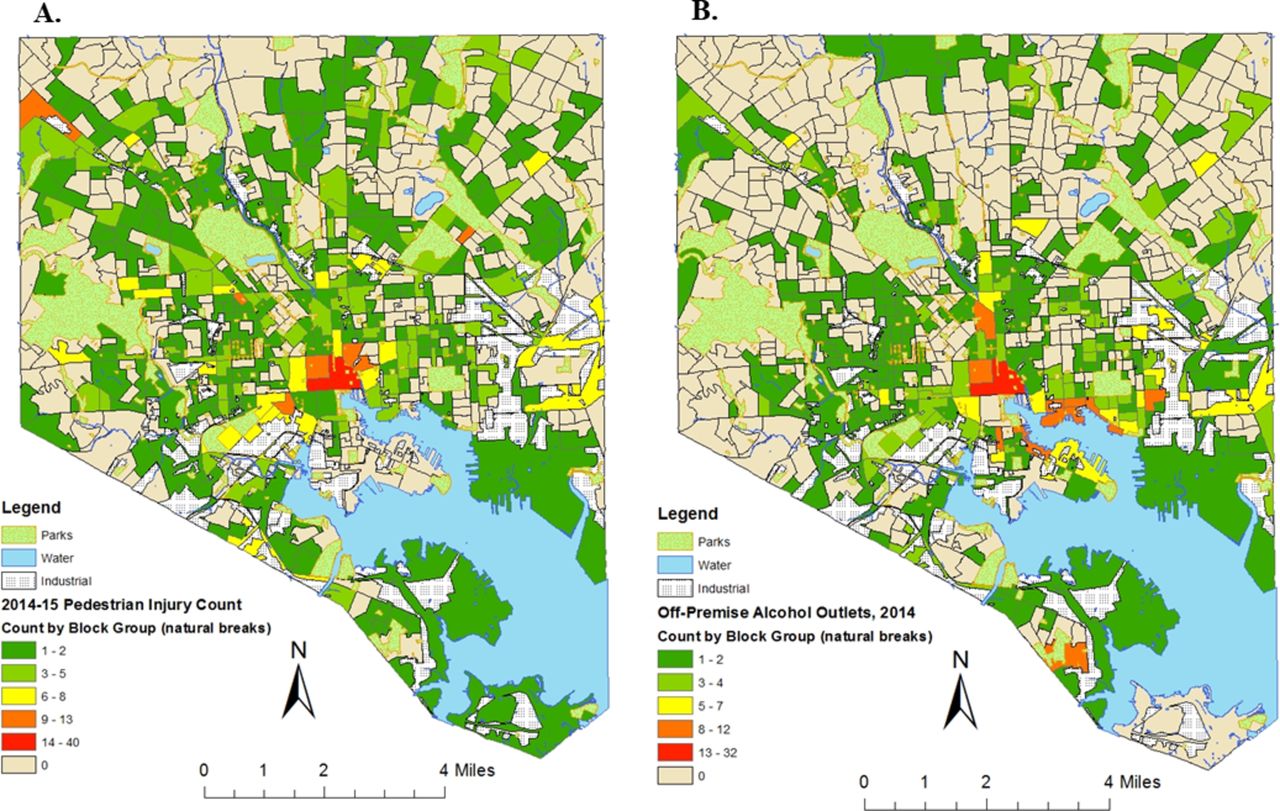
Table 1 shows the distribution of selected characteristics across block groups. There was an average of 1.3 (SD=2.36) pedestrian injuries per block group. The count of pedestrian injuries ranged from 0 to 40, with 46% of block groups (n=301) reporting no pedestrian injuries. The highest pedestrian injury count was reported in the downtown neighbourhood with 40 injuries, followed by the adjoining block group with 13 (figure 2). The downtown block group also reported the highest count of alcohol outlets with 32, followed by two block groups in the southeastern section of the city with 12. Over half (n=365) of block groups did not contain an alcohol outlet; on average, there were 1.06 (SD=2.13) alcohol outlets per block group.
Description of selected neighbourhood characteristics by census block group (n=653)
Distribution of pedestrian injuries and alcohol outlets by census block group for Baltimore City, 2014. Map A: count of pedestrian injuries from 1 January 2014 to 15 April 2015 by census block group (data source: Baltimore City Fire Department). Map B: count of off-premise alcohol outlets in 2014 by census block group (data source: Baltimore City Board of Liquor License Commissioners).
In the univariate negative binomial regression models, there was a statistically significant relationship between count of alcohol outlets and pedestrian injuries (table 2, ‘unadjusted’ column). For each unit increase in alcohol outlets, there was a 21.1% increase in pedestrian injury risk (95% CI 1.157 to 1.273, P<0.001). Physical disorder score, social activity score and roadway infrastructure score were not significant predictors of neighbourhood pedestrian injury risk in univariate analysis (P>0.05) and were excluded from the final model. Percent of vacant lots was significantly positively correlated with physical disorder score (r=0.666, P<0.0001) and social activity score (r=0.510, P<0.0001).
Univariate and multivariate results for negative binomial regression modelling of neighbourhood pedestrian injury risk by census block group (n=653)
The final multivariate model—count of alcohol outlets, per cent of vacant lots, median household income, population density, traffic volume and Walk Score—was the most parsimonious and best-fitting model (AIC=1898) and exhibited no significant residual spatial variation (RMI=0.0225, P=0.137) (table 2, ‘adjusted’ column). Alcohol outlet count remained associated with pedestrian injury risk after controlling for selected neighbourhood measures. Each unit increase in the number of alcohol outlets was associated with a 14.2% increase in neighbourhood pedestrian injury risk in the adjusted model (95% CI 1.099 to 1.192, P<0.001). In the attributable risk analysis, the pedestrian injury risk attributable to alcohol outlets was 10.4% (95% CI 7.7 to 12.7) or 88 extra injuries over baseline.
Vacant lots, Walk Score, median household income, population density and traffic volume were also strong predictors of neighbourhood injury risk. Each increasing per cent of vacant lots was associated with a 1.6% (95% CI 1.007 to 1.026, P=0.003) increase in pedestrian injury risk. Each unit increase in Walk Score—a proxy measure for pedestrian volume—was associated with a 1.8% increase in neighbourhood pedestrian injury risk (95% CI 1.011 to 1.025, P<0.001). Median household income and population density were protective of neighbourhood pedestrian injury risk. Every $1000 increase in income was associated with a 0.9% (RR=0.991, 95% CI 0.988 to 0.995, P<0.001) decrease in neighbourhood pedestrian injury risk. Every increase in 1000 people per square mile was associated with a 2.1% decrease in neighbourhood pedestrian injury risk (RR=0.979, 95% CI 0.970 to 0.989, P<0.001). With every increase in 1000 vehicles, neighbourhood pedestrian injury risk increased by 7.6% (95% CI 1.059 to 1.126, P<0.001).
In sensitivity analysis, the associations between alcohol outlet count and distance from the downtown outlier block group (r=−0.295, P<0.0001), and alcohol outlet count and intersection score (r=0.21, P<0.0001) showed significant correlation and multicollinearity. We substituted distance from downtown and intersection score for outlet count to assess if outlet count was a proxy measure for a different, highly correlated variable. Both models had significant unexplained spatial variation (RMIs=0.9 and 0.116, P<0.0001) and worse model fit (AICs=1974 and 1987). The removal of downtown strengthened the association between alcohol outlets and injury risk (RR=1.168, 95% CI 1.112 to 1.227, P<0.001); model fit also improved (AIC=1880). However, RMI became significant (RMI=0.046, P=0.015), indicating potential spatial variation unexplained by the covariates.
Discussion
The objective of this study was to explore the relationship between alcohol outlets and neighbourhood pedestrian injury risk. Each increase in the number of alcohol outlets was associated with a 14.2% increase in the neighbourhood RR of pedestrian injuries in the adjusted model. Our findings suggest that there is a strong relationship between neighbourhood presence of alcohol outlets and pedestrian injury risk in Baltimore City after controlling for selected neighbourhood factors. Substituting traffic safety infrastructure measures for alcohol outlets resulted in significant unexplained spatial variation, indicating that alcohol outlets may offer a unique contribution to injury risk. These findings are consistent with previous studies of alcohol-involved crashes conducted in several metropolitan areas of varying size across the USA.40 41
We also aimed to investigate the contribution of neighbourhood physical and social disorder to the relationship between alcohol outlets and pedestrian injuries. Our measures of physical and social disorder were not significant predictors of pedestrian injury, but they were highly correlated with percent of vacant lots in a neighbourhood. Each increasing per cent of vacant lots was associated with a 1.6% increase in pedestrian injury risk; vacant lots have not been studied previously as predictors of pedestrian injury. Vacant lot remediation has been shown to significantly decrease violent crime.42 Future research will explore if greening is also associated with reduced pedestrian injury risk.
Although neighbourhood disorder measures were not significant predictors, median household income was protective of injury risk—consistent with previous research that demonstrated an inverse relationship between income and average number of injured pedestrians in a census tract.4 This finding contributes to the literature on the inequitable distribution of pedestrian injuries and injury risk factors across urban areas.3 5 Future research should investigate the mechanisms by which neighbourhood income is protective of pedestrian injury risk.
Limitations
This study is cross-sectional and, therefore, does not allow for discussion of changes in the injury risk environment over time. We were unable to consistently identify alcohol-involved or drug-involved pedestrian crashes as these indicators were rarely recorded by EMS staff. It is possible that intoxication confounds the relationship between neighbourhood pedestrian injury risk and alcohol outlets; this association will be further investigated in future studies. Because the data on neighbourhood physical and social disorder were collected several years before the injury data, it is possible that these data do not accurately reflect neighbourhood physical and social disorder at the time of a pedestrian-involved crash. However, several studies have suggested that neighbourhood disorder is relatively stable and neighbourhood-level changes related to disorder can take 10–15 years to manifest.43 44
Neighbourhoods with more alcohol outlets may be visited by people looking to purchase or consume alcohol, and the high RR of pedestrian injury in these neighbourhoods may relate to this alcohol-related traffic.8 As we did not have access to the pedestrians’ residential addresses, non-residents may be included in injury counts. This also has implications for the simulated attributable risk, which assumes that the pool of pedestrians capable of being injured are all city residents and that injury risk is static based on the characteristics of their home census block group. Nevertheless, previous studies have shown that the majority of pedestrians are struck within a mile of their home,45 46 suggesting that injured pedestrians are representative of the neighbourhoods in which they are struck. Furthermore, because of the limitations inherent in data collection on pedestrians, calculations of injury risk are often based on estimates from readily available data sources such as census data or travel surveys.47 It is also possible that alcohol outlets are located in retail areas with heavy pedestrian traffic. Future research will compare pedestrian injury risk around alcohol outlets to the RR around other, similar retail outlets that do not sell alcohol.
Conclusions
This study reinforces the importance of alcohol outlets in understanding neighbourhood pedestrian injury risk and identifies possible modifiable risk factors for preventing pedestrian injury. This research may provide evidence for informing alcohol control policy decisions (eg, liquor store licencing, zoning and enforcement). A deeper understanding of the mechanisms by which alcohol outlets impact pedestrian injury risk will be essential for creating targeted, evidence-based safety interventions.
What is already known on the subject
The distribution of pedestrian injuries across urban neighbourhoods is not equal.
Alcohol outlets are associated with increased violent injury and crime.
What this study adds
Alcohol outlets in a neighbourhood increase the risk of pedestrian injury, even if the pedestrian and/or the driver are sober.
Vacant lots in a neighbourhood may be an important predictor of pedestrian injury not explored in previous research.
Acknowledgments
The authors would like to thank Alex Freed and Brian Weir for their support in preparing this manuscript.
References
Footnotes
Contributors All authors have complied with the principles of the ethical practice of public health and contributed substantially to the conception and design or analysis and interpretation of data. Specifically, EDN designed the research questions in collaboration with coauthors, conducted all data analysis, created the first draft of the manuscript, made substantial edits in the subsequent drafts and approved the final submitted draft. KMP and FCC participated in the design of the study, made substantial edits to drafts of the manuscript and approved the final submitted draft. ARK and AJM acquired the data, made substantial contributions to the interpretation of data and results and approved the final submitted draft. AJM, JVB and ACG made substantial contributions to the conceptualisation of the data analytic plan and interpretation of results, reviewed and revised the manuscript critically for important intellectual content and approved the final submitted draft. Each author certifies that he or she has participated sufficiently in the work to believe in its overall validity and take public responsibility for all of its content.
Funding This work was supported by the National Institute on Alcohol Abuse and Alcoholism (Grant Numbers R01-AA015196 and F31AA023716), the Centers for Disease Control and Prevention (Grant Number 1U49CE000728) and the National Institute on Drug Abuse (Grant Number R34DA034314).
Competing interests None declared.
Patient consent Not required.
Ethics approval This research was approved by the Institutional Review Board at the Johns Hopkins Bloomberg School of Public Health and deemed non-human subjects research.
Provenance and peer review Not commissioned; externally peer reviewed.
Data sharing statement The data that support the findings of this study are available from the Baltimore City Fire Department (BCFD), but restrictions apply to the availability of these data, which were used under licence for the current study and so are not publicly available. Data are however available from the authors upon reasonable request and with permission of BCFD.