Article Text

Abstract
Objective Pedestrian fatalities due to collisions with motor vehicles are a large public health problem in Romania, ranking them among the highest in Eastern Europe. The purpose of this study was to gain a better understanding of crash factors by examining how roadway and environmental characteristics contribute to pedestrian distraction and risky behaviours at pedestrian MVC (PMVC) locations in Cluj County, Romania.
Methods A sample of PMVC locations was selected from the 2010 Cluj County police reported crash database for on-site examination. A total of 100 sites were visited to collect details on site characteristics and typical pedestrian and driver behaviours. Variable distributions were examined and rate ratios of pedestrian distraction and risky behaviours were calculated.
Results Pedestrian distraction and risky behaviours were observed at rates of 6.3 and 24.3 per 100 observed pedestrians. The majority of distractions were related to electronic device use. Risky behaviours were evenly split between unpredictable, partial use of a crosswalk and midblock illegal crossings. Distractions and risky behaviours decreased as the number of pedestrians and average vehicle speeds at a site increased. RR of distraction was higher at intersections and locations with crosswalks.
Conclusions Pedestrian distraction was highly correlated with pedestrian risky behaviours at PMVC locations in Romania. Higher pedestrian volume was protective against pedestrian distraction and risky behaviours. Locations with painted crosswalks had increased distraction. Targeted distraction prevention, particularly at intersections and crosswalk locations, may contribute to the prevention of PMVCs.
- Risk/Determinants
Statistics from Altmetric.com
Introduction
Pedestrian injuries and fatalities account for 22% of all road traffic deaths and >270 000 deaths per year, worldwide.1 In Romania, a middle-income country, 39% of all traffic-related fatalities are pedestrians, which is the highest in the European Union.2 ,3 The Romanian pedestrian fatality rate is 10-fold that of the best performing countries.2 ,3 Road traffic fatalities in Romania have declined since 2008, but the proportion of pedestrians has increased from 37% in 2010 to 39% in 2013.2 ,3
As the number of vehicles increases on Romanian roads, so do pedestrian crashes4 and the need to enhance the safe mobility of pedestrians.5 The absence and poor maintenance of pedestrian facilities along with increasing traffic aggravate the issue, straining vehicle and pedestrian interactions.6 Pedestrian and driver distractions, which are increasing worldwide, are also likely to contribute to this problem1 ,7 ,8 and will likely continue to increase with the growth of electronic information and entertainment device use.9
Little is known about contributors to pedestrian MVCs (PMVCs), especially in Romania where studies are sparse and have relied on analysis of administrative data sets, including police or hospital records.10–12Worldwide, few studies of distraction and pedestrian safety have been conducted. These few studies have focused primarily on cell phone use and have relied on existing data sets or simulation-based studies. Even fewer have involved field observations,13 which can be the most accurate reflections of population-level behaviour when observation protocols are stringent and interobserver reliability is high. Current pedestrian data sources (crash, hospital, surveys) often lack or have under-reported pedestrian distraction, making it difficult to estimate the burden and examine if distracted walking causes and/or contributes to pedestrian safety problems.14 Observational studies may provide insights into natural behaviour of pedestrians and motorists and contribute to our knowledge of risk factors for PMVCs.15 ,16
Romanian law does not prohibit pedestrian use of electronic devices, but does prohibit handheld mobile phone use for drivers (but allows hands-free phone use15). However, international evidence shows that legislation against drivers' use of mobile handheld phones does not always influence driver behaviour.9 ,16 As the number of smartphone users grows annually, distraction continues to be a threat. It is estimated that by 2018 the percentage of the total population with smartphones in Eastern Europe will reach 62.4%17 of which Romanian users are considered some of the most mobile device-oriented.18 Other distractions, such as conversation with passengers; entertainment/navigation systems; and eating, drinking, smoking; degrade driving performance as well.19 Physical environmental factors like absence of mid-block crosswalks, width of roads and poor timing of crossing signals (eg, long delay between pedestrian light cycles) might encourage unsafe pedestrian behaviours.20
Like drivers, when distracted by mobile phones, music devices, food, other people or environmental factors, pedestrians tend to act less cautiously.9 Talking on a mobile phone or listening to music while crossing the road may result in unsafe behaviours, like reduced attention to traffic, reduced situational awareness, increased crossing time or failure to notice salient objects in the environment.9 ,14 ,19 ,21–24 A 10-country survey on distracted pedestrians showed that Romanian pedestrians were the most likely to cross while using mobile devices or phones (83%), continue a phone call (79%) or while listening to music (46%) compared with the other nine European countries surveyed.25
The aim of this study was to use administrative data and on-site observations to examine environmental factors and pedestrian and driver behaviour at PMVC locations in Cluj County, Romania, with a focus on pedestrian distraction and risky behaviours while interacting with the roadway. The chosen environmental, pedestrian and driver factors examined in this study represent variables that have been shown in a priori transportation literature to be related to crash risk, in general. This study supplements our previous epidemiological study26 of PMVCs in Cluj County by adding on-site observations of the PMVC locations. Specifically, we examine how traffic safety features and environmental factors impacted the rate of pedestrian distraction and pedestrian risky behaviours.
Methods
In 2010, there were 318 reported PMVCs included in the Cluj County, Romania, police crash database. Of those, 204 (65.4%) had location data available. Details on these crash data have been presented elsewhere.27 For the current study, a convenience sample of 100 sites was selected for on-site observation of environmental, driver and pedestrian behaviour characteristics. We were not able to observe all 204 sites that had location data available due to time and budget constraints. The 100 sites chosen were crashes that occurred during a weekday, between the hours of 07:00 and 19:00 and were equally distributed between local and national roads that were geographically representative of the county. Weekdays and daylight hours were chosen primarily for convenience and safety of our observers. Sites that had major infrastructure changes between the time the crash occurred and the time our study team completed the on-site evaluation were excluded. On-site observations were conducted during the summer of 2013.
Environmental variables collected on-site included crash site configuration (intersection, non-intersection, roundabout), number of lanes of index street where crash occurred, traffic controls (light, stop sign, yield sign), surface condition, land uses in area, parking, bicycle facilities (bike lanes or bike warning signs), paved multiuse trails and pedestrian facilities (pedestrian signs/signals, sidewalks, crosswalks, refuge islands and flashing warning lights). For locations where the crash occurred at an intersection, the index street where the crash occurred was identified based on information available in the police crash reports.
Pedestrian behaviours observed on site included illegal crossings (against red light, no crosswalk–midblock or did not use available crosswalk), unpredictable crossings (partial use of crosswalk) and distraction (by child, other pedestrian, electronic devices held to head, headphones, manipulation of an electronic device or reading). Distraction was specifically measured during the time the pedestrian entered the roadway to the time they completed their crossing (exited the roadway).
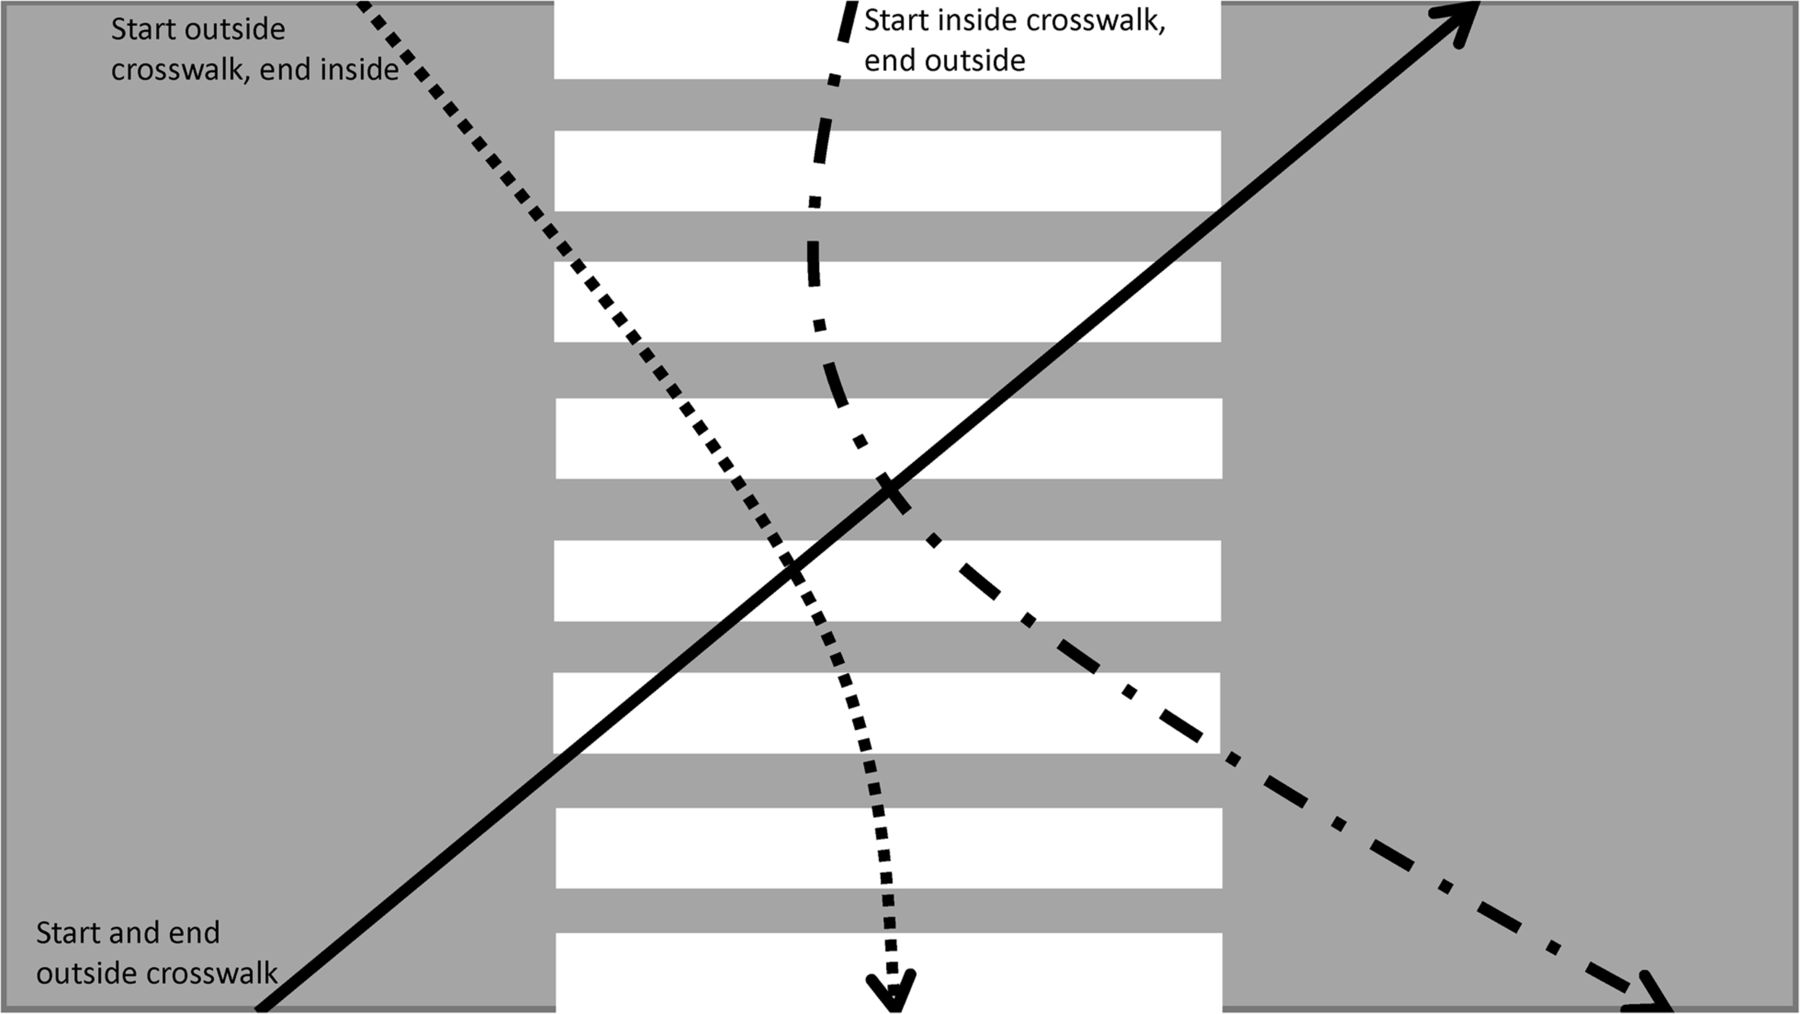
Unpredictable crossings, or partial use of crosswalk, were defined as crossings where the pedestrian starts crossing outside of a crosswalk and veers into the crosswalk before reaching the other side of the road, starts in a crosswalk then veers outside of it before reaching the other side of the road or cuts through crossing veering outside of it at both the beginning and end (see figure 1). These are considered risky behaviours because the pedestrian deviates from the intended path, marked by the crosswalk, and becomes unpredictable to other road users.

Three types of unpredictable, partial use of crosswalk.
For motorist behaviours, we captured the average motor vehicle speed of five consecutive vehicles using a radar gun. Semitrailer trucks and motorcycles were excluded from these consecutive vehicles due to potential for large variations in speed compared with other passenger vehicles. We also coded any apparent motor vehicle moving violations that had a direct impact on pedestrians (ie, evasive action required).
Ten-minute motor vehicle and pedestrian traffic volumes were manually captured at each site using the TurnCount28 traffic counting application. These counts were verified using video recordings taken during the on-site counts.
Still photographs were taken at each location (legs of intersection, direction of travel at non-intersections, pedestrian facilities and traffic controls and signage). A diagram of each location was also sketched, indicating the site configuration, camera and observer locations, pedestrian and bicycle facilities, sidewalks, traffic controls, traffic lanes, street names and cardinal directions. The photographs and sketches were used as references during data coding and cleaning.
Analysis
Frequencies, rates, rate ratios and corresponding 95% CIs of pedestrian distraction and risky behaviours were computed and stratified by site environment, driver and traffic safety characteristics. The unadjusted rate ratios and 95% CIs were computed using a negative binomial distribution and log link. The log-transformed count of pedestrians (number at risk) was used as an offset. Rate ratios were not calculated for variables with cell counts fewer than five.
Zero-inflated negative binomial models for distraction and risky behaviours were also built to examine adjusted rate ratios. Following the assumptions for a negative binomial model, both our outcomes (distraction and risky behaviours) had variances that were greater than their means. Zero-inflated models were used due to the large number of sites that had zero pedestrians observed, thus had an inflated number of zero counts of distraction and risky behaviours. A zero-inflated model is appropriate for this situation, given that it models two separate distributions, one for the excess zeros (count of pedestrians) and one for the regular count distribution.
SAS V.9.4 (SAS Institute, Cary, NC) was used to perform all analyses. The HPGENSELECT procedure was used for model building, with the backward selection option and Akaike Information Criterion (AIC) as the chosen criterion. Two models were built: one with the count of pedestrian risky behaviours as the outcome and one with the count of distracted pedestrians. For the risky behaviour model, main predictors considered included all the site environment, driver and traffic safety feature characteristics that were significant (p<0.05) in unadjusted analyses. These same variables were entered into the pedestrian distraction model, given the lack of significant variables at the p<0.05 level in unadjusted analyses and the high correlation between distraction and risky behaviours.
Results
A total of 1711 pedestrians were observed during 10-min traffic counts at 100 PMVC sites in Cluj County, Romania (table 1). Pedestrian distraction was observed at a rate of 6.3 per 100, while pedestrian risky behaviours were much higher at 24.3 per 100. The most common type of pedestrian distraction was using an electronic device, held hand to head, followed by manipulating an electronic device (eg, texting). Pedestrian risky behaviours consisted primarily of unpredictable, partial crosswalk use or illegal crossings midblock with no crosswalk. Only three pedestrians were observed crossing against the pedestrian signal light, but per site ranged from 0% to 100%. Although the rates of risky behaviours were much higher compared with distraction, risky behaviours and distraction were highly correlated (table 1).
Frequencies, rates and correlation of pedestrian distraction and risky behaviours at observed pedestrian MVC (PMVC) sites, Cluj County, Romania
Rates by environmental factors, traffic safety features and driver behaviours
Distraction
Pedestrian distraction rates were slightly higher within the city of Cluj-Napoca than outside (table 2). Residential areas had lower rates of pedestrian distraction compared with non-residential areas. Wider roadways, flat locations (vs slight hill) and locations with no designated parking had higher pedestrian distraction rates. Distraction rates were also higher when traffic lights were present. No distraction was observed at locations without sidewalks, paved trails or paved shoulders and distraction rates were lower at locations with no painted crosswalk compared with a painted crosswalk and crossing sign or a crossing sign alone. Distraction rates were also higher when pedestrian crossing aids (signal, push button, refuge island and/or flashing light) were present.
Pedestrian distraction and risky behaviour frequencies and unadjusted rate ratios during crossings at pedestrian MVC locations by environmental factors, driver behaviours and traffic safety features, Cluj County, Romania, 2013
Risky behaviours
Rates of pedestrian risky behaviour were higher outside the city of Cluj-Napoca and on narrower streets (table 2). Pedestrian risky behaviour rates were lower at intersections compared with non-intersections and places where motor vehicle moving violations involving pedestrians were observed and decreased with each mile per hour increase in average motor vehicle speed.
Lower pedestrian risky behaviour rates were found at locations with stop signs and bicycle lanes or bike warning signs compared with those without stop signs or bike facilities (table 3). Locations with both crosswalks and crossing signs had lower pedestrian risky behaviour rates compared with locations with no crosswalk and no crossing sign. Locations with sidewalks, paved trails or paved shoulders had lower pedestrian risky behaviour rates compared with those absent of such facilities.
RR of pedestrian risky crossing behaviours and distraction at pedestrian MVC locations, Cluj County, Romania, 2010
Multivariable results
Distraction
In adjusted models, residential areas did not remain protective, while intersections and locations with painted crosswalks and crossing signs had increased risk of pedestrian distraction compared with non-intersections and locations without crosswalks and crossing signs (table 3). Conversely, pedestrian distraction decreased with increased pedestrian volume and increased average motor vehicle speeds.
Risky behaviours
Increased average motor vehicle speeds, increased pedestrian volume and locations with bike lanes or bike warning signs were protective against pedestrian risky crossing behaviours (table 3). Conversely, pedestrian risky behaviours increased as the volume of distracted pedestrians increased.
Discussion
The current study investigated contributors to pedestrian risky behaviours and distraction in Cluj County, Romania using observational data collected at PMVC sites. This is the first observational study of pedestrians conducted in Romania and one of few, worldwide, making comparisons to other observational findings limited.
Our study observations revealed only 6% (range 0%–20% at each site) of active distraction among crossing pedestrians. However, a survey of smartphone users in 10 European countries (including Romania) found that 83% of Romanians admitted to having crossed streets while using a mobile device or phone and 79% had continued a phone call when crossing the street.25 These results suggest a common acceptance among Romanian smartphone users for being distracted during walking and crossing streets. This discrepancy suggests that although the majority of Romanians having previously been distracted while crossing, they are not distracted each time they cross a roadway.
An observational pedestrian study at intersections in San Francisco, California, found average pedestrian mobile device use while crossing was 8%, but ranged from 2.5% to 18% at study sites, similar to our study's observed rates.29 However, compared with two studies conducted in university towns in the USA the pedestrian distraction rates observed in our study were low, with those studies observing 29% and 44.1% distraction among pedestrians.24 ,30 Cluj-Napoca contains a university but is a larger and more diverse environment than these two studies. Our study also included areas in the county that did not lie within city limits.
In our study, only three observed pedestrians crossed against red, given red (0.5%, overall), but this ranged from 11.1% to 100% at the three sites where this behaviour was observed. The remaining observed signalised sites had zero crossing against red, given red. Compared with the San Francisco study, our overall crossing against a red light, given red was low (theirs was 29%, overall), but both our studies showed significant variation by site (San Francisco ranged 3.6% to 69.7% per site).29 However, the illegal crossings in our study primarily occurred at midblock locations, suggesting a need for additional environmental interventions (eg, additional marked crosswalks) to create safe and legal midblock crossings in Romania.
Intersections and painted crosswalks were particularly problematic for pedestrian distraction in our Romanian sample. Given that painted crosswalks are intended to increase pedestrian safety, it is possible that pedestrians perceive this as a safe zone to engage in a secondary task. The majority of intersection sites in our sample were in the most urban areas of Cluj County with high pedestrian volume. In these areas of high pedestrian density, pedestrians may have also been influenced by their pedestrian peers, relying on social information from the group on when to cross, thus freeing up their cognitive load, making room for secondary task engagement (eg, texting).31
The development and evaluation of targeted distraction prevention strategies is needed as there is a paucity of evidence-based interventions.32 However, one potential avenue for safety benefits is intelligent transport system applications, including infrastructure to pedestrian technology and the use of dedicated short-range communications between infrastructure, vehicles, and vulnerable road users. Behavioural interventions may also be beneficial.33
Pedestrian distraction in our sample was positively correlated with pedestrian risky behaviours. This finding is supported by existing research that has shown that distracted pedestrians are less likely to be aware of their surroundings and have compromised safety behaviours.13 Previous studies have shown pedestrian distraction contributes to inattentional blindness and can negatively impact safe walking behaviour.24 ,34 Greater risk of injury has also been found when crossing the street while talking on the phone, texting and listening to music,21 ,23 and this may be due to increased likelihood of making errors while distracted.
Finally, higher vehicle speeds and number of pedestrians were found to be protective against pedestrian risky behaviours. This may be attributed to the decreased likelihood of vehicles to stop for a pedestrian when travelling at higher approaching speeds35 and use of social information from nearby pedestrians or collective decision-making, which in this study appeared beneficial, but has also been found to be detrimental if relied on over non-social information.31
Limitations
On-site observations were not matched exactly to the day of week, time of day or time of year that they occurred due to our limited budget and timeline for project completion. We selected crashes for observation that occurred on weekdays between 07:00 and 19:00 and also conducted our observations during these days and hours. Our results, therefore, should only be generalised to weekdays and daytime hours.
Motor vehicle violations were difficult to detect in the videos and were not possible to code on site due to the coders being occupied by other tasks, therefore are likely under-represented in our data set. We also did not assess the contribution of driver distraction. This is likely to have contributed, in part, to some of the PMVCs that occurred at the sites we observed. Consequently, our findings cannot speak to the full contribution of motorist behaviour to pedestrian distraction and risky crossing behaviour.
Although not all of the 2010 PMVCs were analysed for the purpose of our study, we believe the sample was representative of national, local, urban and rural roadways, which took into consideration, the local versus national road differences, which were found in a previous study (eg, more pedestrian risky behaviours on local roads and more driver errors on national roads).26
Conclusions
In this study of PMVC locations in Romania, pedestrian distraction was correlated with pedestrian risky behaviours. Higher pedestrian volume was protective against both distraction and risky behaviours at observed PMVC sites. Increased motor vehicle speeds were protective against distraction and risky behaviours. Conversely, intersections and painted crosswalks increased risk of distraction, relative to non-intersections and non-crosswalk locations. Based on these results, targeted distraction prevention, particularly at intersections and crosswalk locations, may contribute to the prevention of PMVCs. Further investigation is needed to reveal the causal pathway between painted crosswalks (a countermeasure) and the increased distraction and risky behaviours found in this study.
What is already known on the subject
Pedestrian MVC (PMVC) rates in Romania are among the highest in Eastern Europe.
PMVCs in Romania are more likely to occur on national roads.
Pedestrian actions contribute to Romanian crashes more frequently on local roads.
What this study adds
Over 6% of all observed pedestrians were distracted.
Over 24% of observed pedestrians crossed illegally or unpredictably.
Intersections and locations with painted crosswalks had higher distraction rates.
Pedestrian distraction was positively correlated with pedestrian risky behaviours.
Higher vehicle speeds and number of pedestrians protected against risky behaviours.
Playing contact sports after age 40
Can adults over 40 safely play contact sports? This question was asked in the context of soccer (which does not seem to be a good example of a contact sport). But it includes better examples like hockey to make the point that there are clear ‘health, mental and social benefits’ from engaging in such sports even when participants are well past age 40. Supporters believe the positives outweigh the negatives of doing so. The positives include weight control, cardiovascular health and psychological benefits, assuming the participant achieves a reasonable level of fitness before starting and that the sport is played with rules that provide sensible protections.
Acknowledgments
The manuscript used data provided by the Department of Traffic Police, Cluj Police Inspectorate as part of a collaboration protocol signed with the Center for Health Policy and Public Health, Institute for Social Research, College of Political, Administrative and Communication Sciences, Babes-Bolyai University to support road traffic research in Cluj County. The authors thank all Department of Traffic Police members who contributed to this project through the crash documentation used in this study. They also like to thank Dr Joseph Cavanaugh for invaluable statistical input on the analysis for this project.
References
Footnotes
Contributors CH and CP-A: conception and design, analysis, and interpretation of data and in writing the final version of the manuscript for publication.
EB-A:, DD: and MP: conception and design, acquisition of data, interpretation of data and writing the final version of the manuscript for publication.
Funding Partial funding was provided by the NIH-Fogarty Funded University of Iowa Trauma Training Program (D43 TW007261) and the CDC/NCIPC-funded University of Iowa Injury Prevention Research Center (R49 CE002108).
Competing interests None declared.
Ethics approval University of Iowa Institutional Review Board.
Provenance and peer review Not commissioned; externally peer reviewed.