Article Text

Abstract
The objective of this study was to develop a modern version of the paediatric injury pyramid, a visual classification of injury severity, and to present mechanism-based pyramids. As the original paediatric injury pyramid was described in 1980, the injury epidemiology from 1980 was compared with 2004. Comprehensive emergency department, hospital discharge and death data for Massachusetts in 2004 were used to determine injury rates for residents aged 0–19 years. Injury pyramids were constructed on the basis of the number of injuries resulting in death, hospitalisations and emergency department visits. In 2004, unintentional and intentional injuries accounted for 197 deaths, 7120 hospitalisations and 199 814 emergency department visits giving a ratio of 1:36:1014. The 2004 injury pyramids differed by mechanism and intent. Compared with 1980, there were lower rates for overall injury and for most major injury mechanisms in Massachusetts in 2004.
- Injuries
- injury pyramid
- paediatric injury
- adolescent
- e-code
- public health
- child
Statistics from Altmetric.com
Introduction
Injuries are the leading cause of death and emergency department (ED) visits among US children.1 2 The concept of the ‘injury pyramid’ is derived from Heinrich's occupational injury prevention research from the 1930s.3 It visually depicts the burden of injury so that the bottom row represents ED visits, the central row represents hospitalisations, and the top row represents deaths due to injury. Wadman et al4 developed three distinct types of pyramid based on the lethality of the mechanism of injury: low case/fatality ratios resulted in the traditional triangle-shaped pyramid; intermediate case/fatality ratios created a more rectangular-shaped pyramid; and high case/fatality ratios led to an inverted pyramid (wide on top, narrow at the base).
Gallagher et al5 described the incidence of fatal and non-fatal injuries in Massachusetts children in 1980. It showed that, for every injury resulting in death, there were 45 hospitalisations and 1271 ED visits. From these data it has been extrapolated that, in 1 year, US childhood injuries account for ∼20 000 deaths, 600 000 hospitalisations and nearly 16 million ED visits.6 The objectives of this study are to describe the modern paediatric injury pyramid using comprehensive death, hospital discharge and ED visit databases for Massachusetts and to compare the injury rates from 1980 to 2004.
Methods
Study design
Comprehensive ED and hospital discharge data for fiscal year 2004 were obtained from the Massachusetts Department of Public Health for residents 0–19 years inclusive. Records containing International Classification of Diseases, 9th edition, Clinical Modification (ICD-9-CM) injury codes from 800 to 999 were included for these datasets.7 These databases are mutually exclusive from the ED data—that is, patients admitted to the hospital are not included in the ED database (even if admitted from an ED). Patients with the disposition of death were removed from the ED and hospital discharge datasets so there was no duplication of cases with the death dataset. Death data for Massachusetts were obtained from the Web-based Injury Statistics and Query System (WISQARS) from the Centers for Disease Control and Prevention (CDC) for calendar year 2004, which contains national mortality data from death certificates reported with International Classification of Diseases, 10th edition (ICD-10) injury codes.1
Main outcome measures
Injury-related deaths, hospitalisations and ED visits were grouped using the CDC's E-code matrix for injury mechanism and intent.8 Population estimates, including age-specific categories, for Massachusetts residents in 2004 were obtained from the US Bureau of the Census to calculate the annual rates of deaths, hospitalisations and ED visits per 100 000 people.9 Frequencies and rates for injuries in 2004 resulting in ED visits, hospitalisations and death were calculated (referred to as injury rates). The injury pyramids were constructed using the absolute numbers of ED visits, hospitalisations and deaths for overall and mechanism-specific injury. Data analysis was conducted using SAS V9.1.
Results
Injuries resulted in 197 deaths, 7120 hospitalisations and 199 814 ED visits (total 207 131) in Massachusetts in 2004 in a population of 1 630 656 children 0–19 years of age. The incidence rates of overall injury, unintentional injury and intentional injury were 12 702/100 000, 12 372/100 000 and 135/100 000, respectively. The remainder of the injuries (195/100 000) was recorded as undetermined intent or had no E-code. Of all injury events, 96.5% were treated and the patient discharged from the ED, 3.4% of patients were admitted to the hospital, and 0.095% resulted in death (table 1).
Injuries by mechanism: ED visits, hospitalisations and deaths. Ages 0–19 years. Massachusetts, 2004
The injury pyramids
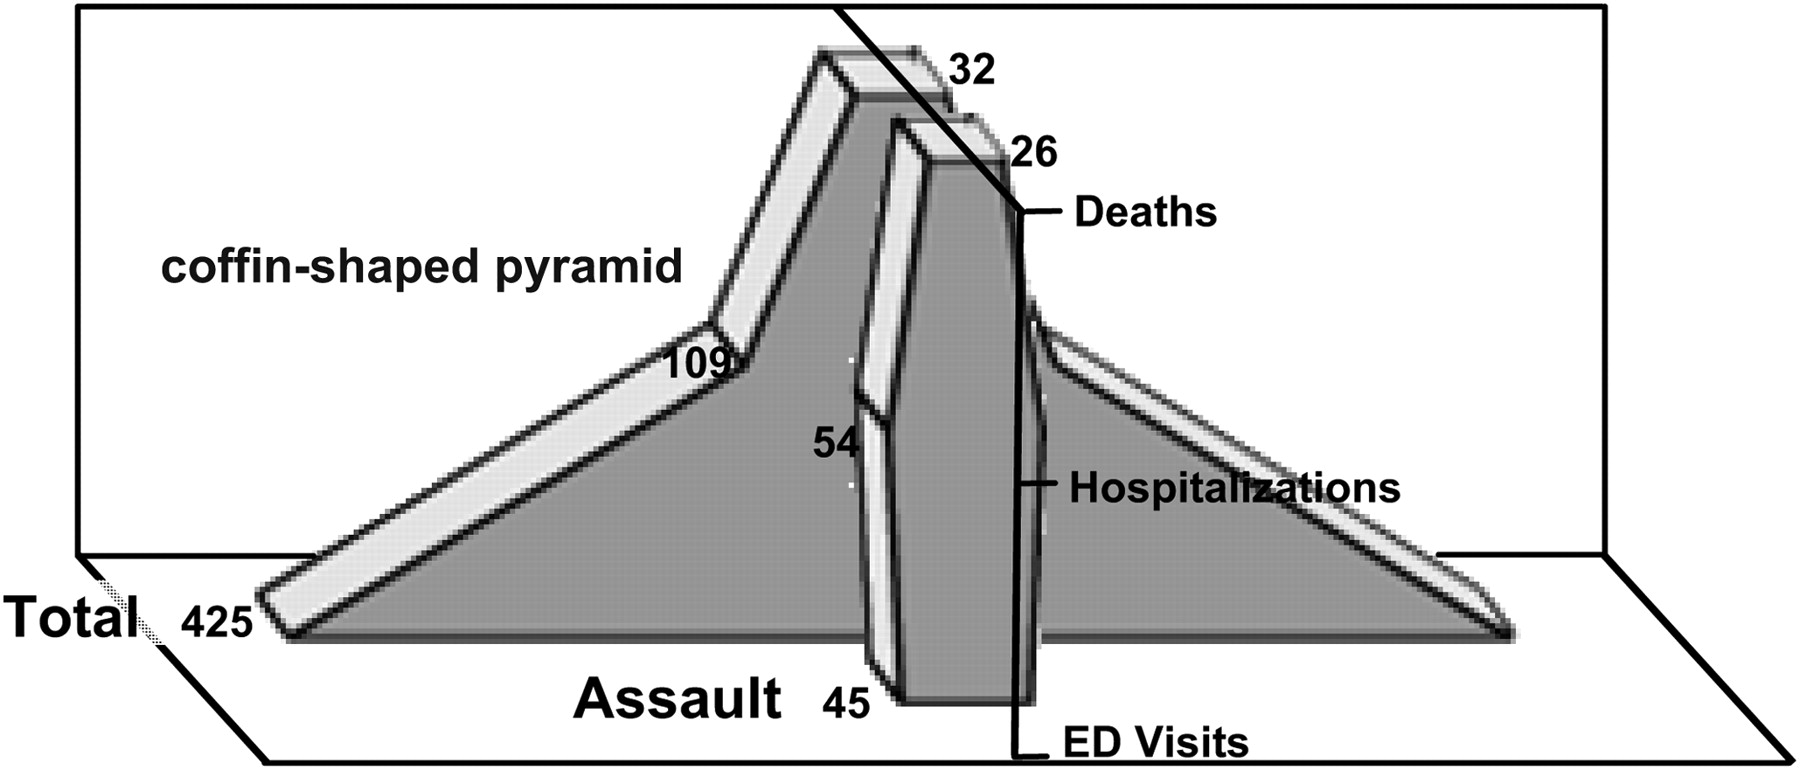
The mechanism-specific and intent-specific pyramids reveal various shapes (figures 1 and 2).4 For example, there were more hospitalisations (54) for firearm assault injuries than ED visits (45), in addition to 26 deaths, reflecting the lethality of this mechanism (figure 2).

All injury mechanisms (width of the pyramid represents 46 976 injuries). ED, emergency department; MVC, motor vehicle crash.
Number of firearm injuries, total and assault (width of the pyramid represents 425 injuries). ED, emergency department.
Comparison with injury epidemiology of 1980
The 2004 unintentional injuries rate of 12 372/100 000 is markedly decreased from the 1980 unintentional injuries rate of 22 390/100 000. This decrease was also reflected in the 2004 rates of unintentional injury-related ED visits (12 009/100 000), hospitalisations (356/100 000) and deaths (7/100 000) compared with the 1980 unintentional injury rates of ED visits (21 600/100 000), hospitalisations (770/100 000) and deaths (17/100 000).5 Comparing the 2004 unintentional injury pyramid of 1:49:1660 with the 1980 unintentional injury pyramid of 1:45:1271 reveals that the ratio of hospitalisations to ED visits was significantly less in 2004 than in 1980 (odds ratio 0.83; 95% CI 0.77 to 0.90). Specific mechanisms also showed reductions in injury rates: falls decreased from 5480/100 000 in 1980 to 2189/100 000 in 2004; pedal cyclist injuries decreased from 870/100 000 in 1980 to 372/100 000 in 2004; and burns decreased from 500/100 000 in 1980 to 171/100 000 in 2004.5
Discussion
Injury pyramids
In this paper we constructed the modern paediatric injury pyramid from population-based data, which evaluates the spectrum of medically attended injuries from ED visits to hospitalisations to death. The pyramid for total injuries yields a small tip representing the number of injury-related deaths, a narrow middle section of hospitalisations, and a large base of ED visits giving a ratio of 1:36:1014. Ballesteros et al10 similarly found for US children the overall ratio of one death for every 1000 injury-related ED visits. Assault-related firearm injuries were the most lethal, with 1.7 ED visits and two hospitalisations for every one death, resulting in a ‘coffin-shaped’ figure. The use of such injury pyramids may be helpful to policy makers, healthcare providers and parents to develop injury prevention programmes based on the mechanism of injury as reflected in the pyramid shapes or the total numbers of injuries.11
Comparison with 1980
Over 20 years ago, Gallagher et al5 described a year of injury surveillance data in Massachusetts for children and adolescents 0–19 years from their Statewide Childhood Injury Prevention Program Surveillance System. Their data were extrapolated from a surveillance population of 87 000 children from 23 hospitals in 14 Massachusetts towns. With comprehensive state-based data, we determined that the overall (unintentional+intentional) incidence rate of injury for Massachusetts children in 2004 was 12 702/100 000, which is almost half the estimated incidence rate of unintentional injuries for Massachusetts children in 1980 of 22 390/100 000. Increased use of primary care visits for injury and health insurance coverage changes may account for some of this discrepancy. Significant decreases in the rates of fall, pedal cyclist and fire/burn-related injuries in 2004 compared with 19805 may be due to more widespread use of injury prevention equipment such as window guards, bicycle helmets and smoke alarms.12–17 ICD-9 code revisions from 1980 to 2004 may have resulted in differences in the reporting of certain types of injuries, which could contribute to the rate changes. The 1980 data were extrapolated from small area surveillance data, whereas the 2004 data were obtained from statewide administrative databases; the differences in these data sources may also account for some of these discrepancies.
In addition, the number of hospitalisations per ED visit for unintentional injury significantly decreased, with approximately 28 ED visits for every hospitalisation in 1980 compared with 34 ED visits in 2004, a 20% reduction.5 Changes in insurance reimbursement and technology, including the widespread use of CT in the ED, may have resulted in patients being discharged who would have previously been hospitalised. The expanded scope of care in the ED, including the use of procedural sedation for fracture reduction, may have also decreased admission rates.
Although national and statewide databases are useful sources of injury data, there are some important limitations to this study because of their use. The first is the possibility of miscoding, as ICD-9-CM codes and E-codes were used to identify children and adolescents who were in the ED or hospitalised after an injury, whereas ICD-10 codes were used for the death data from the WISQARS. For injuries coded as ‘other’ or ‘unspecified’ or with no E-code (35% of the data), no further case-specific information can be gathered to determine this information. In our study, the ED and hospital discharge data represent fiscal year 2004 (October 2003–September 2004), whereas the death data represent calendar year 2004. Both datasets represent a complete 12 months of data; therefore we do not expect a significant difference in the numbers between the fiscal and calendar year.
To completely represent the burden of injuries on the healthcare system, outpatient office visits would ideally be included as the lowest part of the pyramid; however, those comprehensive data are not yet available. There are national estimates of injury visits to ambulatory settings other than EDs, which show that a significant number of injuries receive initial treatment for injuries in non-ED settings.18–20 Although some of these injuries may be minor, because of their frequency, they are still a significant use of medical resources. Depicting outpatient visits as the lowest level of the pyramid may aid clinicians in providing anticipatory guidance about injury prevention to families.
Conclusions
While injuries continue to have a major impact on Massachusetts children, the injury rates in 2004 were less than they were in 1980. Injury pyramids graphically represent the magnitude and lethality of particular injury mechanisms in a population and can be used to direct injury prevention efforts.
What is already known on this subject
The injury pyramid is a graphical representation of the burden of injuries on the healthcare system.
Different mechanisms of injury yield different pyramid shapes, reflecting the lethality of the mechanism.
On the basis of the paediatric injury pyramid from 1980 of one death for every 45 hospitalisations and 1271 emergency department (ED) visits, it has been extrapolated that paediatric unintentional injuries account for ∼20 000 deaths, 600 000 hospitalisations and nearly 16 million ED visits annually in the USA.
What this study adds
This study developed a modern paediatric injury pyramid showing one death for every 49 hospitalisations and 1660 ED visits for unintentional injury in Massachusetts in 2004.
The injury pyramids differed by mechanism and intent.
The rate of unintentional injury, rates for most major injury mechanisms and the ratio of hospitalisation per ED visit were dramatically decreased in 2004 compared with 1980.
Acknowledgments
We thank Aaron Pikcilingis for his assistance with the injury pyramid figures.
References
Footnotes
Competing interests None.
Ethics approval This study was conducted with the approval of the Children's Hospital Boston Committee on Clinical Investigation.
Provenance and peer review Not commissioned; externally peer reviewed.