Article Text

Abstract
Background: There are no validated observational surveys to assess injury hazards in the home environment.
Objective: To evaluate the reproducibility and reliability of a survey quantifying home injury hazards for children.
Methods: A nested cohort of children in the intervention arm of the Home Observations and Measures of the Environment (HOME) Study trial were analysed. The number and density of hazards were quantified by research assistants in the homes of participants at a baseline visit (BHV) for four high-risk rooms (kitchen, main activity room, child’s bathroom and child’s bedroom) and stairways and later at an intervention planning visit (IPV) for the four high-risk rooms and entire household. Statistical analysis included Pearson correlation, Bland–Altman analysis of agreement, analysis of variance and κ statistics.
Results: There were163 households with measurements at BHV and IPV. The number and density of hazards for the four high-risk rooms correlated significantly between BHV and IPV (r = 0.50 and 0.75, respectively). The number and density of hazards for the four high-risk rooms correlated significantly with that for the whole household at the IPV (r = 0.17 and 0.52, respectively). The number of injury hazards was significantly higher in the kitchen than in the other high-risk rooms, whereas density was highest in the child’s bathroom. Inter-rater reliability between research assistants, as measured by the κ statistic, was excellent with a mean of 0.81.
Conclusions: The HOME Injury Survey was a reliable and replicable tool for quantifying residential injury hazards. The density of injury hazards was a more stable and valid measure than the number of injury hazards.
Statistics from Altmetric.com
The home environment is a leading location of injury-related morbidity and mortality for US children. Despite significant reductions in injuries and deaths over the past two decades, injuries sustained in the home still account for over 2800 deaths, 74 000 hospitalisations and 4 million emergency visits in US children under 19 years of age each year.12 To prevent morbidity and mortality from residential hazards, we must continue to identify and control injury hazards in the home environment.
There are observational tools to identify and quantify home injury hazards, but none that have been validated for interobserver reliability, test–retest reliability and external validity. Several studies have examined the home environment to confirm parental reports of injury control measures.3456789 The instruments have found less than optimal sensitivity and specificity between parental report and observed hazards in the home.810 Furthermore, no-one has validated these instruments for their test–retest characteristics over time using the same instrument on the same environment (reliability) or the test–retest agreement between research assistants at the same visit (replicability), nor assessed external validity by examining an instrument’s association with recognised risk factors for home injuries. Hazards within a home are likely to be dynamic over time (eg, scissors moving from cabinet in kitchen to drawer in bathroom after usage), and no previous studies have examined the dynamic nature of injury hazards in the home environment. To enhance the measurement of injury hazards and injury prevention efforts, it is essential to develop and validate a survey instrument to quantify injury hazards in the home environment.11
The purpose of this study was to develop and validate an instrument to quantify injury hazards in the homes of young children. We hypothesised that: (1) the number and density (number of hazards per 100 sq ft) of hazards measured in four high-risk rooms (kitchen, main activity room, child’s bedroom and child’s bathroom) would be reliable; (2) the number and density of hazards identified in the four-room survey would be representative of the number and density of hazards identified across the whole household; (3) the number and density of hazards independently identified by multiple research assistants at the same visit would be replicable; and (4) the number and density of hazards identified at a baseline home visit (BHV) would be significantly associated with some of the known risk factors for residential injury.
Methods
These analyses are based on data from a nested cohort of children in the injury intervention arm, before intervention, of the Home Observations and Measures of the Environment (HOME) Study. The HOME Study is a prospective, randomised, controlled two-arm trial of residential injury and lead hazard control. The intervention in the injury arm consists of the installation of multiple consumer safety products to reduce exposure to injury hazards in the home. Each arm serves as the other’s control. The primary outcome for the injury intervention trial is a reduction in emergency and medically attended injuries for children from birth through 3 years of age.
The survey used to assess homes for injury hazards, the HOME Injury Survey, was developed by analysing the leading mechanisms for emergency visits for US children and a review of instruments used in other studies.1791213 The leading unintentional mechanisms of residential injury resulting in an emergency visit are: cutting/piercing, struck/strike, fall, poison and burns.1 Five high-exposure, high-risk areas in homes have been identified in several studies by parents of young children as being of concern for child safety: the kitchen, the main activity room (where TV and toys are kept), the child’s bedroom, the child’s bathroom and stairways.1314 Next, we conducted a pilot survey of the home environment for injury hazards with an experienced home child-proofer. The pilot instrument was revised after the survey of six homes. The final instrument included 55 items covering five mechanisms of injury and was used at the BHV, an intervention planning visit (IPV) and at subsequent annual visits for the five high-exposure, high-risk areas of the home. The survey was designed to focus on hazards below eye level for a 3-year-old child or about the 75th centile for height of a 3-year-old boy (1 m/39 inches).
The current analysis focuses on the first two visits: BHV and IPV. The BHV occurred before randomisation and birth in all enrolled participant’s homes and surveyed the four high-exposure, high-risk rooms and stairways. The IPV occurred only in homes in the injury intervention arm of the trial and included the rooms surveyed at the BHV and all finished living space including basements and attics. Surveys were conducted by trained research assistants at a mean (SD) of 5.4 (2.3) months after the birth of the child. The IPV was conducted 9.9 (2.7) months after the BHV. The instrument required ∼20 min to complete the BHV four-room survey and 1 h of research assistant time for the IPV.
Statistical analysis
To assess reliability, we correlated the number and density of hazards identified at the BHV with a survey of the same rooms several months later during in-home visits before installation of the intervention, the IPV. At the IPV, in addition to the four high-risk, high-exposure rooms and stairways surveyed at the BHV, all finished living space of the home was surveyed. To examine whether a four-room survey was representative of all finished living space, we examined the correlation of the survey of injury hazards identified in the four-room subsample with a survey of the whole household living space conducted at the same visit (the IPV). Replicability was assessed using a random selection of pairs of research assistants from the total of seven involved with the study: κ scores were estimated for each item in the instrument by having the research assistants survey 100 rooms within hours of each other.15
As a measure of external validity, we examined the association of the number and density of hazards with some known risk factors for home injury included in the trial. These risk factors included maternal and child demographic characteristics, maternal depressive symptoms, and socioeconomic factors.121617 We used measures of depressive symptoms (Beck Depression Inventory)16181920 and other sociodemographic data collected at BHV and IPV to examine the association with the number and density of hazards at both the BHV and IPV.
The total number of hazards per room was quantified, and the sum over the rooms represented the total hazards. The area in square feet (sq ft) was measured for the whole house and each of the high-exposure/high-risk rooms (stairways were not included). The density of hazards was determined by dividing the number of hazards by the area of the room. The configurations of the stairways (landings between steps, widening at top and bottom entries, and occasionally spiral design) precluded a standardised approach to the measurement of stairway area and so this was not collected, and the density of hazards for stairways therefore could not be determined. The total household density was the total number of hazards divided by the total area of the house (excluding stairways). Number and density of hazards was examined for violation of the normality assumption before analysis. Pearson correlation coefficients are presented as appropriate. For assessment of the agreement between number of hazards and hazard density between BHV and IPV, a Bland–Altman analysis was undertaken.2122 Analysis of variance with post hoc Student–Newman–Keuls correction was used to compare number and density of hazards between rooms at the BHV and IPV separately. p<0.05 was considered significant. SAS V9.1 was used for analysis.
Results
We screened expectant mothers presenting to obstetric practices for prenatal care for eligibility for the HOME Study. Of the 8878 women screened, 3366 (37.9%) were excluded (fig 1). The reasons for exclusion were: less than 18 years of age, over 19 weeks of pregnancy gestation, living in a home built after 1978 (year legislation passed banning lead-based paint), living outside the five Ohio county (Hamilton, Clermont, Warren, Butler and Brown) study area encompassing the City of Cincinnati or living in public housing, shelters, group homes or trailer homes. Another 3921 (44.2%) were found to be ineligible because they had plans to relocate outside of the study area in the near future, discontinued prenatal care at participating obstetric practices and hospitals, were not fluent in English, or had a medical condition that would interfere with study participation. An additional 328 (3.7%) did not respond to the invitation letter and could not be contacted.

Home Observations and Measures of the Environment (HOME) Study Injury Survey Enrolment.
A total of 1263 (14.2% of those screened) women were eligible for participation. Of these, 795 declined to participate and 55 dropped out during the run-in period for the trial and before randomisation. After the BHV, but before randomisation, an additional 53 became ineligible because the landlord refused to participate, and five dropped out. This left 355 expectant mothers who consented to participate. These women were randomly assigned, before delivery of their infant, to the injury intervention arm of the trial (n = 181) or to the control arm (n = 174). For this analysis, we report on 163 who did not relocate and had complete data on follow-up from BHV through IPV. All of the participants in the injury intervention group in this analysis received in-home visits by research assistants at both the BHV and IPV.
The mean age of the enrolled mothers at the intervention planning visit was 30 years (table 1). The majority of enrolled children were white, non-Hispanic and half were an only child. Most households had an annual income of <US$70 000. Most households and children had private health insurance, and just over half of enrolled mothers had a college degree.
Demographic characteristics of mother–child participants (n = 163)
Households in the injury intervention arm varied by size and number of rooms, with a mean of 13 rooms (range 5–26). Most were single family dwellings, and 57% were located in urban areas of the City of Cincinnati (table 2). The mean size of the housing units was 1401 sq ft (range 288–4172). The mean total space for the four high-risk, high-exposure rooms was 547 sq ft (range 229–1093).
Household characteristics (n = 163)
The number and density of hazards were significantly lower at the BHV than at the IPV. The mean number of hazards for the four rooms was 31.8 at the BHV and 37.0 at the IPV (paired t test, t = 59 on 162 df, p<0.0001). The mean density of hazards for the four rooms combined was also significantly different between BHV and IPV (6.1 and 7.1 hazards/100 sq ft, respectively; paired t test, t = 42 on 158 df, p<0.0001; table 3). The number and density of hazards correlated highly between the BHV and IPV (table 4; r = 0.50, r = 0.75, respectively, both p<0.0001).
Mean number and density (number per 100 sq ft) of hazards for baseline home visit (BHV) and intervention planning visit (IPV) (n = 163)
Correlation of the mean number and density (number per 100 sq ft) of residential injury hazards (n = 163)
The number and density of hazards for the four rooms correlated significantly with the number and density for the whole household at the IPV (r = 0.17, p = 0.03 and r = 0.52, p<0.0001, respectively). To assess agreement, we followed the methodology proposed by Bland and Altman.22 Briefly, this approach examines the difference between individual measures and the mean across all measures taken allowing examination of bias, precision and outliers. We found minimal correlation between the difference and sum for both the number of hazards and the density for the total of the four areas at the two time points (r = 0.08 and 0.009, respectively). Thus, Bland–Altman figures show no systematic bias, and only four (2.5%) of the data points were outside the limits of agreement for number or density of hazards. Similar results were seen when we assessed the rooms individually.
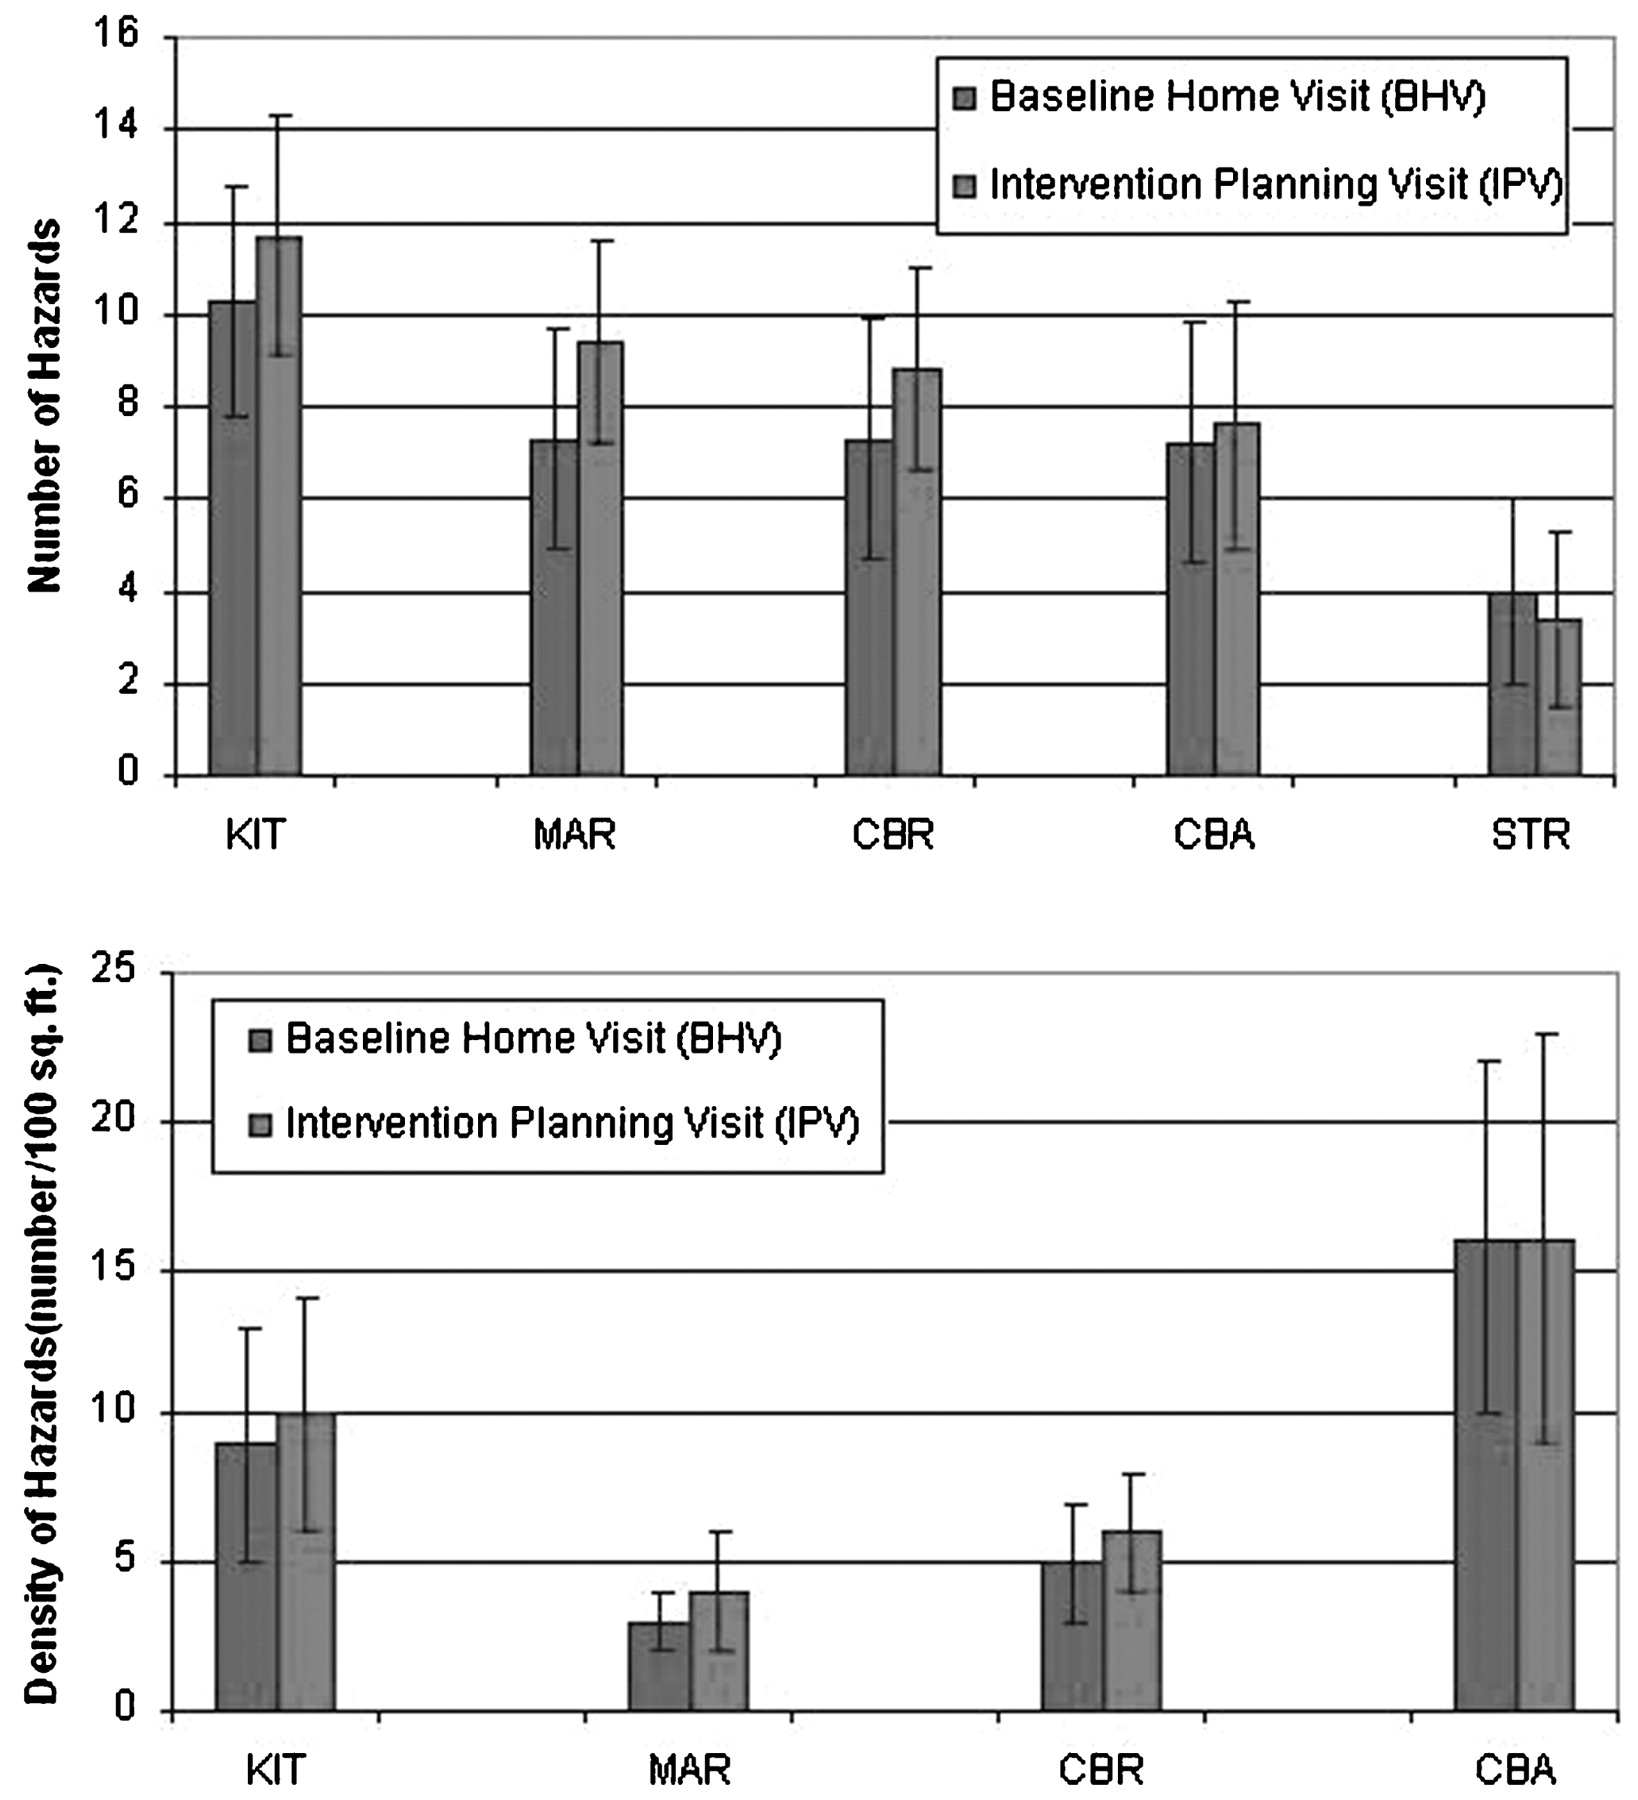
We found that the number and density of hazards correlated over time for the individual rooms, but the density of hazards consistently correlated more highly than the number of hazards (table 5). The number of hazards in the stairways also correlated highly between the BHV and IPV (table 5, r = 0.51, p<0.0001). The number and density of hazards varied significantly by room of the home, with the kitchen having the highest number of hazards at both BHV and IPV (10.3 and 11.7, respectively). In contrast, the child’s bathroom had the highest mean density at the BHV and IPV (15.8 and 16.5 hazards per 100 sq ft, respectively; fig 2).

Number and density (number per 100 sq ft) of hazards by room at the baseline home visit and intervention planning visit (n = 163). KIT, kitchen; MAR, main activity room; CBR, child’s bedroom; CBA, child’s bathroom; STR, staircase.
Correlation of the number and density (number per 100 sq ft) of injury hazards by room for the baseline home visit and intervention planning visit (n = 163)
We assessed the agreement between seven research assistants using the instrument in 100 randomly assigned rooms evaluated within hours of each other. In general, agreement was strong, with κ scores ranging from 0.65 and 0.66 for free standing furniture and accessible choking hazards to 0.94 and 1.00 for oven door guards and accessibility of fire escapes on the 2nd floor and higher (table 6). The overall agreement across hazards assessed between research assistants was 0.81, reflecting excellent agreement. In fact, 22 of the 26 items assessed showed excellent agreement, as defined by a κ of 0.70 or more.
κ scores for research assistants surveying 100 randomly assigned rooms
We assessed the external validity of the instrument by examining correlations of the number and density of identified hazards with some recognised risk factors for childhood injury measured within the HOME Study. In general, the number of hazards did not correlate significantly with the risk factors examined. In contrast, the density of hazards correlated significantly positively with maternal depressive symptoms and significantly negatively with maternal age and income (table 7). The number and density of hazards were not associated with the level of maternal education at the BHV (p = 0.84 and 0.36, respectively) or IPV (p = 0.35 and 0.06, respectively), using analysis of variance.
Correlations (Pearson r (p value)) for the number and density (number per 100 sq ft) of residential hazards at baseline home visit and intervention planning visit according to maternal socioeconomic characteristics (n = 163)
Discussion
The HOME Injury Survey, a tool to quantify unintentional injury hazards in the indoor environment of homes with young children, was reliable, with good correlation and agreement over time, and replicable, with good agreement between research assistants assessing identical rooms. In addition, it was externally valid—that is, it correlated with some of the known risk factors for childhood injury including maternal depressive symptoms, household income and maternal age. Finally, although it was not a random sample of rooms, the four high-risk, high-exposure rooms identified by parents correlated significantly with the mean number and density of hazards for the whole household.
The density of injury-related hazards in the home (number of hazards per area) was a more reliable and valid measure of childhood injury hazards than the number of hazards. It was not obvious why this is the case. “Standardising” the number of measured hazards by dividing by the exposed area of a room or household might reduce the degree of variation between visits, but this is unlikely as the coefficient of variation (SD/mean) was slightly higher for the mean density than for the mean number of hazards (table 3), indicating greater variability around this metric. In addition, the Bland and Altman analysis showed good agreement for hazard density over time between the BHV and IPV measurements and between the abbreviated four-room survey and the comprehensive survey of the entire living space completed at the IPV.2122 Although we could not directly measure a child’s exposure (through video, time-lapse analysis) to specific hazards, it is likely that the density is a better indicator of a child’s probability of encountering a hazard—that is, the higher the density of hazards, the more likely a child will encounter a hazard. This conclusion is supported by the significant correlation of injury hazard density with some known risk factors for childhood injury.1620
Although the HOME Injury Survey has good reliability, replicability and external validity, the ultimate validation of this instrument is whether it predicts childhood injury. Thus, future studies will need to examine whether the mean number or density of hazards quantified by this or other instruments predict reports of injury during early childhood.
The HOME Injury Survey was shown to be replicable and efficiently administered by research assistants, who evaluated the same 100 randomly assigned rooms within hours of each other. κ Scores were generally strong, with a mean of 0.81. Lower κ scores were measured for the presence of child safety caps on medicines and the presence of movable furniture, but these still represented moderate to strong agreement between research assistants. The highest κ scores were achieved for assessment of stove top height and accessibility and the presence of fire escape ladders.
We found that the density of injury hazards identified by the HOME Injury Survey was associated with some recognised risk factors for childhood injury including maternal depressive symptoms and socioeconomic indicators, such as income and maternal age.116202324 The finding that household income and maternal age correlated inversely with a higher density of injury-related hazards may help to illuminate the associations found in previous research on childhood injury.20 Younger parents or those with lower educational or income levels may not have the training or resources necessary to make their homes safe through the purchase and installation of home safety products.62025 It also is likely that mothers with higher levels of depressive symptoms have diminished ability to maintain a safe environment.1626 This may explain the association of depressive symptoms with the density of hazards observed in this study and increased risk of childhood injury in other studies.1624
Home hazard survey instruments are essential to understand mechanisms of injury and effective ways to control it. Although there has been progress on indoor safety (eg, safe tap water temperature and fire-resistant clothing and building materials) over the past three decades and injury rates appear to be on the decline,2272829 racial disparities persist, and further reductions in home injury will require continued innovation.
The prevention of home injuries has typically relied on provision of safety devices and teaching parents about supervision or their children about home safety rules.5121317303132 There have been several studies and a systematic review of the effect of education, counselling and provision of free or reduced-cost safety devices with the aim of controlling residential injuries. These educational interventions have produced increases in parental knowledge and the use of safety devices, but they have not examined or reported a reduction of injury outcomes in the participants.5122533 To understand if a residential injury control intervention is effective, accurate, reliable and valid measures of exposure to potential injury hazards in the homes of young children are required.
There are several limitations of this study. Many hazards in the home environment are dynamic. Still, despite the fact that hazards may change or be moved between rooms over time, we found that our density measures correlated highly and exhibited good agreement over time. Although the correlations for the number and density of hazards between the four rooms and whole household were moderate, the selection of the four high-exposure, high-risk areas and stairways was based on previous studies of parenting perceptions and behaviours toward residential injury risk and therefore may represent a biased sample of areas of the home.71314 Nevertheless, the strong correlation of the four high-risk rooms with the whole house indicated that these rooms can be sampled to assess housing units for injury hazards in epidemiological studies. This cohort of mothers, their children and homes represented a more affluent and educated group; however, almost 40% lived below the median annual household income for the US (US$50 233), and 25% were near or below the poverty level (US$21 200 annual income in 2008 for a family of four). Mothers participating in this study were similar to the age (country-wide mean 27.3 years) and racial and ethnic backgrounds of mothers who gave birth in the five counties from which they were enrolled: 72% white, non-Hispanic, 21% black, 5% Hispanic and 2% other (Ohio 2007 birth certificate data). The HOME Injury Survey instrument was based on residential injury mechanisms specific to US urban, suburban and rural households. Although the instrument may be of utility in more developed nations similar to the USA where younger children spend a great deal of their time in the indoor environment, it was not designed for use in underdeveloped nations and different cultures where home environments and the time spent indoors is likely to be qualitatively different.
Conclusions
The HOME Injury Survey is a reproducible and reliable instrument to assess the home environment for injury-related hazards for young children. The density of injury hazards (number of hazards per area) was a more reliable, replicable and valid measure of home injury hazards than the number of hazards. Before this instrument is routinely used, however, future studies are needed to test the predictive ability for injury-related hazards measured with injury events in prospective cohorts of young children.
What is already known on this subject
Unintentional injuries in the homes of children contribute substantially to their health services burden, morbidity and mortality in the USA including more than 4 million emergency visits, over 70 000 hospitalisations and more than 2800 preventable deaths annually.
Although unintentional injuries and deaths that occur in the home are generally believed to be preventable, there are no validated tools to identify and quantify residential injury hazards.
What this study adds
The HOME Injury Survey, a 55-item tool to quantify unintentional injury hazards in the indoor environment of homes with young children, was reliable, valid and replicable between different users and over time.
The HOME Injury Survey correlated with reported risk factors for childhood injury (externally valid) including maternal depressive symptoms, household income and maternal age.
Four high-risk, high-exposure rooms (kitchen, main activity room, child’s bathroom and child’s bedroom) identified by parents in previous reports were shown to be representative of similar injury hazards found throughout the entire household.
The density of unintentional injury-related hazards (number of hazards per area) was a more reliable and valid measure of childhood residential hazards than the total number of hazards.
REFERENCES
Supplementary materials
Web Only Data 15/5/300
Files in this Data Supplement:
Footnotes
Presented at the Pediatric Academic Society Meetings, Honolulu, Hawaii, 3 May 2008.
Funding KP was supported by 1K23HD045770-01A2 Career Development Award from the National Institute of Child Health and Development (NICHD). BL was supported by the National Institute of Environmental Health Sciences and US Environmental Protection Agency (PO1-ES11261) and the National Institutes for Environmental Health Sciences (R01ES014575).
Competing interests None.
Trial registration number: NIH Trial Registration (www.clinicaltrials.gov): NCT00129324.
Provenance and Peer review Not commissioned; externally peer reviewed.