Article Text

Abstract
Athletic injury risk in youth is known to be greater in organised sport, higher levels of competition, games, and tournaments, yet young athletes are often expected to participate in tournaments that involve multiple matches per day on consecutive days. In 2006 and 2008 injury rates were observed during a club youth soccer tournament that involved athletes aged 9–18 years playing three to four matches over two consecutive days, to determine if injury risk varied over the course of the event. The injury rate for day 1 was 7.91/1000 hours with a mean severity of 3.5 days missed versus a day 2 rate of 6.75 and severity of 2.3. The rate and severity for the first game in a day were 7.13 and 3.5 respectively compared to 7.9 and 2.5 for game 2. Further research is needed to determine if a high density match schedule increases injury risk for youth soccer players.
Statistics from Altmetric.com
Athletic participation can be an integral part of an overall healthy lifestyle for children and adolescents; however, it is also the leading cause of injury in this population.1
There appears to be an increasing number of youth participating in organised competitive sports more often than unstructured physical activities.2 Further, there is a growing number of children who specialise in a specific sport at an early age.2 These trends are of concern because the risk of youth injury increases with organised versus unorganised sport,1 while concentrating on a single sport could raise the risk of overuse injury due to repetition of sport-specific movements.
The role of fatigue in athletic injuries is unclear. An increased risk of injury may exist for those with lower fitness.1 More injuries occur in later periods in hockey and wrestling,34 but studies noting the timing of injuries within a soccer match are conflicting.5–11 In addition to mental and aerobic exhaustion, accumulated tissue fatigue may play a role. For example, it has been shown that higher pitch counts in a game or a season are associated with increased risk of elbow injury in young baseball players.12
Elite “club” or “travel” tournaments common to youth sports such as soccer, basketball, baseball, and softball often involve multiple games each day over two to three consecutive days. Such a setting could negatively affect participant health. It is known that injury risk is higher in competition versus training, tournament play versus regular season, and at higher levels of competition.1 Elite adult sports teams rarely subject their physically mature athletes to such an intense competition schedule yet it is expected of children and adolescents. To date there is no research examining the possibility of fatigue contributing to increased athletic injury risk in a youth tournament setting.13
The primary objective of this observational study was to compare injury rates between games and days during a club level youth soccer tournament setting. Secondary measures included injury type, location, mechanism and severity.
METHODS
Design
Observational study.
Population
The Twin City Classic club soccer tournament was held 19–20 August 2006 and 16–17 August 2008 in Winston-Salem, North Carolina. A total of 243 teams from the southeastern United States participated; all 3350 athletes were observed during the study. Age groups ranged from girls under 11 to under 18 and boys under 10 to under 15.
Data collection
An injury data collection form was developed following published consensus guidelines for studies of soccer injuries.14 A “medical attention” definition of injury was used and applied to any athlete presenting to a medical tent or requesting medical assessment on the field. The form was completed by an on-site physician or certified athletic trainer. Observations included athlete gender, age, injury timing by day (D1 vs D2) and game (G1 vs G2), injury type and location, history of previous injury at the involved location, wet bulb globe temperature (WBGT) in degrees Fahrenheit within one hour of injury, and the athlete’s subjective estimate of participation in the previous game and on the previous day. Injury severity (S) was measured by actual or estimated days the athlete was unable to participate.
Statistics
Data were managed and analysed using Excel 2007 and SAS V.9.1. Rate of injury (R) was calculated as the number of injuries per 1000 match hours. Exposure totals were calculated by multiplying the number of players on the field by game length by the number of games for each age group. A two-sample inference test for incidence-rate data was used to compare rates between different exposure groups. Mean estimated time lost was assessed for statistically significant differences using the two-sample t test.
RESULTS
Overall
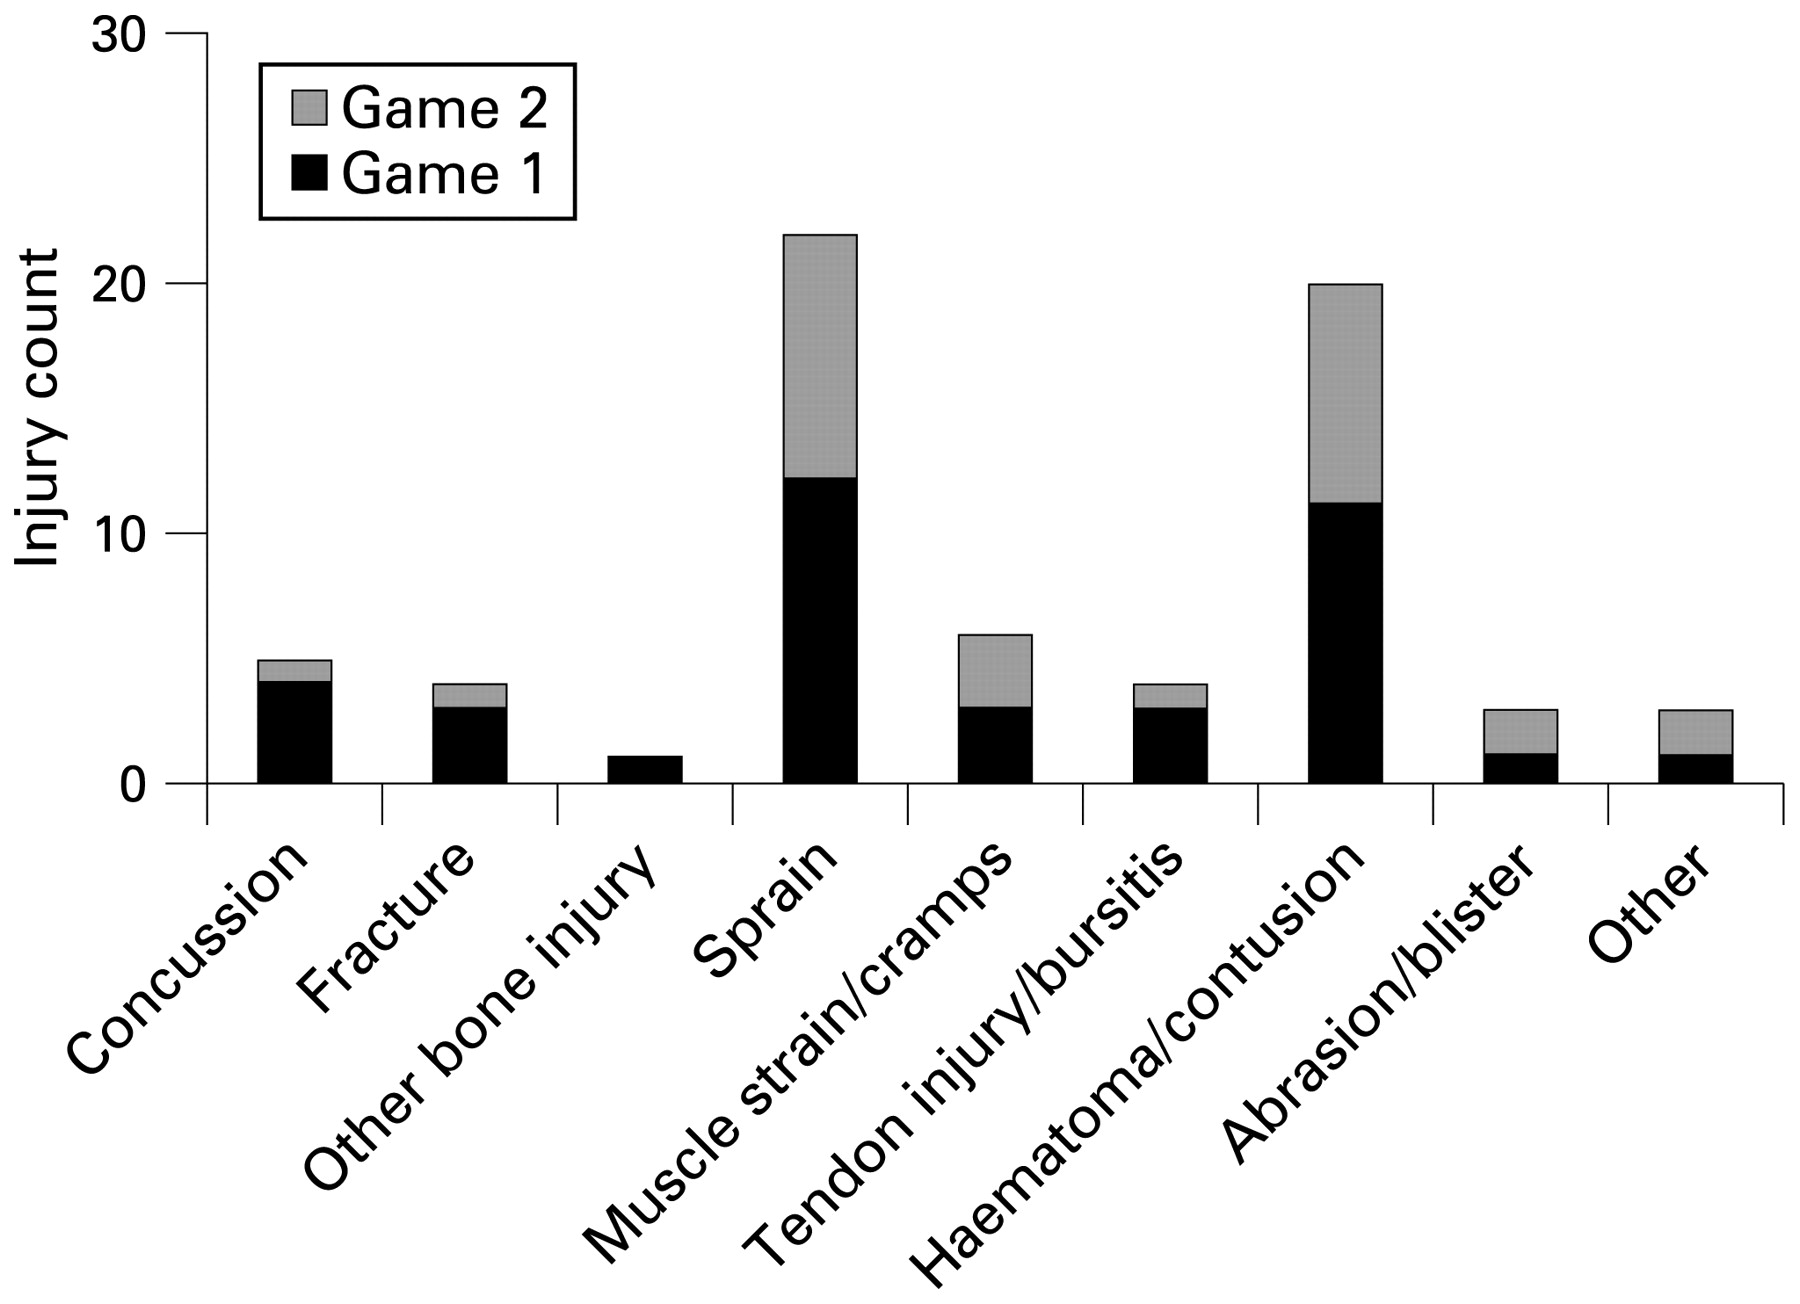
Sixty-eight injuries were observed during the two tournaments. The overall injury rate was 7.44; overall injury severity was 3.1. Sprain was the most common injury type (n = 22) followed by contusion (n = 20); ankle (n = 15) was the most frequently injured body area followed by knee (n = 12).
Day and game comparison
There were no differences in injury rate or severity when comparing D1 and D2. Injury rate and severity were also similar for G1 versus G2. These injury rate similarities remained even when removing injuries that did not cause any days to be missed. Tables 1 and 2 summarise injury rate relative risk estimates and severity results overall and by gender and age group for days and games. Boys were statistically more likely (relative risk (RR) = 2.82, 95% CI = 1.06 to 7.48) to be injured on D1 (R = 9.81) than D2 (R = 3.48). Injuries in girls were statistically more severe (p<0.05) in G1 (S = 6.5) than G2 (S = 1.0). Athletes older than 14 had statistically more severe (p<0.05) injuries in G1 (S = 7.2) than G2 (S = 0.9).
Sprains occurred at a similar frequency by day (D1 = 12, D2 = 10) and game (G1 = 12, G2 = 10). There were 13 contusions on D1 versus 7 on D2 and 11 during G1 versus 9 in G2. Nine of the 12 total knee injuries occurred on D1 and during G1. Ankle injuries were similar by day (D1 = 7, D2 = 8) and game (G1 = 8, G2 = 7). Figures 1–4 show the complete overall injury distribution by injury type and body area, including comparison of D1 vs D2 and G1 vs G2.
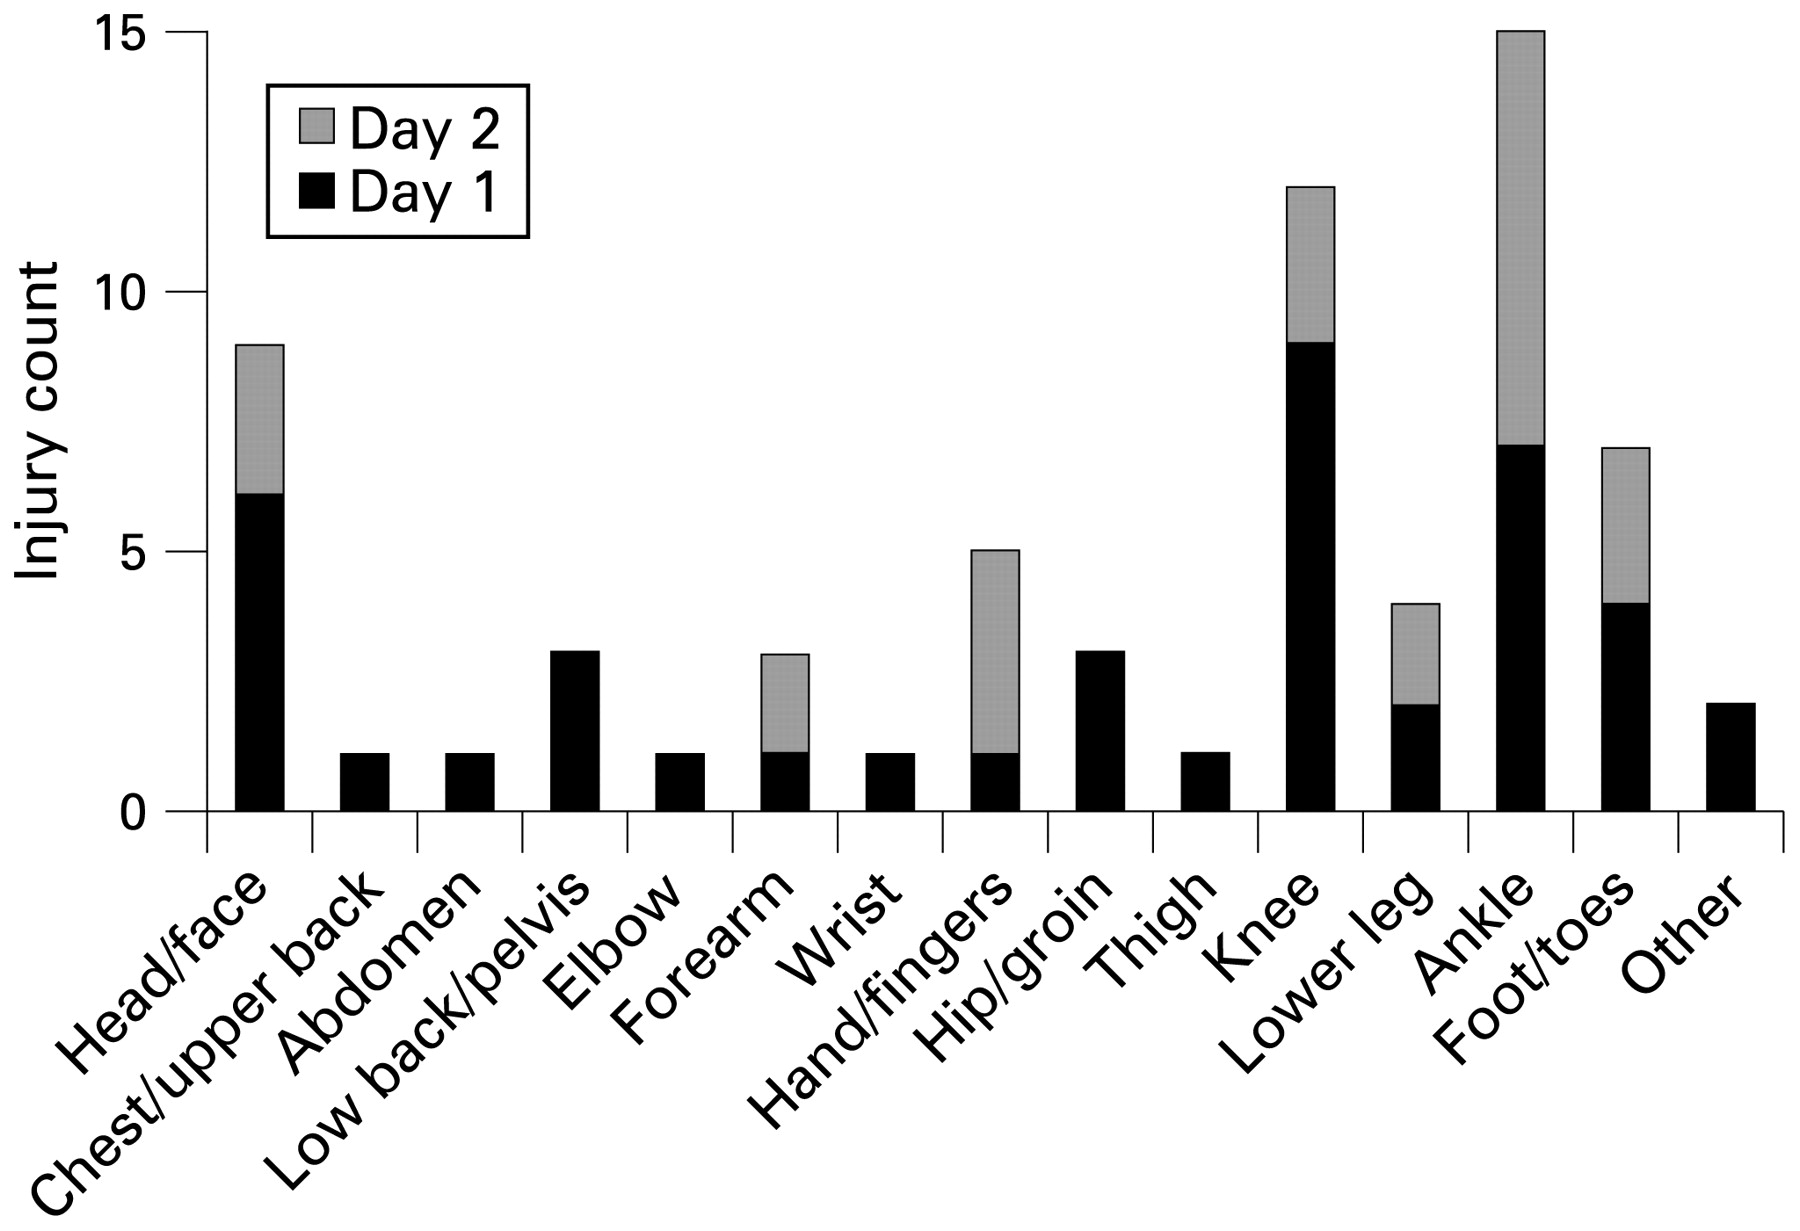
Injury distribution by body area for day 1 vs day 2.

Injury distribution by body area for game 1 vs game 2.
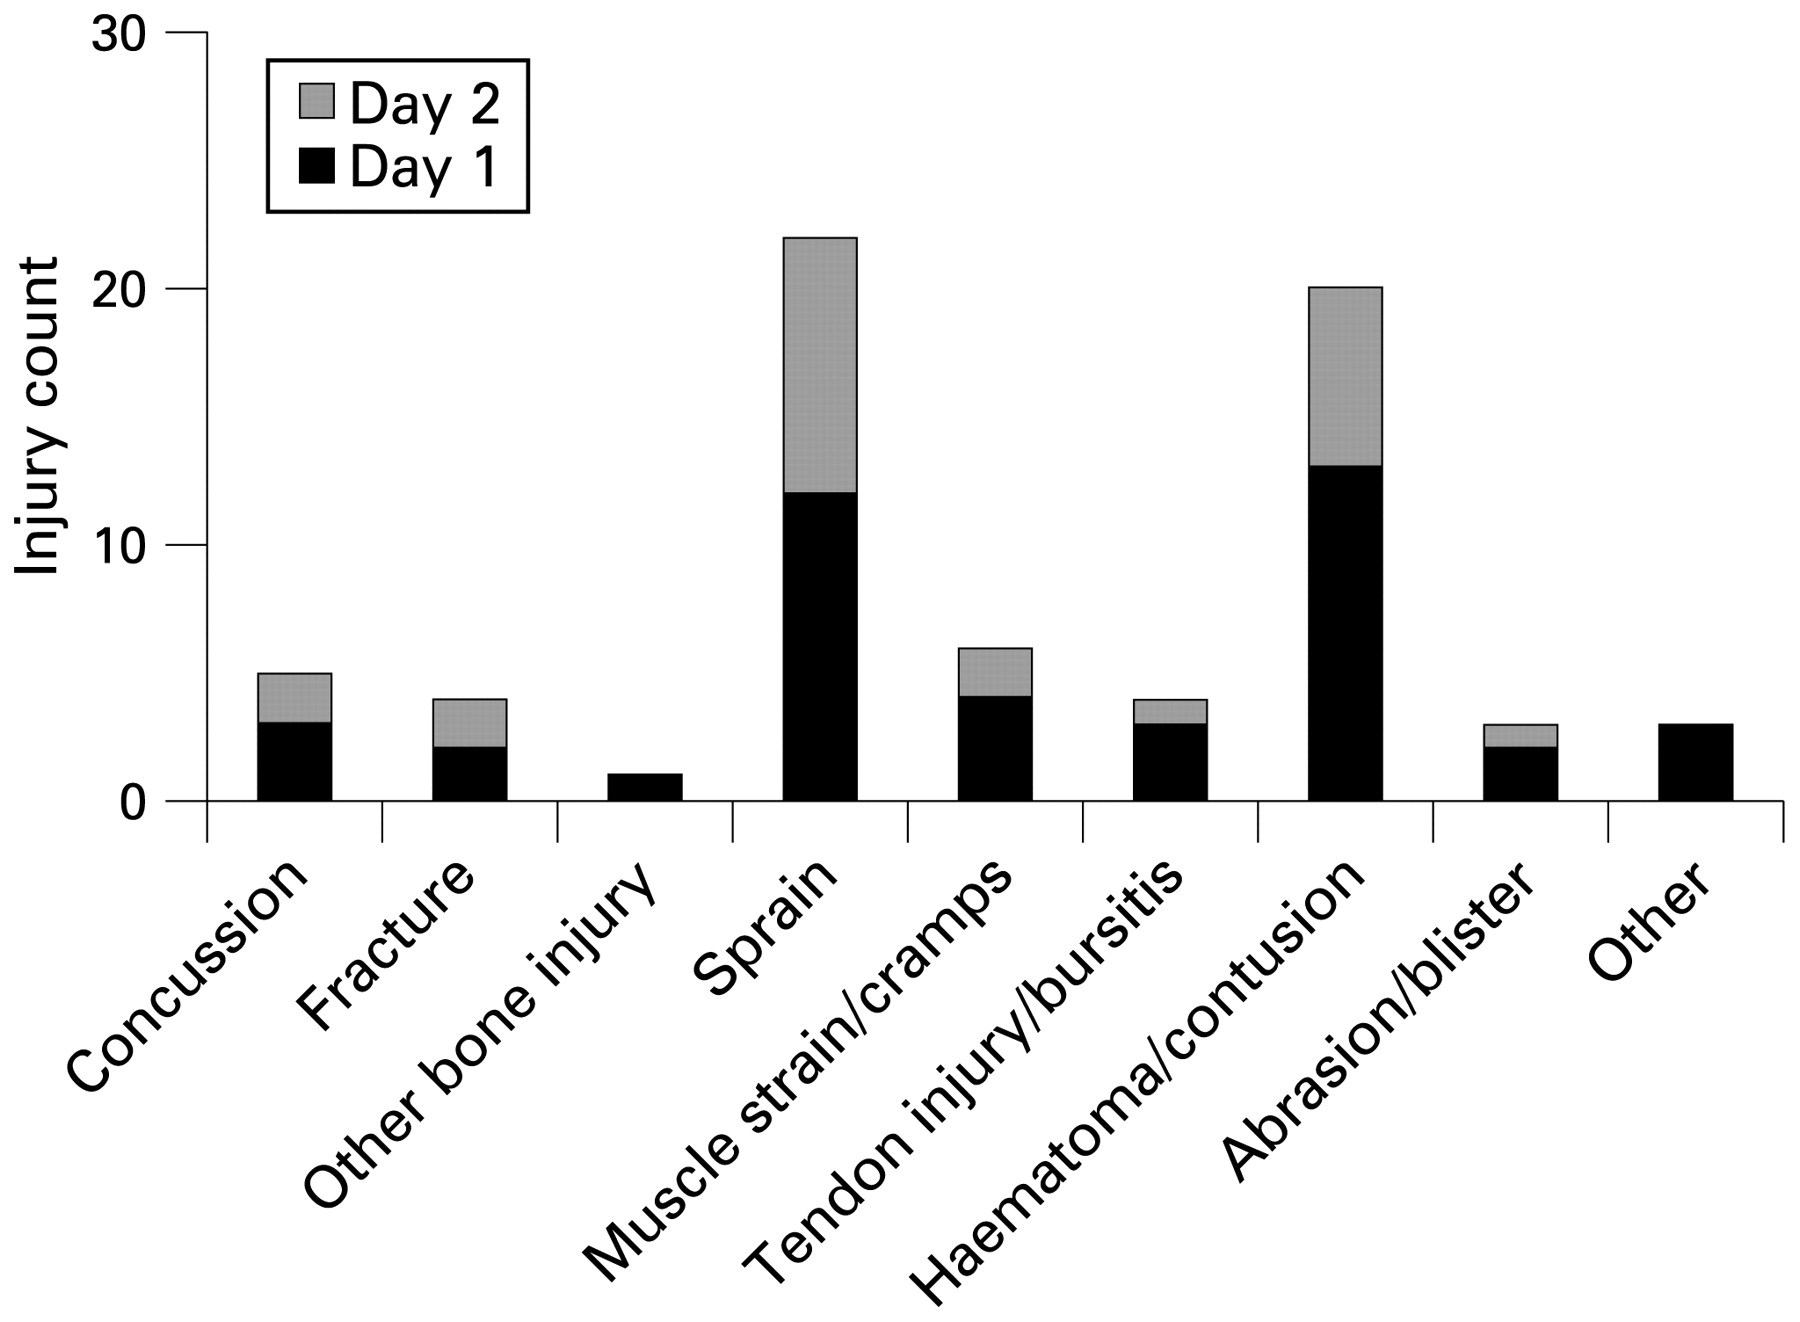
Injury distribution by type area for day 1 vs day 2.

Injury distribution by type for game 1 vs game 2.
A similar percentage of injuries by day (D1 = 88.4%, D2 = 92.0%) and game (G1 = 87.2%, G2 = 93.1%) resulted from acute trauma. A similar percentage of injuries by day (D1 = 25.6%, D2 = 28.0%) and game (G1 = 23.1%, G2 = 31.0%) had a history of previous injury at the same area.
All of the D2 injuries estimated playing in over 50% of possible game time on D1. Of the 28 G2 injuries, all but two reported that they had played in at least 50% or more of G1 that day. The mean WBGT for D1 injuries was 78.9 versus 76.1 for D2, while mean WBGT for G1 injuries was 76.1 versus 80.4 for G2. G2 injuries actually had more time between games (4.9 hours) than the overall average break between games (4.7 hours).
DISCUSSION
Game and day comparison
Our findings show that high density match scheduling may not necessarily predispose young soccer players to acute injury. In an observational study of professional soccer games, Rahnama et al observed that more actions with injury potential occurred in the first half.10 Perhaps when soccer players have more energy earlier in a match or tournament they are more likely to attempt to contest possession, resulting in increased frequency of contact with opposing players. They may also move with greater intensity, leading to higher velocity collisions. There is evidence that children may simply be more resistant to fatigue during repeated high intensity bouts of exercise and able to recover more quickly.15 Warm-up protocols performed prior to physical activity have been shown to decrease injury risk in some studies.1617 The soft tissues and neuromuscular coordination systems of the study athletes may have been better primed as a result of earlier competition, making injury later in the day or tournament less likely.
Strengths
To the best of our knowledge, this is the first study examining the impact of high density match scheduling on injury risk in a youth tournament setting. We attempted to account for potential confounding factors such as amount of recent participation, time between games, and temperature. The methods used in our study follow consensus guidelines for injury definition and data collection, allowing the results to be compared to current and future research into soccer injuries.
Limitations
The primary limitation of this study is the relatively small number of injuries observed which limits statistical power. Additionally, while efforts were made to control for factors that could have affected injury risk between different games and days there were many variables that were not accounted for: variations in travel prior to the event, the amount or quality of warm-up activities, nutrition and hydration habits, amount of physical activity outside of games, coaching methods, and physical fitness. Using a medical attention definition of injury during a short research time frame may have caused some overuse or initially minor injuries to be missed if parents and athletes did not deem them significant enough to warrant medical attention until after the study period. It is also possible that some injuries may have been assessed and managed by healthcare providers associated with individual teams and so never presented to the tournament medical staff.
What is already known on this topic
Injury risk in youth sports increases with increased organisation, skill level, and relative importance of competition.
An increased risk of injury may exist in youth sports for those with less endurance and lower fitness/conditioning levels and also those with greater cumulative sport exposure.
Youth and adult study results are mixed as to whether injury rates are highest earlier or later during the course of a single sports contest while studies of injury risk over the course of a multi-day youth athletic tournament are lacking.
What this study adds
Overall there was no significant difference seen in injury rates and severity between the first and second day of the tournament or between the first and second games played each day.
Significantly more injuries in boys were actually observed on the first day of a weekend youth club soccer tournament.
Injuries that occurred during the first game of the day were higher in severity in girls and those over 14 years old.
More emphasis may need to be placed on proper warm-up activities in order to decrease injury rates in a two-day youth soccer tournament setting.
Conclusion
In conclusion, there were no differences in overall injury rate and severity between consecutive days and games during a youth soccer tournament. Boys did have a higher rate on D1 while girls and older athletes showed greater severity in G1. This raises the possibility that high density match scheduling of youth sports tournaments and possible associated fatigue may not necessarily increase injury risk above that of isolated matches. Additional studies of longer duration and larger sample size are needed to examine this issue further.
Acknowledgments
The authors wish to thank the Twin City Youth Soccer Association for its cooperation with this project.
REFERENCES
Footnotes
Competing interests: None.
Contributors: The following contributed to the project: DA Rosenbaum (study conception, study design, data collection and analysis, manuscript creation); ML Silvis (study design, data collection and analysis, manuscript creation); JE Williams (study design, data analysis, manuscript revision); SW Davis (data analysis, manuscript revision); H Thornton, D Comeau, C Miles, S Clarke and S Garner (data collection).
Ethics approval: Ethics approval was obtained.