Article Text

Abstract
Objective: To analyse the relationships between factors related to school location and motor vehicle versus child pedestrian collisions.
Methods: Data on all police-reported motor vehicle collisions involving pedestrians less than 18 years of age that occurred in Toronto, Canada, between 2000 and 2005 were analysed. Geographic information systems (GIS) software was used to assess the distance of each collision relative to school location. The relationships between distance from school and collision-related factors such as temporal patterns of school travel times and crossing locations were analysed.
Results: Study data showed a total of 2717 motor vehicle versus child (<18) pedestrian collisions. The area density of collisions (collisions/area), particularly fatal collisions, was highest in school zones and decreased as distance from schools increased. The highest proportion of collisions (37.3%) occurred among 10–14-year-olds. Within school zones, collisions were more likely to occur among 5–9-year-old children as they travelled to and from school during months when school was in session. Most collisions within school zones occurred at midblock locations versus intersections.
Conclusions: Focusing interventions around schools with attention to age, travel times, and crossing location will reduce the burden of injury in children. Future studies that take into account traffic and pedestrian volume surrounding schools would be useful for prevention efforts as well as for promotion of walking. These results will help identify priorities and emphasise the importance of considering spatial and temporal patterns in child pedestrian research.
Statistics from Altmetric.com
Pedestrian injuries are a leading cause of injury and death in children.1 Between 1992 and 2001, 827 Canadian children under the age of 19 were killed in motor vehicle versus pedestrian collisions, accounting for 19.8% of Canadian motor vehicle-related fatalities in all age groups.2 In 2006, 524 children in Toronto were involved in motor vehicle versus pedestrian collisions, of which six resulted in a fatality.3
Research in the area of paediatric pedestrian motor vehicle crashes has focused on risk factors in urban environments that increase the risk of injury. Higher population density,145 increased traffic volume,15–7 and rush hour times18 have been reported to amplify the risk of injury for children. Furthermore, studies on specific age categories have found an increased risk of collisions for 5–9-year-olds at midblock locations,910 during daylight hours.10 There is an increased risk for 10–14-year-olds at intersections, at night.9 The highest sources of risk to child pedestrians are teenage drivers11 and drivers with a history of infractions.12
Schools are a focal point of a child’s daily activity and a number of studies have investigated the relationships between factors associated with schools and child pedestrian collisions.14513 School travel times,113 season,513 school neighbourhood characteristics,4 spatial arrangement4 and number of schools in an area5 have all been associated with collisions near schools. Environmental modification in the areas surrounding schools is a new method being used to prevent collisions, as there has been inconsistent success of pedestrian safety educational programmes.14–17 Parents restrict their children’s independence in the interest of safety. With decreases in risk of injury from motor vehicle collisions and increased convenience of walking and cycling routes, parents are more likely to let their children walk and play.18
School zones should be safe places for children to walk during school travel times. Geographic information systems (GIS) can be used to further describe the spatial distributions of child pedestrian collisions surrounding schools.1589 GIS allow for novel analyses of these data where emerging trends can be elucidated for use in pedestrian injury prevention programmes. The objective of this study was to analyse motor vehicle versus pedestrian collisions involving children in Toronto by time and location, with a focus on the unique contribution of schools.
METHODS
Pedestrian collision data were acquired from the City of Toronto’s Traffic Data Centre and Safety Bureau. All police-reported motor vehicle collisions involving pedestrians with a recorded age less than 18 years that occurred in Toronto, Canada between 1 January 2000 and 31 December 2005 were included in this study.
A list of all 1050 schools registered in Metropolitan Toronto was provided by the Toronto District School Board (TDSB).19 For the purposes of this study, schools servicing individuals over age 17 (ie, universities/colleges) and other programmes which were likely not accessed via walking (eg, resource centres for the people with physical disabilities), were excluded. All other public and private schools were included in the analysis (n = 956).
GIS software (ArcGIS)20 was used to develop boundaries around each of the schools. A school zone is a 150 metre radius around a school as defined by Toronto Transport Operations. For the purpose of this study, zones were created around the schools at distances of 150, 150–300, 300–450 and >450 metres. ArcGIS was used to determine the frequency of collisions around schools in each zone, and to calculate the area of Toronto and the area covered by the zones. These data were used to compute the area density of the total number of collisions and fatal collisions within each zone.
The ages of child pedestrians were categorised as follows: 0–4, 5–9, 10–14 and 15–17 years. School travel times are defined as 07:00–09:00, 12:00–13:00 and 15:00–17:00. Crossing locations included midblock and intersections. Midblock is defined as any pedestrian crossing location not at an intersection of two roads. The relationship between the distance from school (0–150 m; 150–300 m; 300–450 m; >450 m) and collision-related factors such as temporal patterns and crossing location were analysed using SPSS V.15.21 Frequency and percentage of collisions were calculated and χ2 tests were used to compare the distribution of the characteristics within each zone.
RESULTS
There were a total of 2717 collisions in Toronto between 2000 and 2005 involving children under the age of 18. The density of collisions, particularly fatal collisions, was highest in school zones and fell with increasing distance from schools (table 1).
Although only 23.4% of collisions occurred within 150 m of a school, the risk ratio of a collision within the 150 m school zone was 5.7 compared to the largest zone (>450 m). The relative risk of a fatal collision within the 150 m school zone was 9.4 compared to the >451 m zone. Figure 1 shows collision location according to zone.
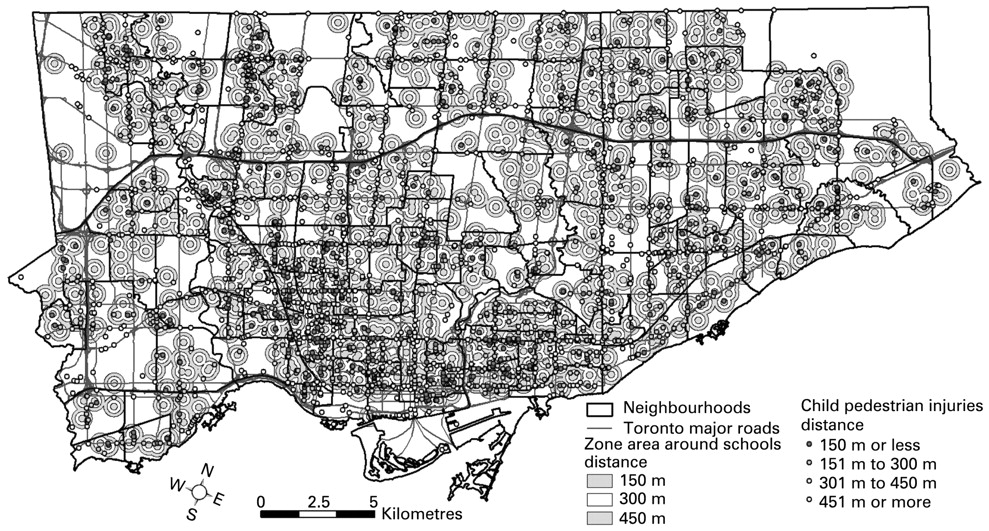
Child pedestrian–vehicular collisions in school zones. Source: City of Toronto, Community and Neighbourhood Services; City of Toronto, Transportation Services, Traffic Data Centre and Safety Bureau; and Toronto District School Board. Projection: Universal Transverse Mercater UTM Zone 17N.
The largest proportion of collisions was in the 10–14 year age group (37.3%) followed by the 15–17-year-olds (28.6%), the 5–9-year-olds (22.8%) and the 0–4-year-olds (11.3%). Figures 2 and 3 show the temporal patterns in pedestrian collisions for children under age 18. Almost 50% of collisions occurred over the hours defined as school travel times (07:00–09:00, 12:00–13:00 and 15:00–17:00). When considering the rate per hour, this translates into 254 collisions per school travel hours (1270 collisions/5 hours), versus 76 collisions per non-school travel hours (1447 collisions/19 hours); a 3.3 times greater rate per hour during school travel time. Higher numbers of child pedestrian collisions occurred during the school year (from September to June), with a drop in the summer (July and August). There were also fewer collisions during the winter months.
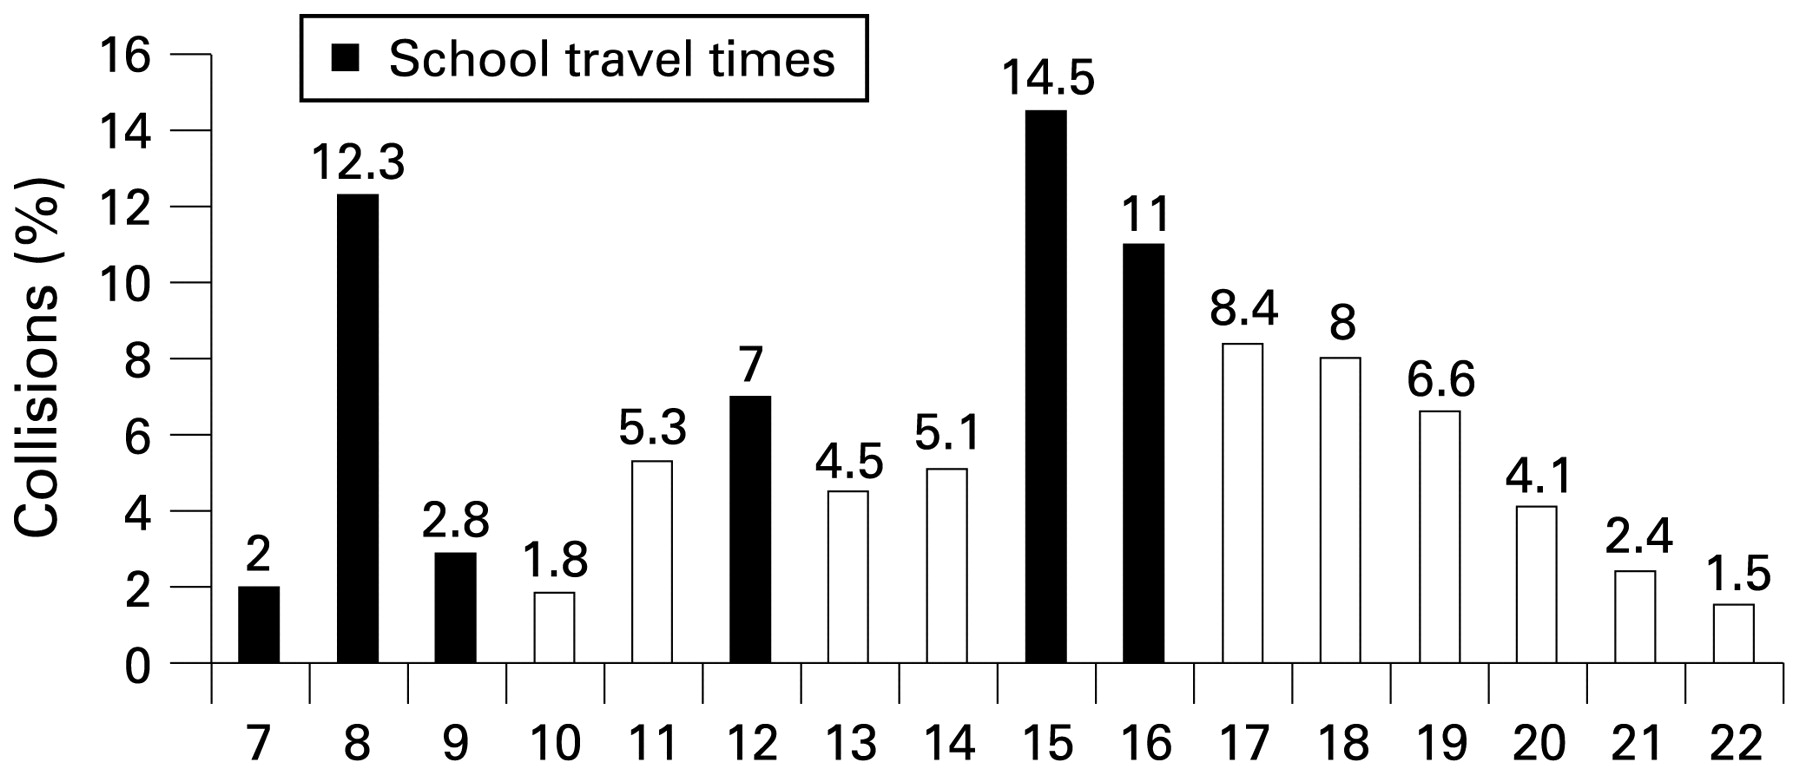
Proportion of child pedestrian–vehicular collisions by hour.

Proportion of child pedestrian–vehicular collisions by month.
Table 2 shows the number of collisions in each zone by age, time and location of the collision. The age distribution of children injured varied across zones. In 5–9 and 10–14-year-olds, the proportion of collisions was highest in the areas closer to schools. Conversely, in the 15–17-year-old age category, the proportion of collisions was highest at further distances from school. The number of collisions during school travel times was significantly higher closer to schools. Also, a higher proportion of midblock (versus intersection) collisions occurred closer to schools.
DISCUSSION
There are only a few studies that have focused specifically on the relationship between school-related factors and motor vehicle versus child pedestrian collisions. We present temporal and geographically based relationships between schools and child pedestrian collisions. Schools are a focal point in a child’s life and the areas surrounding schools are associated with distinctive patterns of movement for child pedestrians that require unique safety precautions.4
School zones, which were found to be less than 10% of the surface area of the city, had a much higher absolute risk of child pedestrian collisions than other areas. The absolute density of injuries and fatalities were 5.7 and 9.4 times higher in the school zones compared to the largest zone (>451 m). Motor vehicle versus child pedestrian collisions occurred more frequently during hours and months of travel to and from school. The rate of collisions per school travel hour was three times the rate of collisions at other times. Similar findings are reported in the literature and provide a clear opportunity for safety interventions.16 School travel is a clear risk for injury and school-based interventions are required.
Findings of increased pedestrian motor-vehicle collisions among middle school aged children are also consistent with the literature.510 The proportion of collisions rose with proximity to schools in 5–9-year-olds, remained the same for 10–14-year-olds, and decreased with proximity to schools in the 15–17-year-olds. One possible explanation is that middle school aged children may be walking to school with less parental supervision, but do not yet have the road crossing skills of older students (aged >10 years).2223 Another possible explanation is that drivers may react differently to children aged 5–9 than middle school aged children.24 The higher proportion of collisions further away from schools for older students may reflect further travel distances to school and less crossing controls (eg, school crossing guards) outside of school zones.25
Interestingly, the proportion of collisions that occurred at midblock locations increased with proximity to schools. Most school crossing guards are currently placed at intersections, but there may be a need for additional midblock strategies around schools such as plants, fencing, and islands or crosswalks which have been shown to effectively decrease collisions.1415 This suggests that more research should be focused on crossing locations around schools.
A limitation of the current study is that no exposure data were available. It is highly likely that the greater number of pedestrian collisions near schools is reflective of a greater number of children walking. However, the pedestrian “safety in numbers” phenomenon previously reported, which states that a motorist is less likely to collide with a pedestrian if more people walk or bicycle in that area, does not seem to compensate for the presumed increased exposure.26 More importantly, it is appropriate to target intervention programmes according to absolute burden of pedestrian collisions.1
Many other factors may also be related to child pedestrian collisions that were not included in these analyses. These include neighbourhood factors such as socioeconomic status, housing density and traffic patterns. An ecological analysis of neighbourhood variables is neither straightforward nor easily interpretable. Detailed exposure data are required to link the individual level injury/fatality counts to the ecological neighbourhood data. Continued work is being done to incorporate these issues into geographical analysis related to child pedestrian injury.
Finally, another limitation of the study is that data were obtained from police records which are known to underreport injuries.27–29 Police records have been shown to report only 83% of the total number of injuries accounted for by health authorities.27 The results of this study are likely to be a conservative estimate of the true magnitude of the problem.
Ongoing discussion around the tradeoffs concerning physical activity benefits and the intensified risk of exposure to injury has incited debate regarding school safety.30–33 The number of children who regularly walk to school has been steadily decreasing and this decline has been concurrent with an increase in childhood obesity.32 In 1969, 42% of students walked to school, while in 2001 only 16% walked.28 In fact, many parents are unwilling to allow their children to walk to school because of fear of injury or harm. If the risks involved in travel to school were minimised, more parents would be inclined to allow their children to walk. Several European locations have been able to increase the overall physical activity of children on the route to and from school and achieve a decrease in injury occurrence by implementing traffic or environmental engineering techniques.3032 It may be time for Toronto and other North American cities to take a hard look into these interventions for the safety and wellbeing of our youth.
School travel is important as all children venture to school around the same peak times with the same destination every weekday. School travel provides an excellent opportunity for intervention as regular journey patterns to school are easy to target and encompass the vast majority of children. Students provide a well-defined target audience over which it is possible to exert a significant influence on injury rates. School zones comprise under 10% of the surface area of Toronto and given the high absolute and relative burden of child pedestrian injuries they are appropriate targets for environmental and enforcement programmes aimed at preventing both midblock and intersection events. The best evidence regarding prevention of child pedestrian injuries suggests modifications to the build environment as the most proven intervention.34–36 Although some interventions (eg, reduced speed zones) are already present in Toronto school zones, the fact that the child pedestrian problem is not solved in these specific areas indicates that more attention to environmental modification is needed. Future studies that take into account traffic and pedestrian volume surrounding schools would be useful for prevention efforts as well as for promotion of walking. Focusing interventions around schools with attention to travel times, school session, crossing controls and environmental modifications could significantly reduce the burden of injury in children. These results can help identify priorities and emphasise the importance of considering spatial and temporal patterns in pedestrian research.
What is already known on this topic
Motor vehicle collisions with children are a leading cause of injury and death in children.
Schools are a focal point of a child’s daily activity; studies have found that school travel times, seasonality, school neighbourhood characteristics, spatial arrangement and number of schools in an area are associated with collisions near schools.
What this study adds
School students provide a well-defined target audience over which it is possible to exert a significant influence on reducing injury rates.
School zones had a much higher absolute risk of child pedestrian collisions than other areas.
The proportion of collisions that occurred at midblock locations increased with proximity to schools.
Acknowledgments
The authors would like to thank the City of Toronto Traffic Management Centre, for providing data. Joel Warsh accepts full responsibility for the work, had access to the data, and controlled the decision to publish
Each of the authors has met the criteria for authorship. In particular, Joel Warsh contributed to the study design, analysis and drafting of the paper. Morgan Slater and Linda Rothman contributed to the conceptual framework, study design, acquisition, analysis and interpretation of the data and drafting and critical revision of the manuscript. Craig Steverango contributed to the acquisition, interpretation and analyses of the data and portions of the critical revision of the article. Andrew Howard conceived the study and contributed to the study design, analysis and interpretation of the data, and drafting and critical revision of the manuscript. All of the authors approved the final version of the manuscript.
REFERENCES
Footnotes
Competing interests: None.
Funding: This research was funded by a Canadian Institutes of Health Research (CIHR) Team Grant and by AUTO21.