Article Text

Abstract
Background: The scale of road traffic injuries (RTIs) in India is uncertain because of limitations in the availability and reliability of incidence data.
Objective: To report these data for Hyderabad city in southern India.
Methods: In a cross-sectional population-based survey, 10 459 participants aged 5–49 years (94.3% participation), selected using three-stage systematic cluster sampling, were interviewed. Participants recalled RTIs in the preceding 3 months and RTI-related death and disability in the household in the preceding 3 years. RTI was defined as an injury resulting from a road traffic crash irrespective of the severity.
Results: The age/sex-adjusted annual incidence of non-fatal RTI requiring a recovery period of ⩽7, 8–29, and ⩾30 days was 13% (95% CI 12.6% to 13.4%), 5.8% (95% CI 5.5% to 6.0%), and 1.2% (95% CI 1.1% to 1.4%), respectively. The overall adjusted rate for non-fatal RTI was 20.7% (95% CI 20.0% to 21.3%). The relative risk of RTI requiring a recovery period of >7 days was significantly higher in the third per capita monthly income quartile (1.24 (95% CI 1.12 to 1.37); p<0.05). The incidence of non-fatal RTI was highest in pedestrians, motorized two-wheeled vehicle users, and cyclists: 6.4, 6.3, and 5.1/100 persons/year, respectively. Annual RTI mortality and disability rates were 38.2 (95% CI 17.5 to 58.8) and 35.1 (95% CI 12.4 to 57.7) per 100 000 population, respectively.
Conclusions: There is a high burden of RTI in this urban population. With the recent attention focused on RTI by the Government of India, these findings may assist in planning appropriate initiatives to reduce the RTI burden.
Statistics from Altmetric.com
Road traffic injuries (RTIs) constitute a major global public health problem.12 Globally, RTI fatalities are projected to increase by 66% between the years 2000 and 2020, with South Asia estimated to record the largest increase, and will be the third leading cause of death.3 With incomplete, few, or no data available from countries with the highest RTI mortality, there is also a suggestion that the present global RTI burden is underestimated.14
The Global Burden of Disease (GBD) Study has estimated an annual RTI mortality of 20.9/100 000 population for all ages for India in 2002; these are only projected estimates because of incomplete death registration in India.5 Although RTI fatalities are predicted to increase by 2.5 times in India by the year 2020,3 RTI is not yet considered a serious public health issue by policy makers in India.67 A major reason for this lack of appropriate policy and intervention response by policy makers is the non-availability of robust and comprehensive RTI data that can highlight the magnitude of RTI burden.6
A detailed assessment of the risk factors for RTI in the general population is needed to plan informed RTI prevention strategies. We conducted a population-based study to elucidate the incidence, risk factors, and outcome of RTI in the Indian city of Hyderabad. In this paper, we report RTI incidence and burden of RTI in this urban population in India.
METHODS
This study was approved by the ethics committee of the Administrative Staff College of India, Hyderabad, India.
Hyderabad city in Andhra Pradesh state of India has a population of 3.8 million excluding the surrounding areas that make up Hyderabad agglomeration.8 Hyderabad had 1.2 million registered motor vehicles in 2001–2002, the majority being motorized two-wheeled vehicles (77%), followed by cars (11%), and the rest were other types of motor vehicle, including motorized three-wheeled vehicles, buses, trucks, and vans.9
The study population was selected using a three-stage systematic cluster sampling procedure with equal probability of selection. On the basis of census data,10 we divided Hyderabad into 2542 clusters of mostly 1400–1600 population and listed in sequence. We then selected 50 clusters starting with a random cluster, and then every 51st cluster was chosen to obtain 50 clusters. These clusters were plotted on the Hyderabad map, and each cluster was visited by the study team to broadly understand the socioeconomic profile. Through discussions with personnel of the Revenue Department, Municipal Corporation of Hyderabad, it was estimated that 20% of Hyderabad’s population belonged to the upper socioeconomic strata, 50% to the middle, and 30% to the lower. In order to maintain a similar socioeconomic profile in the study sample, three lower socioeconomic status clusters from the original sample were replaced by two middle and one upper socioeconomic status clusters adjacent to them in their census wards. We also selected one cluster of 49 homeless people to represent this group of the population.11
Within each cluster (other than the homeless cluster), we enumerated the households and residents starting from the north-east corner of the cluster and ending in the south-west corner. A household was defined as persons eating from the same kitchen. Visitors, hostels, hotels, commercial establishments, and prisons were not included. All residents 5–49 years of age in the selected clusters were considered eligible. Systematic sampling, with the first number drawn randomly, was carried out to sample households, with the aim of sampling 215–225 eligible people in each cluster. This usually required a sampling interval of five to eight households depending on the total number of households and the eligible population in a cluster. All residents 5–49 years of age in the selected households formed the study population.
At the time of planning of this study, the most recent RTI fatalities data available from the Government of India were for the year 2001.12 Using these data and assuming the number of people with non-fatal RTI to be 20–50 times those with fatal RTI, an annual RTI incidence of 0.16–0.39% was estimated for India’s population.8 In order to obtain data on RTI for the preceding 3 years in the study, the RTI incidence over 3 years was estimated as 0.81% for Hyderabad (assuming an average annual incidence of 0.27%). Using Poisson distribution and assuming a design effect (DE) of 1.5 due to cluster sampling strategy,13 a sample size of 9000 people aged 5–49 years was estimated such that RTI incidence estimates over 3 years would be 0.59–1.02% at the 95% confidence level. Assuming an 5% participation rate, we aimed to sample 10 600 people aged 5–49 years.
Interview
Data were collected from October 2005 to December 2006. Trained interviewers obtained written informed consent from eligible people for participation in the study (from the parent/guardian for those aged 5–15 years), followed by confidential interview using a questionnaire designed for this study. The questionnaire was developed by the study team through review of worldwide literature and focus group discussions with randomly selected members of the population. It was developed in English, translated into Telugu and Hindi (the two local languages), after which it was back-translated into English to ensure the accurate and relevant meaning and intent of the questions. Pilot testing of the questionnaire was carried out, and modifications made as necessary.
Detailed demographic data were obtained for all participants aged 5–49 years (information collected from parent/guardian for participants <11 years of age, and in the presence of parent/guardian for those aged 11–15 years). The participants were asked to recall if they had been involved in a road traffic crash (RTC) at different time periods (the preceding 3 and 12 months) resulting in an injury irrespective of the severity. Detailed data, including duration of the RTI, vehicles involved, and days of recovery/disability, were documented. If a participant reported more than one RTI during the recall periods, all RTIs were documented. For participants with RTI-related disability in the preceding 3 years, data on RTIs that resulted in disability were also obtained. Data on death of a household member in the preceding 3 years due to RTI were documented by interviewing the head/woman of the household, who also provided data on the household income.
Definition of RTI
RTI was defined as any injury resulting from an RTC irrespective of severity and outcome. RTC was explained to the respondent as any crash on a road involving at least one moving vehicle irrespective of it resulting in an injury. This could include collision with a vehicle or any non-moving object while driving/riding a vehicle, skidding/slipping/overturning of a moving vehicle while driving/riding a vehicle, collision with a moving vehicle while walking/running/standing/sitting on a road, or falling from a moving vehicle. These explanations were given to each participant before questions on RTC and RTI were asked.
Data management and statistical analysis
Data were entered into an MS Access database, and data entered by one data entry operator were checked by another. SPSS was used for statistical analysis. Annual non-fatal RTI rates were calculated using a 3-month recall period for overall non-fatal RTIs and for RTIs requiring a recovery period of ⩽7, 8–29, and ⩾30 days. For this analysis, recovery period was defined as days taken to return to the normal daily activities carried out before the RTI. For participants who were still recovering at the time of interview and those who had not recovered, recovery period was taken to be the length of time since sustaining the RTI. Annual incidence rates for non-fatal RTIs for which medical treatment outside the home was sought as an outpatient (excluding self-medication through purchase of medicines from a pharmacy) or as an inpatient are also presented. Relative risk of non-fatal RTI is presented, and estimates for non-fatal RTI burden for Hyderabad were calculated using the incidence rates from this study. Categories of type of road user included pedestrian, cyclist, and user of motorized two-wheeled vehicle (MTV), motorized three-wheeled vehicle (commercial passenger vehicles: auto-rickshaw and seven-seater), car/jeep, or other vehicle (bus/truck/lorry).
Annual RTI mortality and disability rates per 100 000 population for the 5–49-year age group based on deaths and disabilities reported in the preceding 3 years are presented. Annual RTI incidence rates were adjusted for the age and sex distribution of the Hyderabad population, and the 95% CI included the DE for the cluster sampling strategy.14 The incidence rates were not adjusted for exposure. Per capita monthly income (PCMI) was considered in four quartiles based on the distribution in the study population. χ2 and one-tailed tests for significance are reported where appropriate.
RESULTS
Of the 11 097 eligible participants, 10 459 (94.3%) participated, 447 (4%) were not available/could not be contacted for interview, and 191 (1.7%) refused to participate. Of the participants, 5376 (51.4%) were male. The participation rate was 93.1% and 95.5% for males and females, respectively.
Annual non-fatal RTI incidence
During the preceding 3 months, 536 non-fatal RTIs were reported by 520 participants. The overall age/sex-adjusted incidence of non-fatal RTIs was 20.7% (95% CI 20.0% to 21.3%; DE 2.24)/100 persons/year. The adjusted incidence of RTI requiring a recovery period of ⩽7 days, 8–29 days, and ⩾30 days was 13.0% (95% CI 12.6% to 13.4%; DE 1.70), 5.8% (95% CI 5.5% to 6.0%; DE 1.25), and 1.2% (95% CI 1.1% to 1.4%; DE 1.36), respectively (table 1). The overall incidence of non-fatal RTI peaked in the15–19-year age group (table 1). The incidence of an RTI requiring a recovery period of ⩽7 or 8–29 days in males was two or more times that in females; however, the incidence of RTI requiring a recovery period of ⩾30 days in females was nearly twice that in males (table 1). The incidence of RTI requiring a recovery period of ⩽7 days or 8–29 days was lowest in the first PCMI quartile and fairly similar for the other three PCMI quartiles. The incidence of RTI requiring a recovery period of ⩾30 days was highest in the third PCMI quartile, nearly 2.5 and 4 times that in the first and last quartiles, respectively (table 1). The decline in RTI incidence from the 3-month to the 12-month recall period was 44.9%.
Data on treatment were available for 520 (97%) of the non-fatal RTIs in the preceding 3 months. Of these 520 non-fatal RTI, medical treatment outside the home was sought for 274 (52.7%) RTIs, of which 265 (96.7%) was as an outpatient. The overall annual incidence of non-fatal RTI for which medical treatment outside the home was sought was 10.5 (95% CI 9.7 to 11.3; DE 1.83)/100 persons/year, and that as outpatient and inpatient was 10.1 (95% CI 9.4 to 10.9; DE 1.73) and 0.3 (95% CI 0.2 to 0.5; DE 1.02)/100 persons/year, respectively. Of the nine people who were treated as inpatients, five (56%) were pedestrians and four (44%) were MTV users. The mean length of stay in hospital was 4.67 days (median 3 days, range 1–15 days).
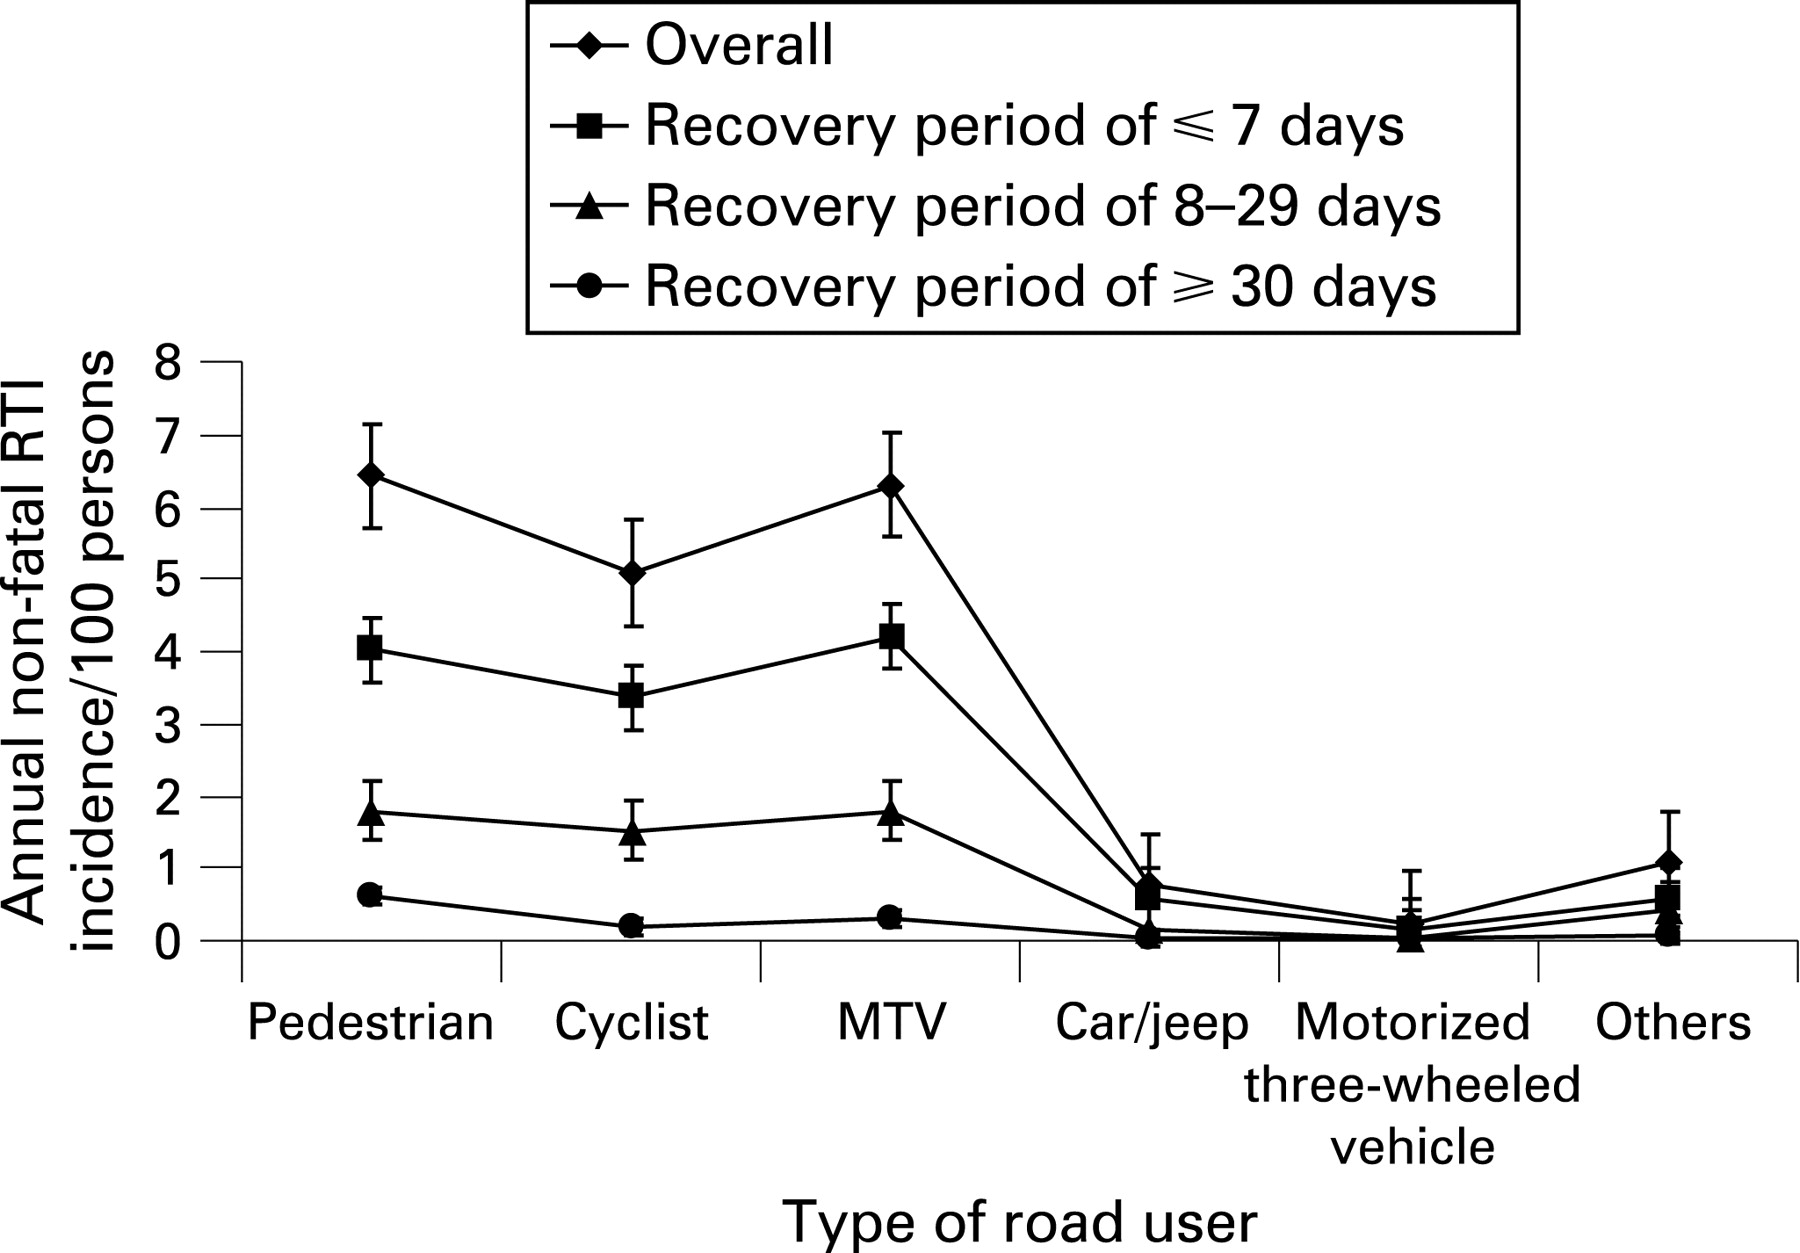
As shown in fig 1, the overall estimated incidence of non-fatal RTI/100 persons/year was similar for pedestrians (6.4, 95% CI 5.7 to 7.2) and MTV users (6.3, 95% CI 5.6 to 7.0) and was slightly lower for cyclists (5.1, 95% CI 4.4 to 5.8). RTIs of road users other than pedestrians, cyclists or MTV users accounted for 10.4% of the overall RTIs. Of the non-fatal RTIs requiring a recovery period of ⩽7 or 8–29 days, the proportion sustained by pedestrians (31.2%) and MTV users (32.6%) was similar, and the proportion of RTIs requiring a recovery period of ⩾30 days sustained by pedestrians was twice (48.5%) that sustained by MTV users (24.6%).
The relative risk of overall RTI or RTI requiring a recovery period of >7 days was significantly higher in the younger age groups, with the highest in the 15–19-year age group, and was more than twice as high in males as females (table 2). The relative risk of overall RTI or RTI requiring a recovery period of >7 days was significantly higher in the third PCMI quartile than the fourth (table 2). The number of people with non-fatal RTIs annually in Hyderabad aged 5–49 years was estimated to be 628 136 (95% CI 608 973 to 647 300), of whom an estimated 212 928 (33.9%) would need a recovery period of >7 days and 450 897 (71.8%) would be male (table 2).
Annual RTI mortality and disability rates
A total of 12 deaths due to RTI were reported in the 5–49-year age group in the preceding 3 years, representing an estimated annual RTI mortality of 38.2/100 000 (95% CI 17.5 to 58.8; DE 1.00). Of these 12 people who died, six (50%) were on an MTV, four (33%) were pedestrians, one (8%) was in a car/jeep, and one (8%) was a cyclist. Seven (27%) belonged to the first and second PCMI quartiles each, nine (35%) to the third, two (8%) to the fourth PCMI quartile, and PCMI data were not available for one.
A total of 11 participants aged 5–49 years reported RTI-related disability in the preceding 3 years representing an estimated annual RTI disability rate of 35.1/100 000 population (95% CI 12.4 to 57.7; DE 1.2). Eight (73%) were aged 30–49 years, six (55%) were male, and three (27%) belonged to the first and second PCMI quartiles each, one (9%) to the third, and four (36%) to the fourth PCMI quartile. Three (27%) were MTV users, three were pedestrians, two (18%) were cyclists, two were users of motorized three-wheeled vehicles, and one (9%) was a car/jeep user. Four (36%) participants reported disabilities related to body structure, and seven (64%) reported body function-related disabilities.
Key points
Road traffic injuries (RTIs) are an increasing problem in India.
Limited data are available on the magnitude of RTIs.
Data are mainly available from hospital records.
In this study, annually, 1 in 14 people in the 5–49-year age group reported RTIs requiring a recovery period of >7 days in this urban population.
The incidence of non-fatal RTIs is similar across per capita income quartiles.
Annually, an estimated 38 per 100 000 people die and a similar number are disabled as the result of RTI in this urban Indian population.
DISCUSSION
This population-based study representative of the 5–49-year age group in Hyderabad city in India shows that, annually, nearly 1 in 14 people report non-fatal RTIs requiring a recovery period of >7 days, and an estimated 38 and 35 per 100 000 people, respectively, die and are disabled as the result of RTI each year.
The annual incidence of RTI requiring more than 7 days of recovery was 6% and that requiring 30 or more days of recovery was 1.2% in this population. These rates are 184 and 32 times the annual deaths from RTIs in this population, respectively. These findings suggest that the incidence of RTI is high, and is higher than that reported from developing countries.15–21 We examined some possible reasons for this. Most previously published population-based studies from other countries on incidence assessment of all types of injuries including RTIs have reported data on RTIs that resulted in at least half/one day of loss of activities using a 12-month recall period, and most of these reported proxy data.15–21 To obtain a more comprehensive picture of RTIs, we documented all RTIs irrespective of the severity or the number of days of lost activity. We did not use proxy data for household members, but collected data directly from all eligible household members except those aged 5–11 years. We used a recall period of 3 months to estimate the annual incidence of non-fatal RTIs, as recall bias is a major limitation of data on non-fatal injuries, and less severe injuries, in particular, are underestimated with longer recall periods.2223 Our data show that the decline in RTI incidence from the 3-month to the 12-month recall period was nearly 50%. We also documented multiple RTIs during the recall period in the same participant. It is known that injuries may be clustered in some people.24 In addition, during the development and testing of the study questionnaire, it was observed that some events (such as falling/slipping while alighting from a moving bus, collisions between a pedestrian and a moving bicycle) were not considered to be an RTC by participants. Therefore, the definition of RTC and RTI was explained to each participant to ensure that the information on these was not missed. This, we believe, has resulted in better RTI estimates.
We used the recovery period from an RTI as an indicator of its severity. With 1 in 14 people aged 5–49 years requiring >7 days to recover from a non-fatal RTI annually and half seeking treatment as an outpatient, the burden of RTI in this urban population is enormous. This burden was highest in young men. The over-representation of young adults and males has been documented previously and is possibly related to their differential exposure to risk and risk-taking.125–29 Interestingly, the non-fatal RTI incidence was similar across the PCMI quartiles for RTIs requiring recovery periods of <30 days. However, there was a higher incidence of RTI requiring a recovery period of 30 days or more in the two middle PCMI quartiles than in the lowest and highest PCMI quartiles. Socioeconomic status is known to be a risk factor for injury including RTI, and mortality and morbidity in vulnerable road users have been reported to be higher in the lower social classes.1273031 However, a cohort study from rural Vietnam did not find poverty to be either a risk or protective factor for RTI, and the middle-income group had the highest risk of RTI.24 We used PCMI as a measure of socioeconomic status; other indicators such as education, occupation, and household expenditure have also been used previously. Further research is needed to better understand the seemingly complex association of socioeconomic status with RTI.
Eighty five percent of non-fatal RTIs occurred in pedestrians, MTV users, and cyclists. The predominance of these road users correlates with previously published data showing that these groups are over-represented in RTI data at the global level.1 In Hyderabad, there has been a phenomenal increase in vehicles on the roads in the last three decades, 90.7% from 1981 to 2001.9 Such an increase would be expected to result in increased risk of RTI for the most vulnerable road users. MTVs account for the majority of vehicles in Hyderabad.9 An interesting finding was that RTI incidence in MTV users increased with increasing per capita income. In our population, MTV ownership increased with increasing PCMI (p<0.001; unpublished data). The cost of an MTV in India is in the range US$750–1500 (£430–860; €560–1120) and is higher than the annual per capita gross domestic product for India (US$736 (£424; €546)).32 The higher ownership of MTVs with increasing income may explain the higher RTI incidence in MTV users with increasing income of the population.
The annual RTI mortality per 100 000 in the 5–49-year age group was 38.2 (95% CI 17.5 to 58.8). This study was not powered to measure RTI mortality, as the required sample size for such an assessment would be very large, and the wide confidence intervals highlight the importance of a reasonable sample size to arrive at reliable RTI mortality estimates. The point estimate of RTI mortality in our urban population aged 5–49 years is nearly twice that reported by the GBD Study.5 The GBD Study estimates are for all ages and the entire country including rural areas, where RTI mortality is estimated to be lower, and are only projected estimates because of non-availability of complete death registration data.5 Our mortality is comparable to a previous assessment for all ages carried out in south India (34/100 000 population), which included rural and urban populations; the poor were over-represented in this sample.33 The burden of disability due to RTI was similar to that of mortality in our population. It is estimated that 2.1% of the Indian population has some form of disability, of which 69% is in the 5–49-year age group,34 and that injuries are responsible for one-third of these disabilities, with RTI contributing nearly half of the injury disability.35
RTIs are responsible for significant loss of life, disability, and economic loss in this population, as the young and economically productive age group is affected. However, limited research on RTIs is available from India.3637 The lack of an appropriate response and resources for RTI prevention is further highlighted compared with HIV/AIDS, another disease affecting the young and economically productive age group, which has a mortality (37.5/100,000) similar to that of RTI in India.5 The resource allocation for HIV/AIDS was 13.5 times more (US$469.2 million (£269.6 million; €347.2 million)) than that for road safety (US$34.7 million (£20.0 million; €25.7 million)) in the last 5 years in India.3839 There is nearly a fourfold increase in the funds allocated for HIV/AIDS over the next 5 years.38 Clearly, the low allocation of funds for research and evidence-based road safety interventions needs to be enhanced to reduce the RTI burden in India.
As reliable estimation of the RTI burden is a critical first step for informing RTI prevention, data from well-designed population-based studies are needed to provide a better understanding of this burden. This study shows that there is a high burden of RTI in this urban population. Against a background of the recent interest shown by the Government of India in addressing RTI,40 these findings may help to raise the profile of RTIs as a public health problem, which needs to be addressed as a preventable cause of mortality and morbidity and to plan appropriate interventions.

Acknowledgments
We acknowledge the contribution of N Balaji Rao, D Ram Babu, K Bhagawan Babu and YRK Satya Prasad in the implementation of this study.
RD conceptualized and designed the study, led the data analysis, and wrote the first draft of the manuscript; GAK managed and analysed the data and contributed to interpretation; MAA led the implementation of the study and contributed to the design and data interpretation; GMA contributed to the implementation of the study and data interpretation; LD contributed to the design of the study, data analysis and interpretation. All authors contributed to the manuscript.
REFERENCES
Footnotes
Funding: Wellcome Trust, UK (077002/Z/05/Z). RD is supported in part by the National Health and Medical Research Council Capacity Building Grant in Injury Prevention and Trauma Care, Australia.
Competing interests: None.