Article Text

Abstract
Background: In November 1993, the Israeli government increased the speed limit for all vehicles from 90 to 100 km per hour on a total of 115 km of its three major interurban highways.
Design/Setting: We use ARIMA time series intervention models to evaluate the effect of the raise in speed limit on fatalities, serious injuries, and case-fatality for years 1988–1999. Motor vehicle crash data came from the Central Bureau of Statistics of Israel.
Results: Between January 1988 and December 1999, a total of 6029 persons were killed and 45 616 were seriously injured on roads in Israel. For all roads combined, the time series ARIMA model indicated that there were 4.69 more deaths per month (p<0.001), or 347 more than expected in the post-intervention period. Case-fatality rate (CFR) on all roads combined rose significantly (p<0.001). Modified case-fatality rate (CFRS) showed an increase of 2.5 deaths per 100 serious casualties (p<0.001).
Conclusions: The impact of raised speed limits was immediate and sustained. The largest increase in deaths occurred on interurban roads but a spillover effect was observed on urban roads as well. The increases in deaths and case-fatality rates persisted six years after the speed limit change despite major countermeasures and increasing congestion throughout the period of follow-up.
- ACF, autocorrelation function
- AR, autoregressive
- ARIMA, autoregressive integrated moving average
- CBS, Central Bureau of Statistics
- CFR, case-fatality rate
- CFRS, modified case-fatality rate
- INTV, intervention variable
- PACF, partial autocorrelation function
- MA, moving average
- speed limits
- speed spillover
- case fatality
- road deaths
- ARIMA
Statistics from Altmetric.com
- ACF, autocorrelation function
- AR, autoregressive
- ARIMA, autoregressive integrated moving average
- CBS, Central Bureau of Statistics
- CFR, case-fatality rate
- CFRS, modified case-fatality rate
- INTV, intervention variable
- PACF, partial autocorrelation function
- MA, moving average
On November 1, 1993, the Government of Israel increased the enforced speed limit for all vehicles, including trucks, from 90 to 100 kilometres per hour (kph; 55.9 to 62.1 mph) on segments (115 km or 71.4 miles) of three major interurban highways connecting its four major cities, Tel Aviv, Jerusalem, Haifa, and Beersheba. The Government made major improvements on these highways and many other roads, and declared the increased speed limit a one-year “experiment.”1 Simultaneously, it mandated the use of rear seat belts and daytime running lights.
Researchers have demonstrated that lower travel speeds and death tolls usually follow lowered speed limits,2,3 and higher travel speeds and higher death tolls follow increased speed limits.4,5,6,7,8,9,10 Recent data demonstrate a 17% rise in deaths following a 4% rise in speeds on US Interstates.11 High-speed driving on highways induces speed adaptation, on connecting interurban roads, and even urban roads. This so-called “spillover effect” may persist indefinitely.12,13 Yet, some still express doubts over the impact of increased speed limits.14,15
Israel (size: 21 501 km2) provides an ideal setting for observing effects of speed limits. Israel has a fairly modern car fleet and roads, relatively low drunk driving rates, and is isolated from traffic from neighbouring states.16 All of its highways are classified as interurban roads. The three highways on which the enforced speed limit was raised serve the major conduits of Israel’s interurban traffic. In a previous study, we reported a nationwide increase in deaths (15% on interurban and 13% on urban roads), using a simple comparison of 3 years before-and 5 years following the raise in speed limits on selected roads.16 We sought to examine the robustness of this finding using an analytic time-series model.
In this study, we use autoregressive integrated moving average (ARIMA) time series intervention models to evaluate the effect of the raise in speed limit on fatalities, serious injuries, and case-fatality. Studies of statistical methods have noted that ARIMA models are more appropriate for describing the effect of policy changes when using time series data rather than linear regression models or simple before and after comparisons.17
METHODS
Data sources
We collected monthly data on road deaths (died within 30 days after crash injury) and serious injuries (hospitalised more than 24 hours) from the Israel Central Bureau of Statistics (CBS)18 for the years 1988 through 1999. However, in 1993 and 1995 the police initiated policy changes that resulted in a decrease in reporting of crashes involving only minor injuries. For this reason, we exclude data on light injuries from this analysis.
The police examiner summarises crash reports and directly enters the data in a database that is then submitted monthly to the CBS for processing. Computerised crash reports are matched with vehicle registration, driver license and population registry files. Data were not available for individual roads or sections of interurban roads, particularly urban and connector roads. In addition, systematic measurements of travel speeds for the entire period of follow-up were not available for this analysis.
We calculated case fatality rates (CFR), which is the risk of death among all individuals injured in road crashes (presented as deaths per all 100 casualties). We also used a surrogate measure for the case fatality rate—the proportion of killed among all seriously injured and deaths (CFRS: deaths/(deaths+serious injuries))—so as to avoid biases from transient underreporting of light injuries, which the CBS estimated to be of the order of 10%. We also tracked trends in deaths, serious injuries, CFRs and CFRSs by the following road types: interurban and urban roads. Urban roads are defined as, “Any road which is within the area of a local authority, marked at the entrance by a built up area sign and at the exit by an exit sign”. Interurban roads comprise all non-urban roads and are generally connector roads and highways between municipalities (that is, local authorities).
Statistical analysis
We used autoregressive integrated moving average (ARIMA) intervention time series models19 to evaluate the effect of the raised speed limits on road fatalities, serious injuries, and case-fatality rates. Intervention ARIMA models analyse the effect of a policy change at a specific point in time while accounting for trends prior to the intervention. ARIMA models, unlike linear regression models, do not assume that the error terms are independent. In addition, ARIMA models can take into account any significant autocorrelations within each variable.
Because each data series has a unique structure, ARIMA models are developed empirically for each variable using a three-stage iterative process: identification, estimation and diagnosis.
Identification involves analysis of the crude series to determine stationarity. The Dickey-Fuller test (D-F statistic) and structure of the autocorrelation function (ACF) and partial autocorrelation function (PACF) were used to determine stationarity. If a series is not stationary we difference the data in order to achieve stationarity. Estimation involves defining the autoregressive (AR) and moving average (MA) filters.
We used the following diagnostic procedures: (1) the ACF and PACF of the residuals to determine if all the structure in a series has been accounted for, (2) modified Box-Ljung Q-statistic to further evaluate if structure remains in the series, (3) Hessian Matrix to assess collinearity, (4) and the Hinich test to assess if the series is linear. Based on the Hinich test and the appropriateness of the fitted ARIMA models, we did not transform any of the data series or use non-linear models (for example, MARS).
The validity of a transfer function requires a well specified noise model (that is, initial ARIMA model) of the pre-intervention period to eliminate spurious relationships. We used a dummy variable to model a step function response (0 for < Nov 1993; 1 for ⩾ Nov 1993). For the transfer function, we did not assume that the effect of the speed limit change was constant over the course of follow-up (that is, step function change without decay) which has been the general approach used for analysing the effects of speed limit changes in other studies.20–23 In all our models, we test whether any effect from the policy change decayed over time. However, none of the transfer function models demonstrated a significant decay effect. Furthermore, in most models, structure was added back into the cross correlation matrix that was not present prior to including the denominator coefficient in the transfer function.
We used the following diagnostic procedures in the transfer function models: (1) evaluated the cross correlation matrix to assess feedback, appropriateness of the filter and determine the impact of various transfer functions on the series, (2) Haugh S-Statistic to further evaluate feedback. We did not observe significant feedback in any of the final transfer function models, which indicated that a vector autoregressive moving average model was not required. We also conducted tests for heteroschedasticity to determine if a GARCH model was more appropriate than an ARIMA model. In all models, we found no evidence that the heteroschedasticity was systematic, and in all cases the generalised autoregressive coefficient was insignificant.
We used B34S software (v8.10z; copyright Stokes, 1972, 2005) to develop the ARIMA intervention models. All B34S models were validated using SAS (v9.1, SAS Institute Inc., Cary, North Carolina, USA) software package. The ARIMA models included 144 monthly observations over 12 years. Filter and transfer function coefficients are presented along with their respective t-values. The significance levels for the t-values is as follows: 1.977, p = 0.05; 2.353, p = 0.02; 2.611, p = 0.01; 3.361, p = 0.001. A two-sided p-value less than 0.05 was considered statistically significant.
Deaths attributable to change in case-fatality
Using validated Newtonian models,3,24 we estimated the expected number of deaths attributable to the raise in speed limit without safety countermeasures and increased road congestion. This estimate was based on changes in CFRS as determined from our ARIMA models. We calculated an observed number of deaths using the parameter estimate of the intervention variable in the ARIMA models. Since the ARIMA models were step-function models, we multiplied the parameter estimate for the intervention variable (INTV) in the ARIMA models—representing a monthly increase in deaths—by 74 lags (Observed = INTV(killed) * 74). We calculated an expected number of deaths using the parameter estimate of the intervention variable in the ARIMA models evaluating CFRS trends. The expected number of fatalities based on the CFRS represents the number of deaths attributable to the speed limit change if no countermeasures or changes in levels of congestion occurred between November 1993 and December 1999 (formula 1). The difference between the expected and observed provides us the estimate of the number of deaths prevented by countermeasures and increased road congestion.
Formula 1:

RESULTS
General trends on all roads combined
Between January 1988 and December 1999, a total of 6029 persons were killed (2704 urban and 3325 interurban), and 45 616 were seriously injured (26 778 urban and 18 838 interurban) on roads in Israel. After the speed limit was raised on November 1 1993, on selected stretches of certain highways, a total of 3265 persons were killed (1448 urban and 1817 interurban) and 22 004 were seriously injured (13 233 urban and 8771 interurban) on all roads in Israel.
Trends in annual monthly averages of killed, serious injuries and case-fatality rates are presented in table 1. The number of killed in road crashes prior to November 1993 was fluctuating around 40 deaths per month. In the period immediately following the change in speed limit, the average annual monthly death toll rose by six. The increase in annual monthly averages in deaths was sustained until 1999 when a sharp decline occurred to pre-intervention levels. In 1999, there was a three month period between February and April in which the road fatalities were unusually low (mean = 27.7)(fig 1). The average monthly death toll in the remaining nine months in 1999 was 43.7.
Annual monthly averages of killed, seriously injured, case fatality rates (CFRs) and modified case fatality rates (MCFRs) in road crashes before and after increase in speed limit from 90 kph to 100 kph on interstate roads in November 1993
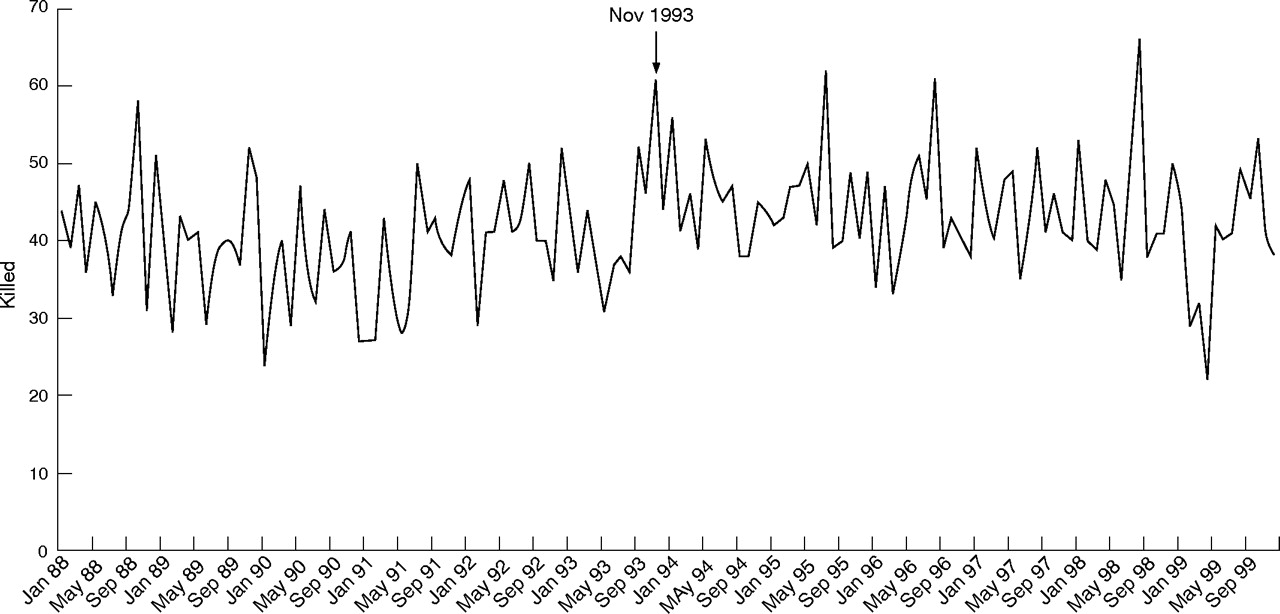
Trend in the number killed in road crashes from 1988 through 1999.
Annual monthly averages of serious injuries demonstrated a continued decline throughout the period of observation. The case-fatality rate was steadily declining between 1988 and October 1993 (2.21 to 1.28). In the period following the intervention, a rise in CFR to 1.54% from 1.28% is observed and then declined again through 1999. Even so, an apparent deviation from the pre-intervention slope persisted throughout the post-intervention period. (fig 2) Following the raise in speed limits, the modified CFRS showed an increase in the initial 14 month period from 10.27 to 12. 46. Contrary to the gradual fall in observed trend in CFR, the CFRS appears to have steadily increased during the post-intervention period (fig 3).
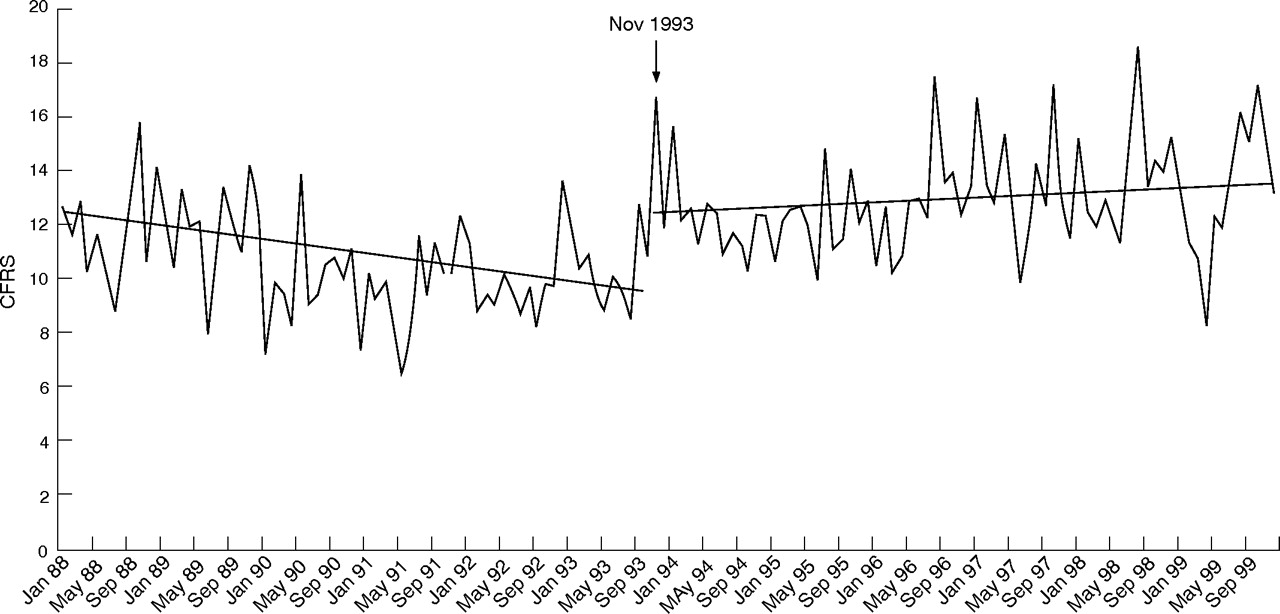
Trend in modified case fatality rate (CFRS) from 1988 through 1999.

Trend in case fatality rate (CFR) from 1988 through 1999.
ARIMA MODELS
All roads combined
We developed ARIMA intervention models for deaths, serious injuries, and case fatality rates by road type (table 2). For all roads combined, the time series of road fatalities demonstrated a significant seasonal effect (seasonal MA coefficient, 0.879; t-value = 7.11; p<0.001). The transfer function model indicated that deaths on all roads combined rose 4.69 per month (p<0.001) in the post-intervention period. This accounted for an excess of 347 deaths during the 74 months following the raise in speed limit from 90 kph to 100 kph. The time series model for serious injuries showed a decline of 31.4 serious injuries per month following the intervention but was not statistically significant (p>0.05). Seasonality was not observed for either the CFR or modified CFRS time series. After November 1993 on all roads combined, CFR rose by 0.393 (p<0.001)—or an increase of 39.3 deaths per 10,000 casualties. CFRS increased by (p<0.001) 2.5 deaths per 100 serious casualties.
Interurban roads
The majority of the impact of the raise in speed limits occurred on interurban roads where the legal change in speed limits occurred (table 2; http://ip.bmj.com/supplemental). We used an identical seasonal model as shown for all roads combined for the road fatality series on interurban roads. Both the seasonal MA and intervention terms were significant in the final model. Based on the ARIMA model, there was in increase of 3.11 road deaths per month after the raise in speed limit (p<0.01). Between November 1993 and December 1999, there was an excess of 230 deaths on interurban roads as a result of the speed limit change. The largest decline in serious injuries occurred on interurban roads but was not significant (−33.92, p>0.05). The ARIMA transfer function model indicated that the CFR increased by 1.28, or 128 excess deaths per 10 000 casualties following the intervention (p<0.02). The CFRS increased by 4.1 excess deaths per 100 serious casualties (p = 0.01).
Urban roads
No ARIMA model was appropriate statistically for those killed on urban roads. The ACF and PACF plots showed no significant spikes, the D-F statistic was significant (p<0.001) and differencing added significant structure back into the model. Both lag 1 and seasonal AR and MA terms were insignificant. An intervention term on the ARIMA (0,0,0) model showed an increase of 1.63 fatalities per month (p<0.05, resulting in 120.3 excess deaths in the 74 month post-intervention period).
For serious injuries, an identical ARIMA model was estimated as shown for the series of all roads combined. (table 2) The numerator coefficient in the transfer function model was negative (INTV = −3.31; p>0.05) corresponding to the decline in serious injuries shown in table 1. We also observed an insignificant decline in the CFR on urban roads following the intervention (INTV = −0.08; p>0.05). However, the CFRS increased by 1.52 deaths per 100 serious casualties after November 1993 (p<0.01).
Number of deaths attributable to change in case-fatality
Using formula 1 (shown above), our data suggest that in the absence of countermeasures and increased congestion, increased speeds of travel and impact would have resulted in increases of 377 and 205 deaths on interurban and urban roads, respectively over the six year post intervention period. We estimate that the countermeasures and congestion reduced the number of deaths attributable to the increase in CFRS following the raise in speed limit by 147 deaths (39%) on interurban roads and 84 deaths (40%) on urban roads between November 1993 and December 1999.
DISCUSSION
The six year before-six year after ARIMA models used in this analysis demonstrate an increase in deaths and case-fatality rates on all roads that was not only immediate and large, but was sustained. Prior ARIMA time-series studies on the effects of speed limit increases have been restricted to short post-intervention periods.20–23 These studies do not tell us whether the effects of raised speed limits on deaths, injuries and severity of injuries persisted years after the policy change.
The immediate increases in deaths and CFR predicted the subsequent sustained six-year trend (figs 1–3). The largest increase in deaths occurred on interurban roads, but a spillover effect appears to have occurred on urban roads. The analysis indicates that 347 (10.6%) of the 3265 deaths that occurred between November 1993 and December 1999 were attributable to the increase in the legal speed limit, 230 (12.7%) of the 1817 deaths on interurban roads occurred as a result to the policy change, and 120 (8.3%) of the 1448 urban deaths.
This is the first study to evaluate the effects of changes in the legal speed limit on both deaths and case-fatality rates using ARIMA time-series models. Case fatality rate (CFR and CFRS) is a parameter independent of vehicle kilometres travelled and is a direct measure of the effects of speed of impact, seat belt use, and trauma care.24 The observed increase in deaths following the increase in the speed limit to 100 kph substantially underestimated the increase in deaths directly attributable to the increase in CFRS (Formula 1). The exponential relationship25 between “small” increases in speed and nationwide increases in CFRS over the next 6 years, more than offset the decreases in death risks from protective countermeasures such as newly widened roads, improved lighting, clover-leafs, urban roundabouts, air bags, rear seat belt laws, more speed enforcement and trauma care, and other countermeasures, as well as more congestion.
Sporadic monitoring from 1971 to 1994 indicates that right after the change in speed limit policy on November 1993, travelling speeds increased on high-speed roads by 4.5% on the slow lane of the Tel Aviv-Haifa road, (Road 2) and by 9.1% on the fast lane of the Jerusalem-Tel Aviv road, (Road 1) and even more so on a newly widened stretch of one major connecting road (highway #40)—all compared to the year before.16 Other data showed that speeds rose on all three highways after the speed limits were raised, and that the mean estimated increase in speeds on the high-speed roads later fell back to some 4% (range: −4% to +13%) in 1995.26–28
The empirical relationships identified by Nilsson,29 following models derived from Newtonian physics, show that increases in travel speeds lead to increases in deaths to the fourth power. Based on Nilsson’s models, we would have expected an increase of 17% in fatalities on interurban roads.29 We observed an increase of 12.7% (N = 230) on interurban roads. If no countermeasures or increased congestion occurred during the post-intervention periods we would have observed a 19.2% increase in fatalities on interurban roads (expected deaths divided by total injuries; 377/(1817+147)).
Theory suggests that serious injuries should increase following increases in travel speeds,24 but we observed an insignificant decrease in serious injuries. However, the predictive equations on the fourth power effect are based on the assumption that characteristics of the road environment remain relatively unchanged. In our case, there were massive changes in the road environment of high speed and all other interurban roads. The introduction nationwide of major improvements in road design—eliminating black spots, more night time lighting, road dividers between north and south bound traffic and road widening—may indeed have led to fewer crashes, but at higher speeds, so that case fatality and deaths greatly increased despite large falls in crashes and injuries
Some studies showed that the effects of increased speed limits are not limited to high-speed roads. Speed adaptation and spillover effects occur when drivers coming off high-speed roads continue to drive faster than those already on the same road13,30,31 and may account for more deaths than on the safer roads with higher design speeds. Therefore, studies in which time trends on lower speed spillover roads serve as controls for trends on high-speed roads erroneously underestimate the effects of speed.16 The observed increase in modified CFRS and road deaths on urban roads provide strong evidence for a spillover effect.
Implications for prevention
The findings show that a small increase in the speed limit (6 mph) resulted in an immediate, substantial and persistent increase in road deaths and case-fatality. In the US, approximately 42 000 Americans are killed each year in road crashes, yet US policy has been to end the national speed limit of 55 mph and increase travel speeds because there remains contention whether small increases in speed can result in persistent increases in road fatalities. The catastrophic failure of the US to reduce its road deaths in absolute numbers contrasts starkly with the trends in the UK, France and Australia, where there have been reductions of the 40–50% associated with the introduction of nationwide speed camera networks.32,33 More importantly, the persistent impact of increased speeds on road deaths was observed despite coinciding with tremendous improvements in road design, vehicle safety, mandatory seat belt and child restraint use, and other important safety countermeasures. These countermeasures do not prevent the increase in deaths associated with higher travel speeds.
Key points
-
Prior autoregressive integrated moving average (ARIMA) time-series studies on the effects of speed limit increases have been restricted to short post-intervention periods.
-
In the US, approximately 45 000 Americans are killed each year in road crashes, yet US policy has been to end the national speed limit of 55 mph and increase travel speeds because there remains contention whether small increases in speed can result in persistent increases in road fatalities.
-
We use ARIMA time-series models to show that a “small” increase in the speed limit (6 mph) resulted in an immediate, substantial and persistent increase in road deaths and case-fatality six years after the change in policy.
-
More importantly, the persistent impact of increased speeds on road deaths was observed despite coinciding with tremendous improvements in road design, vehicle safety, mandatory seat belt and child restraint use, and other important safety countermeasures. The opponents to stricter speed regulations often cite the improvements in safety and design as a justification for the increased speed limits.
REFERENCES
Supplementary materials
Files in this Data Supplement:
Files in this Data Supplement:
Footnotes
-
Competing interests. None.
Linked Articles
- Correction