Article Text

Abstract
Research question—Does a database of hospital admission data linked to police road traffic accident (RTA) reports produce less biased information for the injury prevention policymaker, planner, and practitioner than police RTA reports alone?
Design—Data linkage study.
Study population—Non-fatal injury victims of road traffic crashes in southern England who were admitted to hospital.
Data sources—Hospital admissions and police RTA reports.
Main outcome measures—The estimated proportion of road traffic crashes admitted to hospital that were included on the linked database; distributions by age, sex, and road user groups: (A) for all RTA injury admissions and (B) for RTA serious injury admissions defined by length of stay or by nature of injury.
Results—An estimated 50% of RTA injury admissions were included on the linked database. When assessing bias, admissions data were regarded as the “gold standard”. The distributions of casualties by age, sex, and type of road user showed major differences between the admissions data and the police RTA injury data of comparable severity. The linked data showed smaller differences when compared with admissions data. For RTA serious injury admissions, the distributions by age and sex were approximately the same for the linked data compared with admissions data, and there were small but statistically significant differences between the distributions across road user group for the linked data compared with hospital admissions.
Conclusion—These results suggest that investigators could be misinformed if they base their analysis solely on police RTA data, and that information derived from the linked database is less biased than that from police RTA data alone. A national linked dataset of road traffic crash data should be produced from hospital admissions and police RTA data for use by policymakers, planners and practitioners.
- data linkage
- hospital records
- police road traffic crash reports
- bias (epidemiology)
Statistics from Altmetric.com
The aim of this paper is to address the question: Does a linked database of hospital admission data to police road traffic accident (RTA) reports produce less biased information for the policymaker, injury prevention practitioner, and planner than police RTA reports alone? There is a concern that biased information is produced when police road traffic crash reports alone are analysed.1–8 Problems could arise, however, with a linked database since such a database is likely to be incomplete.3,9–11
Many authors have linked hospital admissions data to police road traffic crash reports in an attempt to improve their databases for injury prevention.1,2,6,12–14 The reasons we are interested in data linkage include:
-
A concern about the validity of police RTA data.
-
To increase the richness of data to assist in prioritisation of injury prevention activity and for identifying methods of prevention.
In England, like elsewhere, the data collected on hospital admissions and in police road traffic accident reports complement each other. Linkage of these sources will increase the range of the data available for injury prevention (table 1).
Accident information requirements
Data linkage can, however, result in a substantial loss of cases. In England, some RTAs cannot be identified from hospital admissions due to missing external cause of injury codes on some electronic records. Furthermore, among those road traffic crashes resulting in hospital admissions that can be identified, not all can be linked to police road traffic crash reports since: (A) not all cases are reported to the police1,3,6–9,13 and (B) errors in recording data in either database can result in a failure to make a link.1–5,7 Consequently, information generated from a linked database might also be misleading for injury prevention policymaking and planning.
To address the aims of this work, it was hypothesised that if estimates from a linked database included little bias, then the distribution of occurrence of injury by age, sex, and type of road user based on data from the linked database and hospital admissions data would be similar. Due to the known inaccuracies in the police RTA data and bias in reporting to the police, however, it was also hypothesised that the distributions of occurrence with regard to police RTA injury casualty data of comparable severity would be different from the distributions produced from hospital admissions data.
Previous work has identified that a naïve analysis of hospital admissions data themselves can be misleading. For minor and moderately severe injuries, sociodemographic, health service provision, and access factors influence the probability of hospital admissions. It has been argued that admissions to hospital for serious injury are much less influenced by these factors.15,16 This is recognised by the government through the non-fatal injury target set in their health strategy for England,17 which is: “.... to reduce by at least one tenth the rate of serious* injury from accidents among people of all ages by the year 2010”.
Given the above, it was also hypothesised that the distribution of occurrence of non-fatal serious injury would be similar when described using the linked database compared with hospital admissions data.
Methods
POPULATION
The target population for this work comprised the non-fatal injury victims of road traffic crashes that occurred in an area of southern England, namely East and West Sussex, including Brighton and Hove, who were admitted to hospital in this area. The population area will be referred to as Sussex.
SOURCES OF DATA
The hospital admissions data used for this investigation were those included in the record of the first finished consultant episode of admissions to NHS hospitals in Sussex as a result of RTAs during the period April 1995 to March 1998. Cases were selected which had a principal diagnosis code, recorded in the first diagnosis field, between S00-T98 inclusive, and where the first external cause code (E code) in the subsequent diagnosis fields on the patients electronic record was in the range V00–V49. The coding systems used for both the nature of injury and external cause of injury is the International Statistical Classification of Diseases and Related Health Problems, 10th revision.18
Sussex police supplied data on all road traffic casualties attended by them that occurred in the study area within this period. Whenever the police attend a road accident that took place on a public road, they complete a comprehensive accident report form. There is common agreement between police forces for the collection of certain information. In order to assist the police in the completion of this common dataset, a companion manual offers guidance, in the form of definitions and examples, on the correct way to complete the form.19,20 The data collected are transferred on to computer, and after a series of checks and corrections, it is sent to the Department of the Environment, Transport and the Regions (DETR) to produce a national database.
In theory, all cases admitted to hospital should be classified within police road traffic crash reports as “serious” injury.19,20 However, previous work has indicated that there is a large degree of misclassification associated with the severity of casualty field on the police database.1,2,7,21
DEFINITIONS
Bias
We use an epidemiological/statistical definition of the term “bias” in this paper. This has been described as a: “deviation of results or inferences from the truth, or process leading to such deviation. . . . The term bias does not necessarily carry an implication of prejudice or other subjective factor, such as experimenter's desire for a particular outcome. This differs from conventional usage in which bias refers to a partisan point of view”.22
Serious injury
Police RTA “serious” injury has been defined in the DETR coding manual (STATS20) as one of the following: fracture; internal injury; severe cuts; crushing; burns; concussion; shock requiring hospital treatment; detention in hospital as an inpatient; and injuries to casualties who die 30 or more days after the accident from injuries sustained in the accident†.
Some of these cases classified to “serious” on the police RTA data, therefore, are not serious as defined by a severity of injury coding system such as the Abbreviated Injury Scale (AIS),23 that is, an AIS of 3 or above. In the remainder of the paper, we reserve the term serious for those injuries of importance in terms of disablement, quality of life, or threat to life and will use the term “non-slight” to refer to police RTA “serious” injuries.
The epidemiological measurement of injury severity has been based on clinical signs, symptoms, and on the number and types of organ and system damage.24 Injury severity scales have been used to establish minimal criteria for the surveillance of injury.25 In a given year, most people experience minor injuries, such as small cuts, bruises, soft tissue injury, and burns. Most of these heal with little or no intervention and do not interfere with the person's activities. Our attention and resources should be focused on reducing serious injuries and their sequelae.24 In this work, two methods of identifying serious injury were used as follows: (1) RTA cases who were transferred to another hospital, or who were admitted and stayed in hospital for four or more days17 and (2) RTA cases who were transferred to another hospital, or were admitted to hospital with one of the following injuries: serious long bone fractures,15 head injuries admitted to hospital for more than one day, and neck and spinal injuries.
Work by the Transport Research Laboratory14 showed that a substantial majority of RTA casualties who had a hospital inpatient stay of four or more days were seriously injured as defined by the AIS.23 Work by one of the authors (PCC) has shown that the majority of admissions to hospital with the diagnoses specified in (2) are serious injuries as classified by AIS. Both definitions include transfers to another hospital, many to a specialist hospital, and so a transfer is also an indicator of serious injury.
Neither of the methods used in this paper, for identifying serious injury, are exact. Use of any criteria based solely on electronic hospital admissions data in England, however, will result in some misclassification of the severity of injury. They are each simply indicators of severity rather than direct measures.
DATA LINKAGE METHOD
A manual method of data linkage was used, based on name, date of accident/admission, and place of occurrence/admission, since automatic methods had been found to be unreliable with these data.26 Although names and addresses of the casualties were available from the hospital data, they were not included on police RTA electronic records. Data on road traffic crash casualties, identified from the hospital records were printed in name order with date and place of hospital admission. One of the investigators (SW) visited each police station in the study area and manually searched the police accident registers for approximate matches.
Once a putative match was found, the police accident reference number was written against the details from the hospital record, and later transcribed on to the inpatient database for the next phase of the matching. These records were then electronically linked to the relevant police RTA data records using the accident reference number as the linking variable. All the links were checked by comparing the information on age, sex, type of road user, and date of crash/hospital admission between the two electronic databases. Where a mismatch of these variables or a multiple match existed, these cases were investigated through a manual search of the more extensive police accident (paper) files.
STATISTICAL ANALYSIS
If the proportion of RTA cases for which there is an E code is 80%, then 20% of RTA admissions cannot be identified from the admissions data and so immediately 20% of cases cannot be linked. If 60% of admissions for which there is an E code were linked to police RTA data, then the proportion of all RTA admissions that are linked is 60% of 80%, that is 0.6 × 0.8 × 100%. This is an illustration of the application of a general theorem within probability theory27 that was used to estimate the proportion of road traffic crashes admitted to hospital on the linked database. The proportion of RTA cases which have an E code cannot be estimated from electronic hospital admissions data, however, since an E code must be present to identify whether the case is an RTA or not. Nevertheless, we can estimate it as the proportion of all injury admissions for which there is an E code‡. Applying probability theory to these data, the estimated proportion of road traffic crashes admitted to hospital on the linked database was derived as the product of:
-
The estimated proportion of RTAs that were identified from hospital admissions data, derived as the proportion of cases whose principal diagnosis was an injury for which an E code could be found.
-
The proportion of RTA cases identified from the hospital admissions data that were linked to police RTA data (the linkage rate).
Distributions of occurrence by age, sex, and road user groups were initially considered graphically. The road user group categories that we used were modifications of those used by the local Highways and Transport department. The hypotheses of equivalence in the distributions of occurrence derived from each database were tested using a χ2 goodness-of-fit test§.28 The distributions of admissions by age, sex and road user groups produced from the hospital admissions data were assumed to reflect the population distribution. The distributions based on the police RTA non-slight injury casualties and the linked data were compared against these “population distributions” of road traffic casualties. The comparison of the distributions of serious injuries was only possible for the linked and the hospital data.
Results
Of the original 2666 hospital admissions coded as road traffic crashes, 1625 (61%) of these cases were linked to the police registers and subsequently to the police RTA electronic records. The linkage rate was much lower for pedal cyclists (31%) than for other road users: 67% for vehicle occupants, 69% for motorcyclists, and 72% for pedestrians. The linkage rates for serious injury admissions were similar to this (table 2).
Estimated percentage of RTAs admitted to hospital who are on the linked database
For all hospital admissions for injury, 82% had an external cause of injury code. Combining this with the linkage rate, the proportion of road traffic crashes admitted to hospital that were included in the linked database was estimated to be 50%. For serious injuries, the rate was a little higher, particularly for those defined by nature of injury (table 2).
For the non-fatal injury cases of any severity, the proportions of male and female RTA casualties estimated from the linked database were similar to those for all hospital admissions. There were higher proportions of males among the police RTA non-slight injury casualties than among the hospital admissions (table 3). The distributions by age differed for the three databases. For the linked data, there was a smaller proportion of children under the age of 16 than in the hospital admissions data. There were smaller proportions of children and larger proportions of adolescents and adults aged 16–64 among the police RTA non-slight injury casualties than the hospital admissions (table 3, fig 1).
Number (%) of non-fatal injury cases by sex, age, and road user group

Distribution of non-fatal injury cases by age group.
The proportions of casualties in each road user group appeared similar for the linked database and the hospital admissions data, with the exception of pedal cyclists and motorcycle riders. For police RTA non-slight injury casualties relative to hospital admissions, there were lower proportions of cyclists, particularly for children, a higher proportion of motorcycle riders, a higher proportion of young and adult drivers aged 17–59, and a lower proportion of car passengers (table 3 and fig 2).
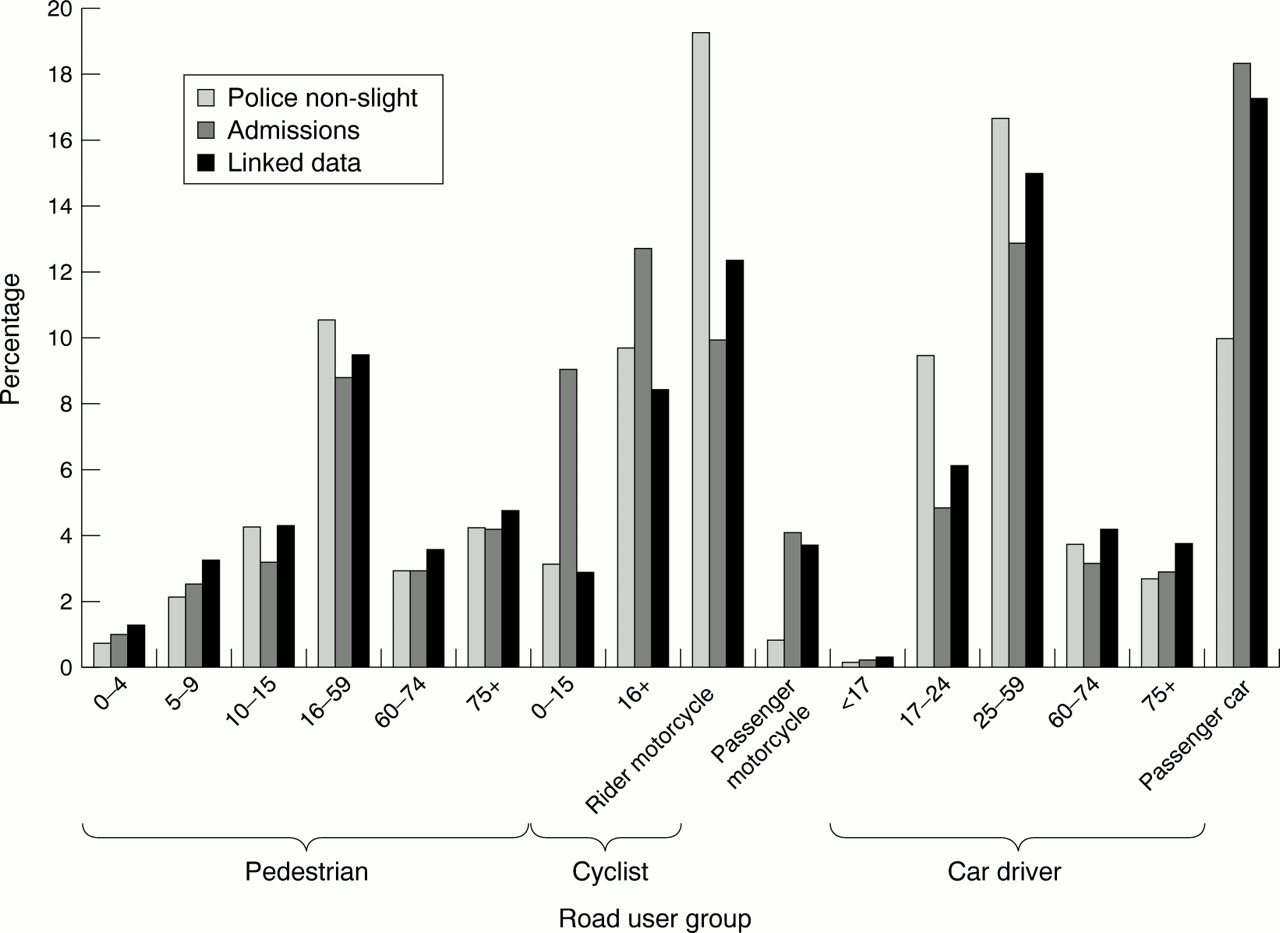
Distribution of non-fatal injury cases by road user group.
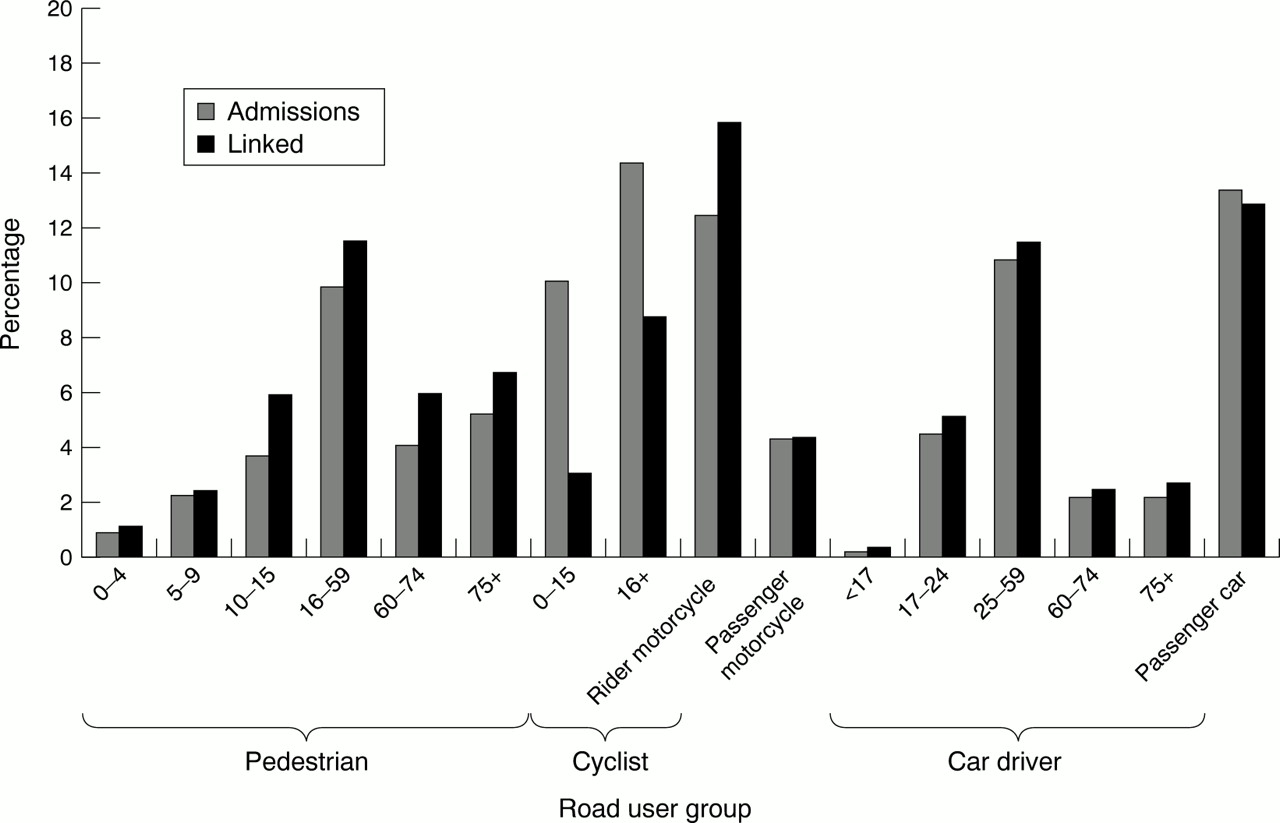
For non-fatal serious injury, defined either using length of stay or nature of injury, when hospital admissions and the linked data were compared for the variables of age and sex, the proportions of males and females and the proportions in each age category were approximately the same (tables 4 and 5). For both definitions of severity, there were significant differences between the proportions of non-fatal serious injury casualties in some road user groups for the linked data compared with hospital admissions; however, the differences were less than for hospital admissions of any severity (tables 4 and 5, figs 3 and 4). For both definitions of severity, the proportion of pedestrians aged 10–15 was higher in the linked data compared with hospital admissions, the proportion of cyclists was lower, and both of these differences contributed substantially to the χ2 statistic (tables 4 and 5). The discrepancies found between the admissions data and the linked data when using the nature of injury based severity definition were greater overall compared with the length of stay severity definition, as indicated by the χ2 statistic.
Number (%) of non-fatal serious injury cases (length of stay definition) by sex, age, and road user group
Number (%) of non-fatal serious injury cases (nature of injury based definition) by sex, age, and road user group

Distribution of non-fatal serious injury (length of stay based definition) by road user group.

Distribution of non-fatal serious injury (nature of injury based definition) by road user group.
Discussion
The linkage rate found in this study lies within the range of rates found by others.2,10,13,14,29 There are a number of reasons for a low linkage rate including definitional, the organisation of police records, failure to identify road traffic crashes on hospital systems, failure of the road user to report RTAs to the police, and accuracy of the linking variables.26
Reporting rates to the police have been found to vary with the following:
-
Age, with younger and older people more likely to report than those aged 25–64.13
-
Type of road user, with lower rates for cyclists.1,3,9,14,30
-
Injury severity, with reduced rates among people with less severe injuries.3
James' (1991) review estimates that 100% of fatalities were reported to the police, 76% of casualties with “serious” injury, and 62% of casualties with “slight” injury.3
In spite of some significant differences between the results for the linked data compared with the admissions data in the proportion of cases in each road user group, the results suggest that the linked non-fatal serious injury data (either definition) will provide reasonably accurate estimates of the relative magnitude of the problem for each age, sex, and road user group category. Additionally, when considering serious injuries, the identification of priority groups is unlikely to be affected by the use of linked data rather than admissions data.
These results should be interpreted with caution, however, since not all RTAs admitted to hospital could be identified. This means that the hospital admissions data used in this analysis might not fully reflect all hospital admissions for RTAs, and so this data itself might be biased. If so, the bias would not be identified in this analysis.
One reason for the difference between the distributions for police non-slight injury and hospital admissions could be due to the wider definition of a case encompassed by the police data. This includes: fracture, internal injury, severe cuts, crushing, burns, and concussion,19 some of which do not result in hospital admission.
These results suggest that investigators could be misinformed if they base their analysis of road traffic crashes solely on police RTA data. This is potentially problematic both nationally and locally. For example, these findings are important since the UK government's new road traffic accident targets31 are based on police RTA data alone and include reduction of the number killed and seriously injured (KSI) by 40% by 2010 and reduction of KSI numbers among children by 50% by 2010, from a baseline of the average figures for 1994–98.
The results reported in this paper argue for the use, by policymakers, planners and practitioners, of police RTA data in conjunction with hospital admissions data. The reasons for this are that the data collected on each system complement each other, and analyses of these data in combination appear less likely to mislead than police data on their own. Although the linked data confers this advantage, our work indicates that the linked database is biased, but that the magnitude of that bias is reduced if consideration is restricted to serious injury cases, particularly when using a length of stay definition for serious injury.
Policy implications
A national linked dataset of road traffic crash data should be produced from hospital admissions and police RTA data for use by policymakers, planners, and practitioners. (The recent introduction of postcode as a new data field on police RTA data within England means that automatic computer linkage is now feasible.) This would provide a much sounder database for government, the Department of Health, the DETR, for Local Authority Highways and Transport departments, and for public health and health promotion. Such a recommendation is consistent with a recommendation made by the Public Health Information Strategy Group.32
Government needs to reconsider their road safety targets, which are based on police RTA data, in view of the inaccuracies highlighted in these data by our and others' work.
The completeness and accuracy of external cause of injury coding on hospital admissions data within England should be improved from its current national level of 85% to over 98% and should be included in the Department of Health performance indicators for NHS hospital trusts. A minimal information requirement for injury control work is to have information on the external cause of injury (E code). The linkage of hospital admissions data to police RTA data is highly dependent on being able to identify RTA cases admitted to hospital. The E code is the key to this. Consequently for this and most other applications, the level of E coding should be as close to 100% as possible.
Key points
-
An analysis of police RTA reports alone could potentially misinform policymakers, planners, and accident prevention practitioners. These data should be analysed in conjunction with hospital admissions.
-
Information produced from a database of hospital admissions linked to police RTA reports appears biased. The bias is reduced substantially, however, when restricting consideration to casualties with serious injury defined as those who are transferred to another hospital or who have a length of stay in hospital of four or more days.
-
Our investigation suggests that information produced from a database of linked non-fatal injuries admitted to hospital is less biased than that produced from police RTA data alone.
-
Within Sussex, and most likely in the rest of England, the size of the problem of accidents to cyclists is currently being underestimated by the police, the DETR, and by Local Authority Highways and Transport departments.
The police should not assess severity of injury. There are major problems with the accuracy of the police RTA severity of injury data and an important reason for this is the difficulty of assessing severity of injury at the roadside. This should be recognised. Since more accurate measures of severity of injury can be derived from the data collected by hospitals, injury severity should be derived from this source rather than recorded by the police.
Within Sussex, and most likely in the rest of England, the size of the problem of accidents to cyclists is currently being underestimated by the police, the DETR, and by Local Authority Highways and Transport departments. This is significant because while encouraging more sustainable modes of transport (for example cycling, walking) all agencies need to have an accurate picture of road safety for vulnerable road users.
Acknowledgments
Our thanks to NHSE South East R&D Directorate, West Sussex Health Authority, East Sussex County Council, and East Sussex Brighton and Hove Health Authority who jointly funded this project.
References
Footnotes
↵* The injury must be sufficiently serious to require a hospital stay of four days or more.
↵† Injuries resulting in death within 30 days of the accident are classified as “fatal”.
↵‡ This estimate assumes that the proportion of cases with missing E codes was the same for RTAs as other causes of injury.
↵§ The usual χ2 test for a contingency table could not be used when comparing the distribution of cases because of the lack of independence of the data from the data sources being compared. These include many of the same cases.