Article Text

Abstract
Objectives—The purpose of this study was to use geographic information system (GIS) software to locate areas of high risk for child pedestrian-motor vehicle collisions in the city of Long Beach and to compare risk factors between midblock and intersection collisions.
Methods—Children 0–14 years of age involved in a motor vehicle versus pedestrian collision that occurred on public roadways in Long Beach, CA, between 1 January 1992 and 30 June 1995, were identified retrospectively from police reports. The GIS software program, ArcView, was used for spatial analysis and distance calculations. χ2 Tests were used to compare the distribution of the characteristics between intersection and midblock collisions.
Results—The average annual incident and fatality rate was 183.3/100 000 children/year and 2.4/100 000 children/year, respectively. Children less than 5 years of age were significantly more likely to be hit at a midblock location while those aged 5–9 and 10–14 were more often hit at an intersection. Intersection collisions were more likely to occur on major arterials and local streets, and the driver to be the primary party at fault (p<0.001). While intersection incidents tended to occur further from the child's home (64.4%) the majority of midblock incidents (61.5%) occurred within 0.1 miles of the child's residence. For both midblock and intersection locations, pedestrian collisions tended to occur more frequently in those census tracts with a larger number of families per census tract—a measure of household crowding and density.
Conclusions—Future studies taking into consideration traffic volume and vehicle speed would be useful to focus prevention efforts such as environmental modifications, improving police enforcement, and educational efforts targeted at parents of younger children. As GIS illustrative spatial relationships continue to improve, relationships between pedestrian collision sites and other city landmarks can advance the study of pedestrian incidents.
- child pedestrian
- geographic information system
- midblock
Statistics from Altmetric.com
In the United States, in 1996, children under the age of 15 accounted for over 35% of pedestrian victims killed and injured.1 In California, in 1996, the pedestrian fatality rate for children aged 0–15 years was 1.2/100 000 and the injury rate was 48.8/100 000. For all age groups, California has the 11th highest pedestrian fatality rate in the United States.2
An important application of injury epidemiology is to identify geographical areas and population groups that are at high risk of injury or death. Epidemiologic investigation allows the recognition of factors that lead to an increase in risk that is not necessarily the same in all population groups. Identification of high risk groups allows the selection of appropriate interventions to reduce or eliminate specific risk factors.3
Geographical maps are one way to visually examine aspects of locations not captured by variables observed directly.4 Geographic information systems (GISs) have strong links to geography, cartography, and statistics.5 GISs can integrate complex data on spatial variation of events to identify significant associations between anomalies or “hot spot”, with geographic areas requiring further fieldwork, analysis, or education outreach,6,7 or to direct and monitor policy to areas of greatest need.8 Along with epidemiology, GISs allow for the identification of high risk groups or environments in a graphic format.
Once clusters or general areas of incidents are identified, it is important to evaluate more specific characteristics of the incidents; in particular, to determine the nature of occurrence of incidents between midblocks and intersections so that prevention efforts can be better targeted. Kraus et al examined risk factors in general for pedestrian and bicycle incidents in the city of Long Beach.9 The Federal Highway Administration has conducted studies and determined that by designating the type of event, prevention for pedestrian injuries could be improved.10
The purpose of this study was to examine risk factors between pedestrian-motor vehicle collision incidents occurring at midblock and intersection locations, and, using GISs, to locate areas of high risk for these injuries.
Methods
STUDY POPULATION AND DEFINITIONS
The study population consisted of children 0–14 years of age involved in a motor vehicle versus pedestrian collision in the city of Long Beach, CA, between 1 January 1992 and 30 June 1995. Long Beach is the fifth largest city in California, encompassing an area of 50 square miles; Long Beach overlooks San Pedro Bay on the south coast of Los Angeles County, located 22 miles south of downtown Los Angeles, and 100 miles southwest of Anaheim. A child pedestrian is one who was on foot or being pushed or carried by someone who was walking at the time of impact; children in strollers or shopping carts were included. Those on skates or rollerblades were excluded. All collisions were classified as occurring either at an intersection or midblock. A midblock collision was defined and classified on the police report as a collision that occurred greater than 25 feet from the intersection. Those in alleys or on private property were excluded. Streets were classified by the City of Long Beach Department of Public Works as local, collector, minor arterials, major arterials, or regional corridors (see table 1).
Street classification—functional definition and capacity (Long Beach, CA, 1992–95*)
Cases were identified through a review of all police reports during the three and a half year study period. Data from these records were abstracted, and environmental and collision related information, including incident location, street width and primary party at fault, were collected. Demographic and child related characteristics of age, gender, ethnicity, and pedestrian action were abstracted from the reports.
GEOGRAPHIC INFORMATION SYSTEM
The GIS software program, ArcView, recognizes (that is, “matches”) information on home address and incident location and converts these data to a spatial display form. Intersection incidents were directly converted into spatial form by reading a field that contained the two intersecting street names. For midblock incidents, exact address locations were not available, so “proxy” addresses for these incidents were created using the following procedure: the nearest intersections were first read into a spatial form; GIS mapping software then identified the address range and length of the relevant block; combined with this block information and data on distance to the nearest intersection, “proxy” addresses were created for all midblock collisions. These were then converted into a spatial form.
Accurate and complete data on incident location were necessary for creating a spatial display of the collisions. Similarly, data on residence address were also required for calculating the distance between the incident and the child's home. GIS software “matched” data on residence address and location of collision and then produced a spatial display (map) of these data. “Matched” data were converted into latitude and longitude coordinates; the distance between these coordinates was then calculated using the Pythagorean theorem. GIS analysis was used to highlight areas with multiple incidents, determine distance from injury location to home, and calculate injury rates by zip code. Information on number of families per census tract was available and was utilized in the spatial presentation of collision locations.
χ2 Tests of independence, with an alpha level of 0.05, were used to compare the distribution of characteristics (as categorical variables) such as age, gender and distance from home, between intersection and midblock locations. Rates were calculated using the 1990 United States census population estimates for the city of Long Beach.
Results
There were a total of 610 motor vehicle versus pedestrian collisions during the three and a half year study period, for an annual injury rate of 183.3 per 100 000 children per year. This included eight fatal injuries—a fatality rate of 2.4 per 100 000 per year. Males had an incident rate of 223.0 per 100 000 males per year, and for females the rate was 142.1 per 100 000 per year. The age specific incident rates for children aged 0–4, 5–9, and 10–14 years were 114.5, 263.4, and 184.6 per 100 000 per year, respectively.
Collisions occurring at midblocks accounted for 380 cases (62.3%) compared with 230 (37.7%) occurring at an intersection (table 2). Midblock collisions more often involved younger children aged 0–4 (30.5%) and 5–9 (52.1%) when compared with intersection collisions (15.3% and 41.7%, respectively; p<0.001). Males were more significantly more likely (p<0.001) to be involved in a midblock collision (66.8%) than females (33.2%). The driver was recorded as the primary party at fault in 48.7% of the intersection collisions, whereas the child was determined to be at fault in 66.8% of all midblock collisions (p<0.001).
Average annual rate (per 100 000 children), number and percent of pediatric pedestrian injuries by age, gender, primary party at fault, driver action, and street classification according to intersection and midblock locations (Long Beach, CA, 1992–95)
For midblock collisions, the majority of drivers were recorded as proceeding straight at the time of impact (92.6%), while for intersection collisions, the proportion was 61.3%. An additional 29.6% were recorded as turning at the time of the collision in the intersection.
Information on street width showed that the largest proportion of incidents occurred on streets less than 35 feet in width (65.6%) which are local and collector streets. Multilane highways (regional corridors and major arterials) over 70 feet in width accounted for less than 25% of all collision locations. Over half of all incidents (54.9%) occurred on local streets, which constituted a much larger proportion of midblock (67.4%) than intersection (33.5%) collisions. Approximately a 10th of the collisions occurred on both collector streets (10.7%), and minor arterial streets (9.5%). Collisions occurring on major arterials accounted for 20.2% of all incidents; these were much more common at an intersection (37.4%) than midblock location (9.8%).
Key points
-
Geographic information system (GIS) mapping permitted identification of clusters of child pedestrian-motor vehicle collision incidents in Long Beach, California, potentially facilitating better targeting of prevention efforts.
-
Midblock collisions more often involved younger children (aged 0–4 and 5–9) when compared with intersection collisions.
-
Midblock collisions involved a much larger proportion of collisions occurring within 100 feet of the child's home when compared with intersection collisions.
-
Census tracts with more families had a higher proportion of collisions, for both midblock and intersection incidents.
-
Future studies using GIS mapping techniques that take into consideration traffic volume and vehicle speed, as well as specific characteristics pertaining to midblock or intersection locations, would be useful to focus prevention efforts.
The distribution of incidents by street classification was significantly different from that expected based on the number of miles for each street type (table 3). For intersection incidents, local streets were under-represented, while incidents that occurred on minor and major arterials were three times more frequent (27 and 86, respectively) than expected (9.9 and 23.7, respectively), based on mileage proportion. For midblock incidents, collector streets and minor arterials were over-represented, with twice the number of incidents occurring (44 and 31, respectively) there as expected (17.5 and 16.8, respectively).
Observed, expected number (and %), and ratio of pedestrian injuries by street classification (Long Beach, CA, 1992–95*)
GEOGRAPHIC INFORMATION SYSTEM ANALYSIS
GIS software “matched” data on incident location for 92.6% (352/380) of the midblock collisions and 96.1% (221/230) of the intersection cases. For the child's home address, GIS “matched” 85.5% (325/380) midblock and 83.9% (193/230) intersection collisions. In calculating distance from home, complete data on both incident location and home address were required; GIS software “matched” the combination of incident and residence location for 82.1% (501/610) of all incidents: 313 (82.4%) midblock cases and 188 (81.7%) intersection incidents.
The overall distribution of distance from home, as categorized in table 2, was significantly different between midblock and intersection collisions (p<0.001). Midblocks involved a much larger proportion of collisions occurring within 100 feet of the child's home (28.0%) when compared with intersections (6.5%). This is consistent with the fact that most homes tend to be located midblock. On the other hand, intersections involved proportionately more collisions occurring 0.1–1.0 miles from the child's home (42.2%) than midblocks (21.3%). The distribution of midblock versus intersection collisions did not significantly differ for incidents occurring one or more miles from the child's home.
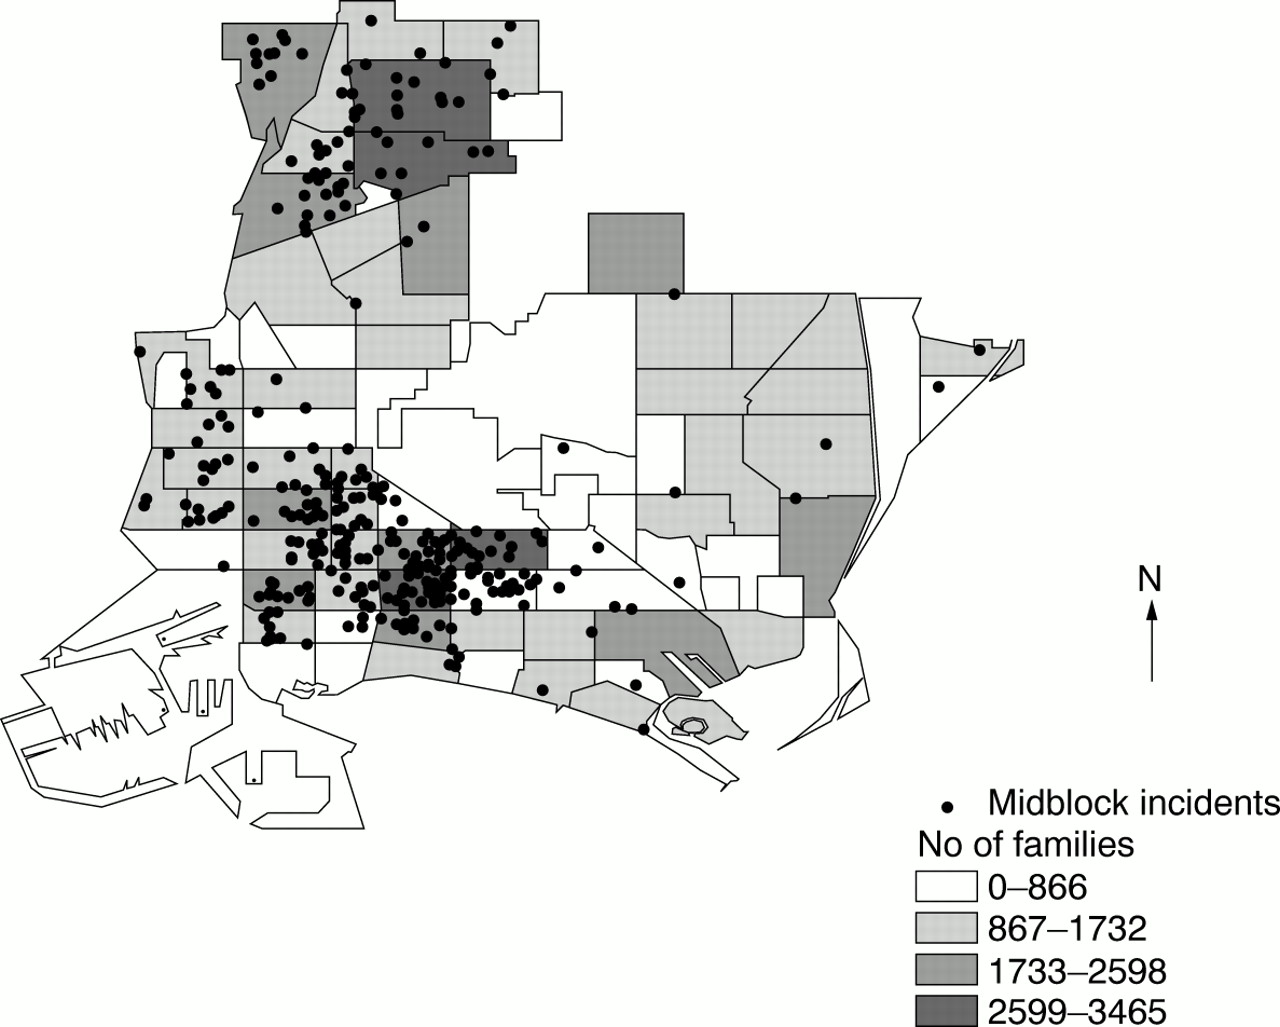
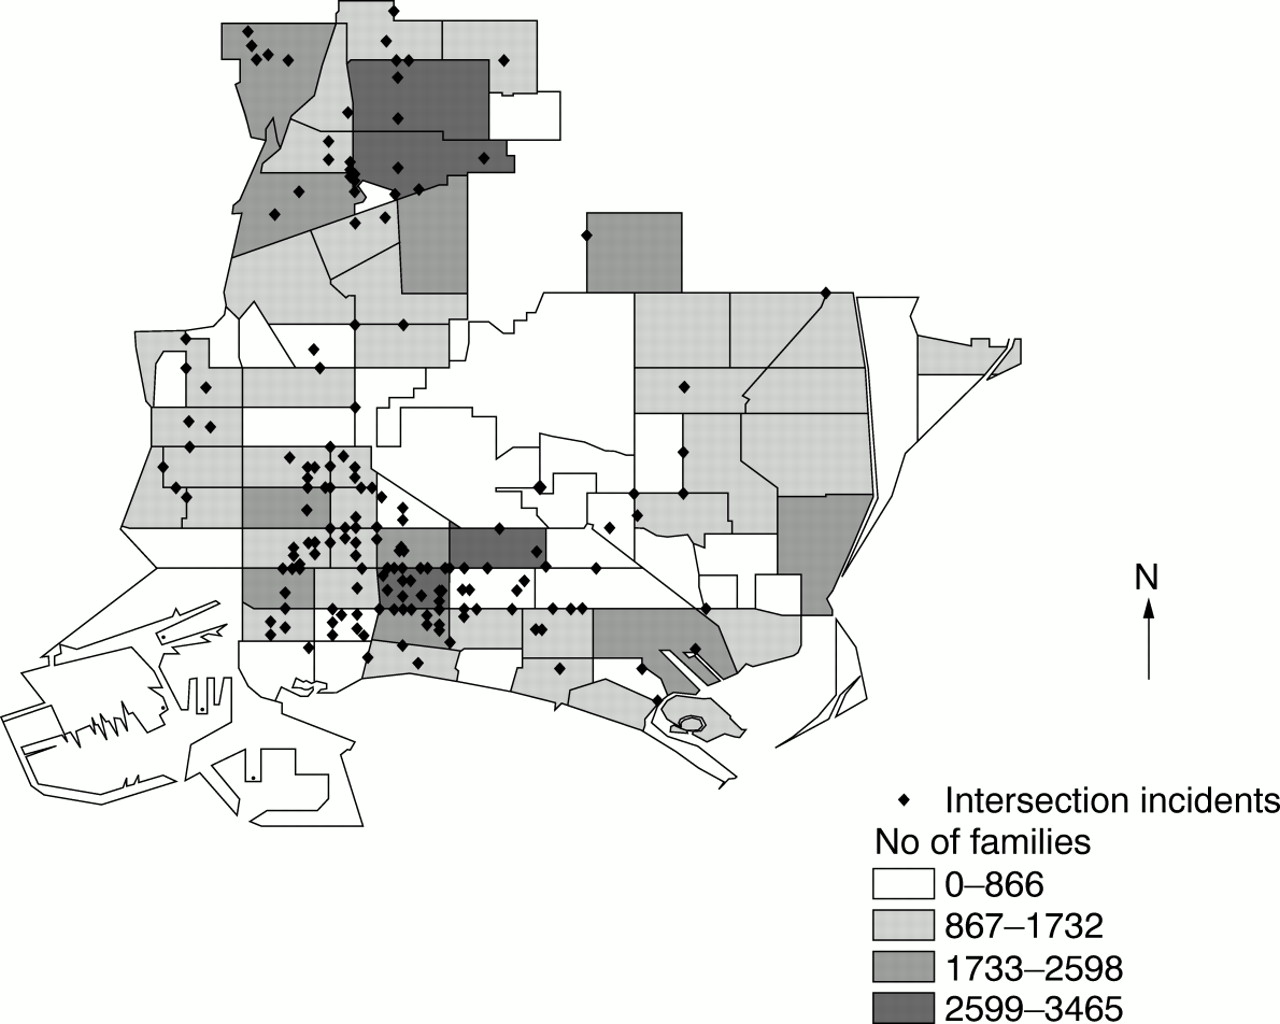
Figures 1 and 2 show locations of midblock and intersection incidents and average number of families per census tract. The majority of midblock and intersection incidents tended to cluster in the southwestern region of Long Beach city, an area with more families per census tract.

Location of intersection incidents and average number of families per census tract (Long Beach, CA, 1992–95).

Location of midblock incidents and average number of families per census tract (Long Beach, CA, 1992–95).
Figure 3 displays the average incidence rates by postal code. A significant difference (p<0.001) was found in the distribution of intersection incidents compared with midblock incidents. The highest incidence rates (315.6 per 100 000 children per year) were noted in postal codes in the southwestern region of Long Beach, and the lowest injury rate (25.3 per 100 000 children per year) in the northeastern area.
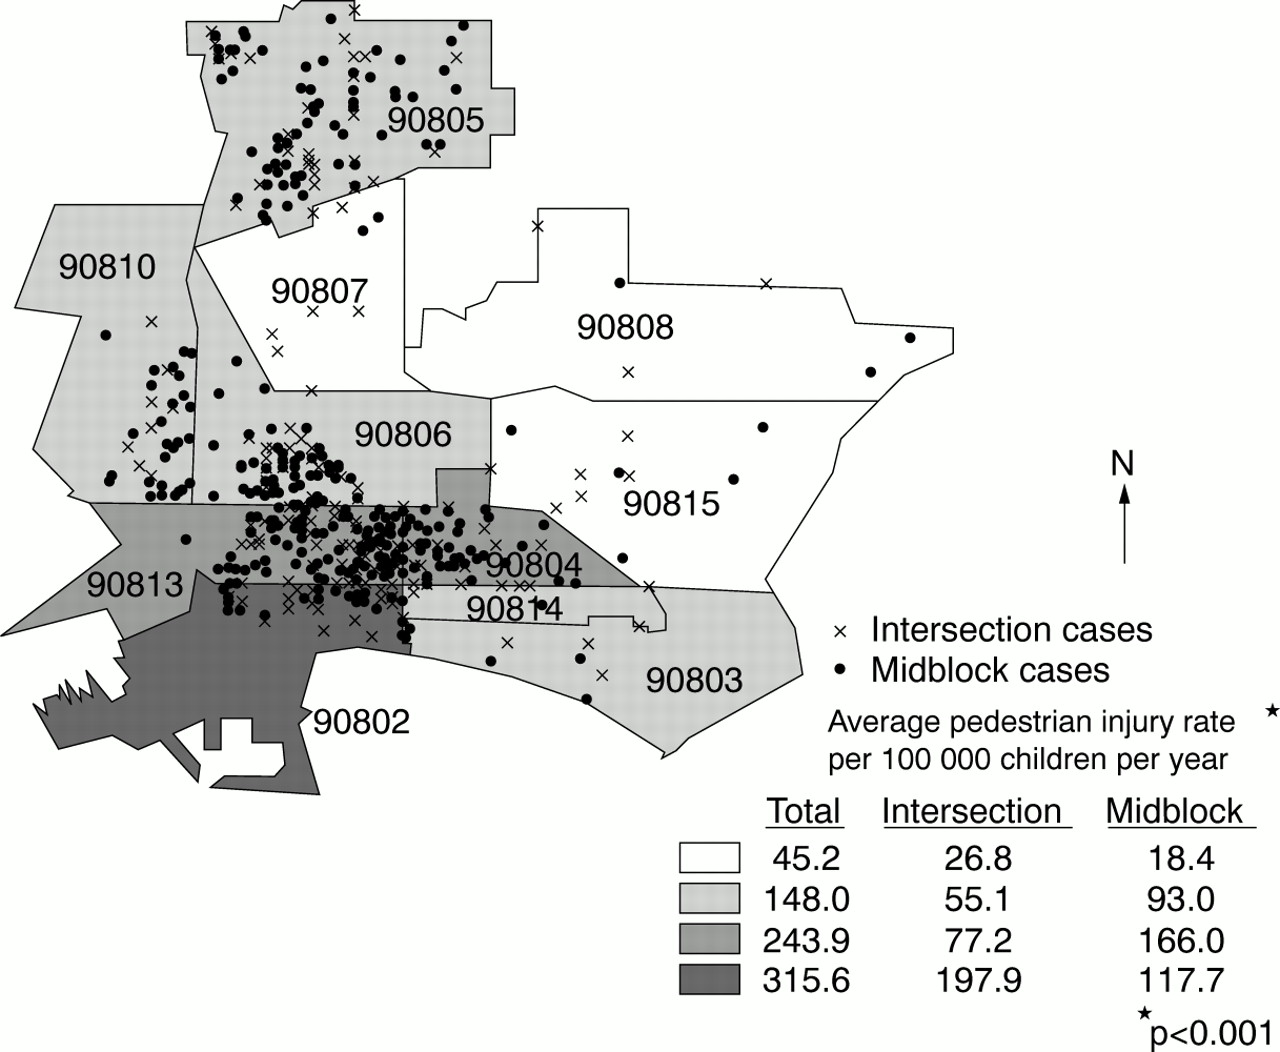
Average midblock and intersection incident rates by postal code (Long Beach, CA, 1992–95).
Locations in which multiple incidents occurred during the study period are displayed in fig 4. Multiple cases occurred at 31 different intersections. Two of which involved four cases each. There were 25 blocks with more than one midblock pedestrian incident in the same block. Three of which had three midblock incidents each. The southwestern region accounted for the majority of these multiple incident locations.

Locations of multiple midblock and intersection incidents (Long Beach, CA, 1992–95).
Discussion
Findings in this study on the occurrence of incidents by location, age, and gender were found to be similar to those of other studies.9,11,12 Though our findings of an incident rate of 183.3 per 100 000 children per year is approximately 3.8 times higher than the California rate of 48.8/100 000 per year. Midblock incidents occurred more frequently than intersection incidents and often involved children too young to cross even quiet residential streets safely. Additionally, we found that incidents often occur close to the child's home, consistent with studies reporting that just over half occur in the street next to the residence13; and one quarter occur by the home.14 Studies have found that a large proportion of incidents within a short distance of the child's residence, occur when the child darted out into the street during play.12,15–20
This study revealed that two thirds of midblock incidents occurred on streets less than 35 feet in width, while the majority of intersection incidents occurred on streets over 70 feet in width. One study that used number of street lanes as a proxy for street type, reported similar results.12 Other studies found that roads with greater than two lanes were associated with an increased risk of pedestrian injury.16,21 One study reported that less than half of the midblock incidents occurred on the first half of the road (closer to the curb), one quarter on the second half.11
The majority of vehicles were proceeding straight (rather than turning into or backing out of driveways or backing to park) at the time of midblock collisions. For intersection incidents, most vehicles were proceeding straight, but turning was a factor in about one third of the cases. Right turn on red has frequently been identified as increasing pedestrian risk.22 Future studies evaluating the direction of the turn and stage of the traffic signal could result in avenues of prevention.
The number of families per census tract appears to be an important factor in the identification of pedestrian-motor vehicle collisions. GIS analyses revealed that census tracts with more families had a higher collision frequency, for both midblock and intersection incidents. Rivara and Barber reported a significant positive association between pedestrian injuries and different measures of household crowding, including household size, number of persons per room, and number of households per acre.23
Implications for prevention
Future studies that take into consideration traffic volume and vehicle speed, as well as specific characteristics within each area, would be useful to focus prevention efforts. Potential interventions include the following: education of practical training methods aimed at school aged children in areas of crowding; environmental modification to decrease traffic flow, improvement of intersection crossing times and increasing pedestrian visibility, improving police enforcement of vehicle speed laws and adherence to traffic signs, increasing warning signs and crossing signals, as well as educational efforts targeted at parents of younger children and developing off-street playgrounds.24
As GIS techniques continue to improve, relationships between pedestrian collision sites and other city landmarks (for example, playgrounds, stores, shopping malls) can advance the study of pedestrian incidents. GISs have emerged as powerful exploration and modeling techniques for health data. In this context, GISs should be considered as one of the existing technologies that facilitate information and decision making processes in the health services.
Acknowledgments
The authors thank the following for their assistance in this study: Peter Corpuz and Linda Thompson of the Long Beach Department of Public Works; John Kile, John Senteno and the Medical Records staff at St Mary Medical Center; and Patty Conn at Long Beach Memorial Hospital. We also thank Connie Heye, Anna Chow, and Dawn Robertson for their work in data management, coding, and analysis, and Marizen Ramirez for her help in generating the finalized version of the maps.
This work was supported by the Southern California Injury Prevention Research Center, a CDC funded national research center (grant #R49/CCR903622–11).