Article Text

Abstract
Objective To advance the interpretation of the ‘safety in numbers’ effect by addressing the following three questions. How should the safety of pedestrians be measured, as the safety of individual pedestrians or as the overall safety of road facilities for pedestrians? Would intersections with large numbers of pedestrians exhibit a favourable safety performance? Would encouraging people to walk be a sound safety countermeasure?
Methods We selected 288 signalised intersections with 1003 pedestrian crashes in Hong Kong from 2010 to 2012. We developed a Bayesian Poisson-lognormal model to calculate two common indicators related to pedestrian safety: the expected crash rate per million crossing pedestrians and the expected excess crash frequency. The ranking results of these two indicators for the selected intersections were compared.
Results We confirmed a significant positive association between pedestrian volumes and pedestrian crashes, with an estimated coefficient of 0.21. Although people who crossed at intersections with higher pedestrian volumes experienced a relatively lower crash risk, these intersections may still have substantial potential for crash reduction.
Conclusions Conclusions on the safety in numbers effect based on a cross-sectional analysis should be reached with great caution. The safety of individual pedestrians can be measured based on the crash risk, whereas the safety of road facilities for pedestrians should be determined by the environmental hazards of walking. Intersections prevalent of pedestrians do not always exhibit favourable safety performance. Relative to increasing the number of pedestrians, safety strategies should focus on reducing environmental hazards and removing barriers to walking.
- engineering
- pedestrian
- statistical issues
Statistics from Altmetric.com
Introduction
Injuries involving pedestrians and bicyclists have become a considerable public health concern worldwide.1 2 Numerous studies have been devoted to investigating the relationship between the number of pedestrian or bicycle-related traffic crashes and risk factors.3–18 A significant positive association has been reported between the number of people walking or bicycling and the frequency of pedestrian or bicycle crashes.3–16 More importantly, a non-linear relationship has consistently been found, which suggests that the absolute number of crashes increases as the increase in pedestrians or bicyclists, whereas the risk faced by each individual pedestrian or bicyclist decreases (see online supplementary table). This is referred to as ‘safety in numbers’ (SIN).19 20 One plausible explanation for this finding is that motorists adjust their behaviour when they encounter a group of people walking and bicycling. This hypothesis is evidenced by the greater visibility of pedestrians and bicyclists in greater numbers.21
Supplementary file 1
The motivation of SIN is to reduce the conflict between the promotion of walking and bicycling to reap the health benefits of outdoor physical activities and the discouragement of walking and bicycling to avoid injuries.16 21 As a motorist is less likely to collide with a pedestrian or bicyclist when more people are walking or bicycling, policies that encourage walking and bicycling are claimed as effective measures to improve the safety of pedestrians and bicyclists.3 19 22
Arguably, if we focus on the overall safety of the system, a simple increase in the number of people walking or bicycling would undoubtedly result in more pedestrian or bicyclist casualties. Bhatia and Wier23 also cautioned that treating the promotion of walking or bicycling as a safety intervention would mask efforts to create an inherently safe environment for all pedestrians and bicyclists.
The continuous debate over the SIN effect may be due to the disparate understanding of safety for pedestrians and bicyclists. Jacobsen et al 21 measured safety as the risk of injury to a specific group of road users, whereas Bhatia and Wier23 addressed the safety of the whole transportation system, focusing on the total number of injuries suffered by pedestrians and bicyclists. Based on a comprehensive data set of 1003 pedestrian crashes at 288 signalised intersections in Hong Kong, we intend to advance the interpretation and implementation of the SIN effect by answering the following three questions.
How should the safety of pedestrians be measured, as the safety of individual pedestrians or as the overall safety of road facilities for pedestrians?
Would intersections with large numbers of pedestrians exhibit a favourable safety performance?
Would encouraging people to walk be a sound safety countermeasure?
The remainder of this paper is organised as follows. After a brief description of the data structure, a Bayesian Poisson-lognormal model for pedestrian crash frequency is introduced, by which two common measures related to pedestrian safety, the crash rate per million crossing pedestrians and the expected excess crash frequency, can be calculated. The rankings based on these two indicators are compared, followed by a discussion and suggestions for the proper interpretation and application of the SIN effect.
Methods
Data sources
We took advantage of a comprehensive set of traffic impact assessment reports for 2010 and 2011 for sample selection. The traffic impact assessment was conducted for planning and design purposes and did not investigate the crash records of the intersections. We therefore assumed no marked biases in the sample process. A total of 288 signalised intersections with adequate traffic and geometric information were available for analysis, which accounted for 17.4% of the signalised intersections in Hong Kong.
The crash data were obtained from the Traffic Road Accident Database System maintained by the Hong Kong Police Force and the Hong Kong Transport Department. These data were collected by the police officers at the scene of the crash. Only crashes that resulted in injuries were recorded in the database. With the available location information, we first mapped crashes onto an ArcGIS map and then validated their locations with a procedure developed by Loo.24 In Hong Kong, intersection crashes were those defined by the police as occurring within 70 m of the centreline of an intersection.25 Overall, 1003 motor vehicle–pedestrian crashes were reported at the selected intersections from 2010 to 2012.
The average daily traffic at the intersections was estimated based on the peak-hour vehicle flows obtained from the Hong Kong Transport Department and the 24-hour vehicle traffic volumes at the nearest counting stations reported in the Annual Traffic Census. The number of crossing pedestrians, represented as the average daily crossing pedestrians, was estimated based on the 24-hour zonal pedestrian flow profiles extracted from the Travel Characteristics Survey 2011 database and was further adjusted by the field observations. Details of the estimation of vehicle and pedestrian volumes were given by Xie.25
The intersections’ geometric features were extracted from the Intelligent Road Network Package provided by the Hong Kong Transport Department. These factors included the number of approaches, the number of approach lanes, the average lane width, the number of traffic streams, the number of pedestrian streams and the number of pedestrian-vehicle conflict points. To control for more confounders, each intersection was further virtually audited using Google Street View.17 Most imagery for the intersections of interest was captured by Google during February 2011 and December 2011. We determined the presence of playgrounds and schools according to whether these facilities were present in any approach of the studied intersections, whereas other characteristics were measured within 70 m of the intersection. The data for the signal phasing scheme were manually measured onsite.
The characteristics of the 288 selected signalised intersections are presented in table 1.
Characteristics of the 288 signalised intersections under investigation
Statistical analyses
We modelled the frequency of pedestrian crashes at each intersection, consistent with previous studies.3–5 7 8 10 15 20 Let  denote the number of pedestrian crashes at the
  intersection from 2010 to 2012. Pooling crash data over a 3-year period helps to avoid the confounding effects and regression-to-the-mean phenomenon.26 Given the random, non-negative and integral nature of crash counts, we have:

 (1)
(1)
where  refers to the parameter of the Poisson model.
e
is the base of natural logarithm.
refers to the parameter of the Poisson model.
e
is the base of natural logarithm.  and
and  denote the average daily traffic and crossing pedestrians, respectively.
  is the vector of explanatory variables related to the characteristics of intersections.
  ,
,  ,
,  and
and  are the parameters to be estimated. An estimate of
  between 0 and 1 suggests that the increase in pedestrian crashes is less than linear with the increasing pedestrian volumes.
  accounts for the overdispersion due to unobserved factors and is specified as an exchangeable normal prior distribution, that is,
  .
.
Obtaining the full Bayesian posterior estimates requires specification of prior distribution. A vague normal prior,  , was applied to
  ,
,  ,
,  and
and  .18 The variance parameter
  was assigned as a uniform distribution,
  .27 28
To account for biases due to unobserved heterogeneity, measurement errors in the estimates of vehicle and pedestrian volumes, and spatial dependence between neighbouring intersections, in addition to the basic Poisson-lognormal model, we developed random parameters,29 measurement errors30 and spatial models.18 To avoid highly correlated variables included in a model, we computed the variance inflation factor31 to check for multicollinearity. The deviance information criterion32 was used to compare alternative models with different covariates. A model with a lower deviance information criterion value was superior.
Once the best model was identified, the crash risk for people crossing at intersection i was calculated as the expected crash rate per million crossing pedestrians:
 (2)
(2)
If we focus on the burden of pedestrian crashes for the whole system, the performance of intersections could be reflected by the expected number of pedestrian crashes. One may argue ‘the high casualties are likely due to the prevalence of walkers.’21 In this regard, the expected excess crash frequency (also known as the potential for safety improvement; PSI) was adopted to determine whether intersection i experienced more pedestrian crashes than those with similar characteristics (ie, whether intersection i exhibited abnormally high random effects)33 34:
 (3)
(3)
Intersections with a PSI value greater than 0 at the 95% confidence level could be regarded as having substantial potential for crash reduction.34 All calculations for model specification, calibration and comparison were made using the freeware WinBUGS.35
Results
Our correlation test indicated a high correlation between the number of approach lanes and the number of traffic streams, with variance inflation factors estimated at 8.02 and 7.11, respectively. Other variables showed weak collinearity, as their variance inflation factors ranged from 1.14 to 3.37. In the initial model, we included all uncorrelated variables. A 5% level of significance was used to determine whether the parameter estimates differed from 0. Insignificant variables were removed from the final model.
We estimated the random parameters,29 measurement errors30 and spatial models18 for comparison. The estimated coefficients and deviance information criterion of the three models were very similar to those derived from the Poisson-lognormal model, indicating that our data were fairly robust to the model configuration. For simplicity, we present only the results for the Poisson-lognormal model here.
Table 2 summarises the parameter estimates in the Poisson-lognormal model. Six variables had a significant association with the occurrence of pedestrian crashes: the average daily traffic, the average daily crossing pedestrians, the presence of pedestrian signals for all crosswalks, curb parking, ground floor shops and playgrounds. The signs of these parameters were generally consistent with empirical judgements and the results of previous studies.2 36 37
Estimated parameters of Poisson-lognormal model for pedestrian crash frequency at the 288 signalised intersections
Specifically, both pedestrian and vehicle volumes were highly significant and positive, with coefficients estimated at 0.21 and 0.27, respectively. Our estimates were much lower than those reported by Elvik and Bjørnskau,20 suggesting a stronger SIN effect.
Table 3 lists the top 14 (ie, top 5%) intersections ranked by PSI. The corresponding rankings by crash risk are also presented for comparison. A significant difference in the orders can be observed. For example, intersection 183 had the highest PSI value of 9.24. The probability of its PSI being greater than 0 was 100%. However, this intersection ranked 139th with 0.13 expected crashes per million crossings, exhibiting a favourably low crash risk.
Top 5% signalised intersections ranked by pedestrian crash risk and PSI
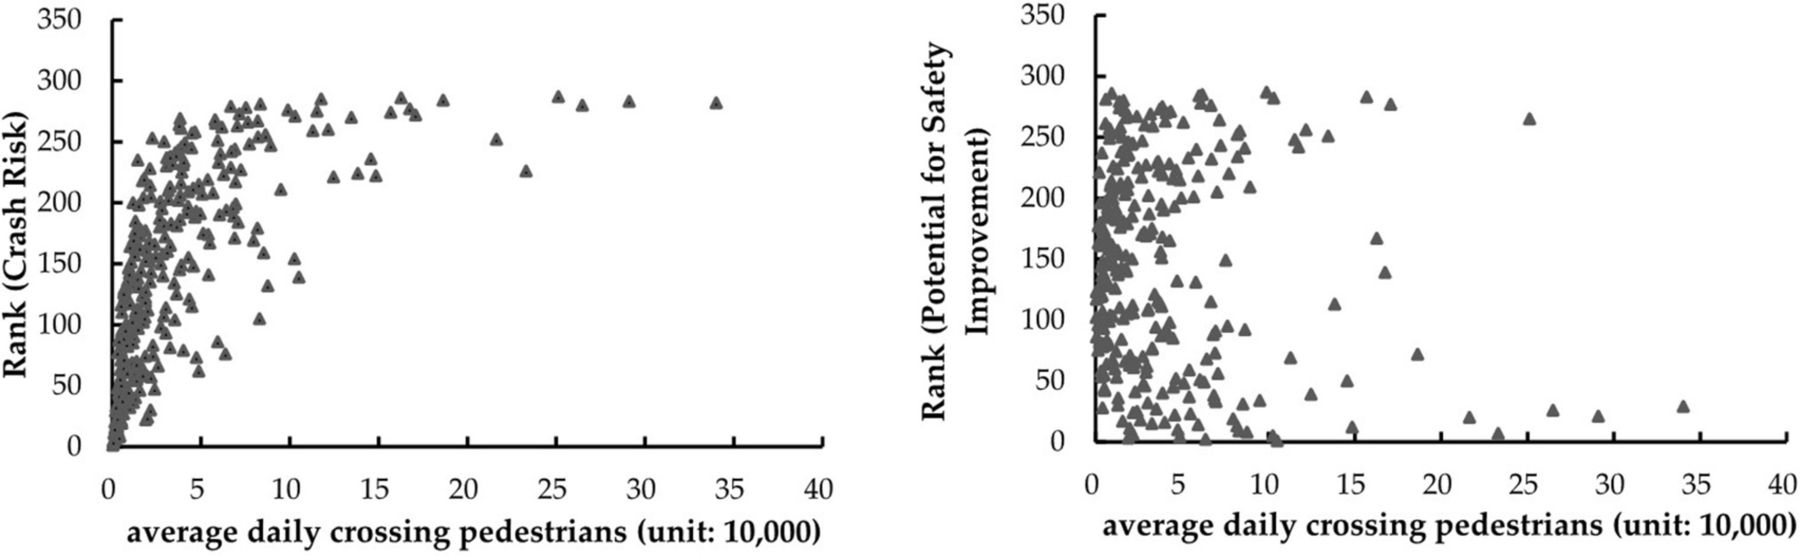
Moreover, as shown in table 3, intersections without pedestrians seem to rank first in terms of crash risk. To further test this hypothesis, figure 1 illustrates the relationship between pedestrian volumes and ranking orders for the 288 intersections. A significant positive correlation was found between the average daily crossing pedestrians and the rankings by crash risk, with a Spearman’s rank correlation parameter31 of 0.81. This parameter became insignificant (ie, −0.05) for rankings based on PSI and the average daily crossing pedestrians.
The relationship between average daily crossing pedestrians and ranking orders for the 288 signalized intersections.
Discussion
We confirm the non-linear statistical relationship between the number of people crossing at an intersection and the number of crashes involving pedestrians. The coefficient for the average daily crossing pedestrians was estimated at 0.21 with the 95% CI (0.12 to 0.31), suggesting that the number of pedestrian crashes increased, whereas the crash risk for each individual pedestrian decreased as the number of pedestrians increased. Jacobsen19 attributed this non-linear relationship to behaviour modification by motorists when they experienced more people walking (ie, more walkers result in safer walking).
However, this causation should be interpreted with great caution, as sites with more walkers may actually be safer. Indeed, pedestrians typically have a strong preference for sites with lower traffic volumes, lower traffic speeds, and better segregation between walkers and motorists.22 As a result, intersections with many pedestrians are likely to be those with favourable facilities. In other words, a safe waking environment attracts more people to walk. That is, safety produces numbers. In addition, due to our inability to control for all relevant confounding factors, this non-linear relationship between pedestrian volumes and pedestrian crashes might be a merely statistical artefact. Although we took advantage of Google Street View to extract more than 20 variables related to pedestrian facilities, several potential confounders could not be included. For example, we failed to accommodate vehicle speeds and the demographic characteristics of pedestrians who crossed at our sampled intersections. Another issue ignored in previous studies is the accuracy of the estimated volumes of pedestrians and bicyclists. Few transportation agencies regularly collect these data for a large number of sites due to limited resources. The number of pedestrians or bicyclists is thus mostly estimated based on a short period of observation.15 The measurement errors introduced in this process may bias the parameter estimates.30 In this study, we considered the model suggested by El-Basyouny and Sayed30 to address the potential measurement errors in pedestrian volumes. Our results indicate that the estimated coefficient for pedestrian volumes was consistent and robust.
The emergence of the SIN effect enhances our understanding that the number of crashes suffered by pedestrians is not a perfect indicator of the danger of walking.21 Pedestrian safety seems to be better measured by crash risk.21 Our results found that people who crossed at intersections with more pedestrians experienced a relatively lower crash risk. One hypothesis to be verified is that pedestrians at intersections with higher pedestrian volumes are more likely to cross the street in a group. This practice makes pedestrians more visible. Motorists may also lower their speeds when they see a mass of people crossing the street together.
The crash rate per crossing pedestrian was used to quantify the danger when crossing at a particular location.38 Specific attention should be paid to this point, as an ecological fallacy would occur if one attempts to apply inferences derived from a group to an individual.39 Meanwhile, using an average metric to evaluate the danger for all pedestrians cannot differentiate the risks sustained by a particular subgroup. In this situation, the vulnerability of some pedestrians (eg, the elderly and intoxicated) may be overlooked.
Local governments routinely use crash risk to rank sites for road traffic safety diagnosis.40 If we rank the intersections by the expected crash rate per million crossing pedestrians, one interesting finding is that intersections without pedestrians are more likely to be identified as hazardous. Alternatively, if we set a reduction in the total number of pedestrian crashes as the goal, focusing solely on intersections with an elevated crash risk act little to alleviate the heavy burden of deaths and injuries suffered by pedestrians, as intersections with a higher crash risk do not always present a PSI significantly greater than 0. Accordingly, the intersections with a lower crash risk but a higher PSI value would be excluded, although these intersections have substantial potential for crash reduction. Note particularly that unlike crash risk, the PSI of an intersection has an insignificant relationship with the number of pedestrians. That is, intersections with more pedestrians may also generate undesirable pedestrian crashes compared with their counterparts with similar characteristics.
Unlike the safety of each pedestrian, the safety of road facilities for pedestrians should not be determined by the number of people walking. Instead, it should depend on the environmental hazards for walkers. This proposition fits well with the consensus that traffic-related casualties are preventable via modification of the built environment. Hauer41 defined the safety of a road as ‘the frequency and severity of crashes expected to occur on it.’ Following this recognition, based on the strength of a crash prediction model, the expected excess crash frequency can be used to identify which sites should be targeted to achieve a substantial reduction in the number of crashes.
In terms of safety policymaking, the widespread implementation of the SIN effect seeks to promote walking.19 This proposal is supported because motorists more easily detect pedestrians in greater numbers.21 However, if we turn to the safety performance of the road system, sites with different characteristics have different hazard levels. Encouraging people to walk at these sites would expose more people to hazardous environments and result in more casualties. Therefore, the promotion of walking must be accompanied by consistent safety improvements of road facilities. One hypothesis underlying SIN effect is that individual pedestrians will achieve some safety benefits if they walk together. From a social equity perspective, should walking alone be more risky? Can we call for people to walk together to protect their own safety? Instead of encouraging people to walk in groups to draw motorists’ notice, alternative countermeasures such as making crosswalks more visible and installing in-pavement flashing lights to warn drivers when pedestrians are present may be effective ways to improve the detectability of people when they walk alone.
Like attributable risk that addresses the effects of an intervention in absolute terms rather than in terms of relative risk,42 safety interventions should primarily aim to reduce the number of deaths and injuries due to traffic crashes.23 Therefore, a simple increase in the number of people walking does not seem to be a sound countermeasure. Safety strategies for pedestrians should focus on reducing environmental hazards and removing barriers to walking. Fortunately, studies have empirically demonstrated the effectiveness of several design modifications, such as traffic calming, separation of pedestrians from vehicles, and increasing the visibility and conspicuity of pedestrians, at reducing pedestrian casualties.2 36 37 More repetitive analysis is desired to achieve an explicit understanding of the environmental determinants of pedestrian crashes.2
We summarise several main conclusions as follows:
Conclusions regarding the SIN effect based on a cross-sectional research design should be interpreted with great caution because it is impossible to determine whether the SIN effect is a causal relationship or merely a statistical association.
The safety of individual pedestrians can be quantified by the crash risk, whereas the safety of road facilities for pedestrians should be determined by the environmental hazards of walking.
Intersections with many pedestrians do not always exhibit a favourable safety performance. The expected excess crash frequency can be used to identify which sites should be targeted to reduce the number of pedestrian crashes.
Encouraging people to walk should not be treated as an effective safety measure. Safety policies for pedestrians should focus on reducing environmental hazards and removing barriers to walking.
What is already known on the subject
A non-linear relationship has been reported between the number of people walking and the frequency of pedestrian crashes.
Motorists are less likely to collide with a pedestrian when more people are walking.
What this study adds
Conclusions regarding the safety in numbers effect based on a cross-sectional analysis should be interpreted with great caution.
Although people at intersections with higher pedestrian volumes experience a lower crash risk, these intersections may still have substantial potential for crash reduction.
Safety strategies for pedestrians should focus on reducing environmental hazards and removing barriers to walking.
Acknowledgments
The authors thank the Hong Kong Police Force and the Hong Kong Transport Department for providing the database used for this study.
References
Footnotes
Contributors PX and SCW identified the research gap. SX and PX collected the data. PX analysed the data, designed the model, drafted the manuscript and made the revision for submission. SCW, ND and HH provided comments on earlier drafts and made editing corrections. All of the authors have read and approved the manuscript.
Funding This work was jointly supported by the Joint Research Scheme of National Natural Science Foundation of China/Research Grants Council of Hong Kong (Project Nos. 71561167001 and N_HKU707/15). SCW was also supported by the Francis S Y Bong Professorship in Engineering.
Competing interests None declared.
Ethics approval Human Research Ethics Committee for Non-Clinical Faculties, The University of Hong Kong.
Provenance and peer review Not commissioned; externally peer reviewed.
Data sharing statement The data sets are owned and were made accessible to the authors by the Hong Kong SAR Government.