Article Text

Abstract
Objectives—To compare the extent, distribution, and nature of fatal occupational injury in New Zealand, Australia, and the United States.
Setting—Workplaces in New Zealand, Australia, and the United States.
Methods—Data collections based on vital records were used to compare overall rates and distribution of fatal injuries covering the period 1989–92 in Australia and the United States, and 1985–94 in New Zealand. Household labour force data (Australia and the United States) and census data (New Zealand) provided denominator data for calculation of rates. Case definition, case inclusion criteria, and classification of occupation and industry were harmonised across the three datasets.
Results—New Zealand had the highest average annual rate (4.9/100 000), Australia an intermediate rate (3.8/100 000), and the United States the lowest rate (3.2/100 000) of fatal occupational injury. Much of the difference between countries was accounted for by differences in industry distribution. In each country, male workers, older workers, and those working in agriculture, forestry and fishing, in mining and in construction, were consistently at higher risk. Intentional fatal injury was more common in the United States, being rare in both Australia and New Zealand. This difference is likely to be reflected in the more common incidence of work related fatal injuries for sales workers in the United States compared with Australia and New Zealand.
Conclusions—The present results contrasted with those obtained by a recent study that used published omnibus statistics, both in terms of absolute rates and relative ranking of the three countries. Such differences underscore the importance of using like datasets for international comparisons. The consistency of high risk areas across comparable data from comparable nations provides clear targets for further attention. At this stage, however, it is unclear whether the same specific occupations and/or hazards are contributing to the aggregated industry and occupation group rates reported here.
- occupational injury
- fatality
- international comparisons
Statistics from Altmetric.com
Statistical collections of workplace fatal injury data have a critical part to play in identifying hazards and, consequently, in identifying the most appropriate targets for prevention. They also have a critical role in benchmarking national occupational health and safety performance. In recent years, periodic or ongoing collections of data on workplace fatal and non-fatal injuries have been reported in an increasing number of countries.1–5 These datasets have focused almost exclusively on internal comparisons of nature and distribution of injury events and only rarely on international comparisons, for example, Stout et al6 and Ore and Stout.7
However, international comparisons of statistical collections can add considerable value to these data and the part they play in both identifying research priorities and in assessing a country's performance. International comparisons can provide unique insights into the influence of geographic, social, economic, and political factors on different hazards and how they come about. From examination of similarities and differences in the circumstances of fatal injuries between comparable countries, possible directions for prevention can be identified. For example, more effective control of hazards in one of several comparable countries, identified through a lower rate of fatal injury, can prompt the question: what is being done in that country that is not being done elsewhere? Thus, international comparisons have the potential to be a powerful catalyst for change: in areas where a given country's performance is poor, comparisons can stimulate change; in areas where comparisons indicate that a given country performs well, it may be possible to transfer effective practices to other areas. Finally, international comparisons can inform the best ways of recording, analysing, and applying surveillance data.
Despite these potential benefits, to date, there have been few international comparisons of work related fatal injury data. Those that have been undertaken typically examine international published data and simply use these to draw comparisons. This practice has serious shortcomings, however. At best, such comparisons are poor estimates while at worst they are misleading about similarities and differences between countries. Stout et al, comparing Australian and United States fatal injury experience, highlighted the serious impediments to making accurate comparisons6: differences in case ascertainment, inconsistent case definitions, and inconsistent classification of occupation and industry variables, making the comparison of rates very problematic. The issue then, is to undertake accurate informative comparison of work related fatal injury experience among comparable countries, in order to harness the potential benefits that such comparisons offer.
The present paper describes the method and overall findings of a study designed to compare the extent, nature, distribution, and external causes of occupational fatal injuries in three countries: the United States, Australia, and New Zealand. Subsequent analyses will examine in more detail agents and mechanisms of injury, coding differences in the three countries, and comparison of specific high risk settings.
Methods
DATA SOURCES
Although New Zealand and Australia currently have no ongoing work related fatal injury surveillance, both countries have recently undertaken purpose specific studies based on vital records.2, 4 These provided recent data comparable to those routinely collected from vital records in the United States. Full details of how cases were ascertained are available elsewhere.2, 4, 5
Both the Australian and New Zealand datasets came from coroners' records from a period of years: four years in Australia (1989–92 inclusive) and 10 years in New Zealand (1985–94 inclusive). The Australian dataset included cases from all states and territories. The United States data came from the ongoing National Traumatic Occupational Fatalities (NTOF) surveillance system which are derived directly from the death certificates of all states and the District of Columbia. The data in NTOF by year and age group covered the period 1989–92 inclusive, however the analyses by industry and occupational group are limited to the years 1990–92 inclusive. The New Zealand dataset included all deaths nationally. The period 1989–92 inclusive was selected as the comparison period for Australia and the United States because it was the common period available for all three datasets. The entire 10 year period available in the New Zealand dataset was used in order to optimise the number of deaths available to include in the comparison.
Each of the datasets was designed to be a national census of all occupational fatal injuries, covering self employed persons and employees, although there are indications of under-reporting in the United States dataset.5, 8, 9 Limitations of death certificates for ascertainment of work related fatalities have previously been described.5, 10–12 Limited or incomplete information on the death certificate and variation in certifier interpretation of the “injury at work?” item contribute to an estimated under count of occupational injury deaths of between 10% and 30%.5, 12 Comparisons between NTOF and other sources show broad results on cause of death are similar (National Institute for Occupational Safety and Health, unpublished data).
Denominator data for calculating rates in the Australian dataset were provided by quarterly labour force surveys of the population 15 years and over, conducted by the Australian Bureau of Statistics during the relevant period. Similarly, Bureau of Labor Statistics Annual Household Survey data were used to estimate persons at risk in the United States. In New Zealand, census data were used.
DATA COMPARABILITY
Two main impediments compromised the comparability of the datasets.
(1) Case classification and definition
The relevant deaths were differently defined in each country's data. To provide comparable final datasets for analysis, the same inclusion and exclusion criteria were applied to both fatality (numerator) and labour force (denominator) data from each country (see table 1). The most notable difference between the datasets concerned deaths due to motor vehicle traffic crashes (MVTCs), the leading activity involved in work related fatal injuries.3, 5 The Australian dataset was most comprehensive, including both crashes that occurred in the course of work and those that occurred in the course of commuting to/from work. The United States dataset included crashes only during the course of work. The New Zealand dataset did not include any deaths due to MVTCs, reflecting the current status of data collection there.
Case selection criteria: United States, Australia, and New Zealand
(2) Classification of occupation and industry
The classification systems for industry and occupation in both the numerator and denominator data for each country were based on the same international classification systems and were therefore quite similar. However, a number of important differences between the classifications, even at the most aggregated levels of classification, required a range of strategies such as recoding some categories and collapsing other categories. For example, logging deaths were coded in manufacturing for the United States and in agriculture, forestry, and fishing elsewhere, and represented an 18.4% undercount in the latter division for the United States, which therefore needed to be recoded.
Complete comparability was achieved for industry classification of cases at the one digit level of aggregation. Classification of occupation of cases was more difficult to harmonise entirely, even at the one digit level of aggregation. Less than 2% of cases overall per country, and less than 8% of cases in any division (zero for most divisions) remained misclassified by occupation after the codes were mapped into the harmonised occupation divisions. This process did not take into account that application of the occupation classification may not be equivalent in the three countries at the time of coding.
In all countries, the labour force data were collected separately by a different agency and typically provided in aggregated form, making direct manipulation of the labour force (denominator) data more difficult. Nevertheless, all of the adjustments identified for classification of occupation and industry of cases were also achieved for the denominator data. There may still be some bias in the final rates obtained due to inconsistencies being present in the denominators, when there were few or no cases from a group.
ANALYSIS
Rates per 100 000 workers were calculated where appropriate. Adjustment of overall rates for differences in industry distribution was performed using direct standardisation,13 and compared with each country's population used as the standard.
Results
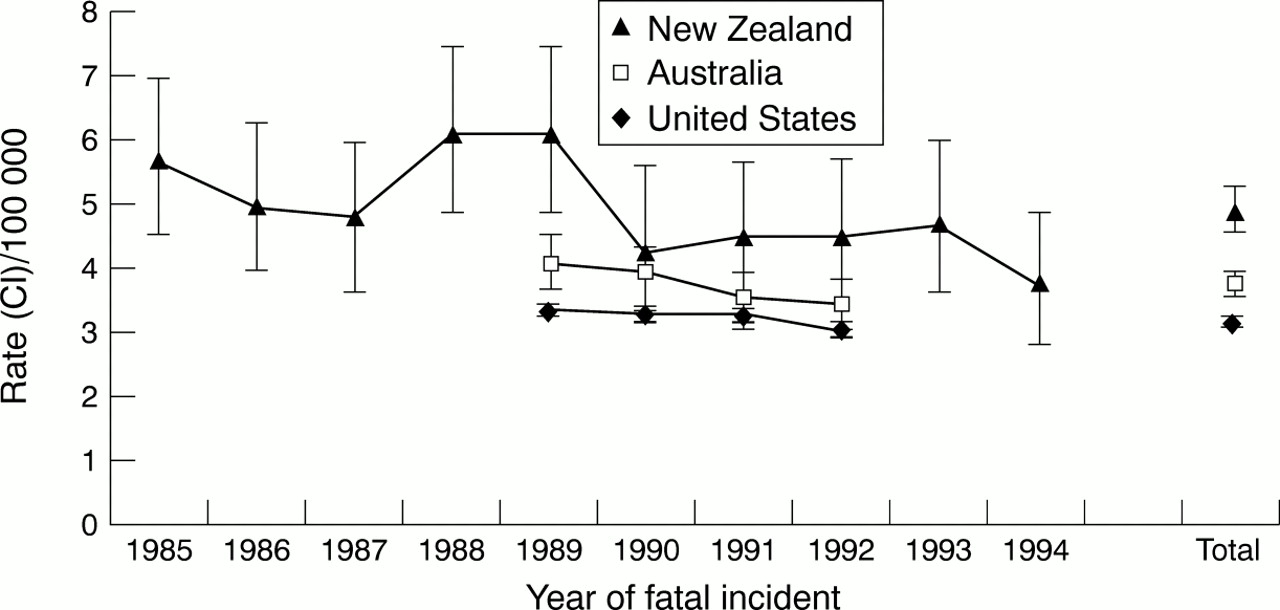
During the study period, 721 work related fatal injuries occurred in New Zealand, 1167 injuries occurred in Australia, and 15 242 injuries occurred in the United States. Based on the unadjusted rates, New Zealand had the highest mortality rates of the three countries, while the United States had the lowest rates throughout the study period, with a downward trend evident in the unadjusted rates for all countries over the study period (fig 1). Rates adjusted for differences in industry distribution were more similar. The adjusted New Zealand rate was between 10% and 15% higher than the United States and Australian rates, depending on which population was used for the standardisation process, with little difference evident between the rates for Australia and the United States.

Number and rates (95% confidence interval, CI) of fatal injuries in New Zealand, Australia, and the United States, 1985–94.
The influence of age and gender were remarkably consistent across the three countries. Those between 20 year and 54 years were most frequently involved in work related fatal injuries. The rates remained fairly constant between these ages, but rose markedly with age, with the highest rates being observed among older workers, those 65 years and older (1.5–3.5 times each population rate), and becoming particularly marked at ages over 70 years (4–7 times each population rate). The vast majority of fatal injuries, more than 90%, involved males.
Unintentional injuries were far more common than intentional injuries in each country. However, intentional injuries, relative to unintentional ones, occurred far more commonly in the United States (21.1% of injuries) than the other two countries (New Zealand: 3.7% of injuries and Australia: 5.1% of injuries).
In all three datasets, the same four high risk industry divisions (mining, agriculture, forestry and fishing, construction, and transportation) and four much lower risk divisions (manufacturing, sales, services, and public administration) were identified, and the ranking of rates was nearly identical (table 2). However, there were some important differences in the relative distribution across industry divisions. Mining workers were a relatively infrequent category, accounting for around 5%–10% of deaths, but had the highest rates, between seven and 10 times that of the total worker population in each country (table 2). The second highest rates for each country were observed among agriculture, fishing, and forestry workers. Nearly half of the fatal injuries over the study period in New Zealand were to workers in this industry grouping, compared with just under one third of the Australian fatal injuries and less than one fifth of the United States injuries. Construction was the third most common industry involved in work related fatal injury. Fatal injuries among those in the sales industry were much more frequent among the United States deaths, and the rates were higher there than in New Zealand and Australia.
Percentage distribution and rates of fatally injured persons by industry division, and percentage distribution of the population
The overall distributions of each country's population across industry divisions are similar, with the bulk of each population to be found in services and sales, and a minority to be found in the high risk groupings of mining, construction, and agriculture (table 2). However, a somewhat greater proportion of the New Zealand population were employed in the high risk agriculture division than was the case for Australia and the United States.
Distribution by occupation largely reflected that observed in the distribution for industry grouping. Those working in farming, fishing, and forestry occupations and those working as trades workers, operators and labourers, were the workers most commonly involved in fatal injuries and these divisions had by far the highest rates (table 3). Farming, forestry and fishing workers, the group with the highest rate in each country, were more commonly involved in fatal injuries in New Zealand, with a higher proportion of the population there employed in these occupations. A greater proportion of the United States deaths was accounted for by those in sales jobs, compared with the other two countries, although the mortality rates were only moderately higher.
Percentage distribution and rates of fatally injured persons by occupational division, and percentage distribution of the population
Distribution of fatal injuries by external cause of death (E code) revealed some consistencies but also some key differences. Accidents caused by machinery (E919) were common external causes in each dataset, accounting for one in five or one in four events. Being struck by a falling object (E916) and accidental falls (E880–E888) accounted for around one in 10 events in each country. However, water transport accidents (E830–E838) were much more common in New Zealand (13.9%) than in either the United States (2.5%) or Australia (5.2%). Air and space transport accidents (E840–E845) were more common in New Zealand (8.7%) and Australia (8.9%) than in the United States (4.5%). On the other hand, accidents caused by electric current (E925) were relatively less common in New Zealand (3.9%) than in Australia (9.8%) and the United States (7.9%). The high percentage of deaths due to homicide in the United States compared to the other two countries was confirmed by the E codes, with 20% of United States deaths coded to the relevant homicide E codes (E960–E969), compared with about 4% of deaths in New Zealand and Australia.
Distribution of intentional injuries by occupation indicated an increased proportion among those working in managerial, professional and technical jobs, among clerks and among sales and service workers, with the latter being the most commonly involved group in all three countries (table 4). However, in the United States the proportion of fatal injuries in these groups was always much greater, compared with Australia and New Zealand. This pattern was confirmed by the industry distribution of intentional injuries. In each country, the sales industry and the services industry was much more commonly involved (table 5), with the pattern being more pronounced in the United States. However, even in those groups where the proportion of homicides was increased in all three countries, such injuries were always in the minority in Australia and New Zealand, never accounting for more than 20% of injuries in any group. In the United States, on the other hand, such injuries accounted for the majority of cases among sales workers and for nearly half of the injuries in public administration.
Percentage distribution of fatal injuries in each occupational category by manner of death
Percentage distribution of fatal injuries in each industry category by manner of death
Discussion
The annual rates of fatal occupational injuries during the study period were consistently highest in New Zealand, lowest in the United States, and intermediate in Australia. Because the United States data collection method likely underestimates the occurrence of work related fatal injuries,6 the true difference between the United States and the other two countries is probably less. The difference between New Zealand and Australia, on the other hand, is less likely to reflect such influences, because the methods of data collection were virtually identical. The results of the standardisation process show that much of the difference between countries is accounted for by differences in industry distribution.
There were some remarkably consistent patterns evident in trends across the decade, in the high risk groups identified, and in the leading causes of death. A downward trend was evident for each country during the study period, confirming industry specific trends within countries.2, 4, 14–16 Males, older workers, and those working in certain settings, namely in mining, in agriculture, forestry and fishing and in construction, were at the greatest risk. Machinery, being struck by falling objects, and falls were consistently implicated as leading causes of work related injury death. These findings corroborate findings reported from each country's internal comparisons2, 4, 5 and from earlier international comparisons.6
Key points
-
Based on crude rates, New Zealand had the highest average annual rate, Australia an intermediate rate, and the United States the lowest rate of work related injury.
-
Much of the difference between countries was accounted for by differences in industry distribution.
-
The results contrast with those obtained from comparison of published omnibus statistics, both in terms of absolute rates and in terms of relative ranking of the countries.
-
There was considerable consistency across these comparable industrialised countries with respect to many of the major high risk groups.
-
There was considerable consistency across the three countries in external cause of death with the exception that homicide was more common in the United States than in the other two countries.
There were also some striking differences between the countries in causes of death. Water transport injuries were much more prominent in New Zealand. Air transport injuries were less common in the United States, while contact with electricity was much more prominent in Australia and the United States. From the present analysis it is not possible to ascertain why these differences have occurred. They may be due to industry specific hazards and risks in the three countries. Alternatively, the differences may reflect more (or less) effective control of hazards. More detailed industry and occupation specific analysis is required to better understand the differences and similarities between causes of death in the three countries.
The picture with respect to homicide was much less ambiguous. Homicide injuries were rare in Australia and New Zealand, although they tended to occur in the same sorts of settings as was found for the United States (for example, sales and services settings). The high incidence of work related homicides in the United States is likely to underlie one of the main differences observed among the industry and occupational rates. Those working in sales jobs in the United States were much more frequently involved in intentional work related fatal injuries, and had higher mortality rates, than those in sales jobs in Australia or New Zealand. This confirms work reported elsewhere with respect to the public health importance of intentional injuries among work related fatalities in the United States.5, 17
The collaborative effort described here underscores a number of important methodological aspects of international comparisons of occupational fatal injury data. First, it is clear that even for apparently highly comparable datasets, considerable preparatory work is needed before meaningful analysis of the data can be undertaken. Second, it is clear that without this preparatory work, as is the case when published data are used, comparability may be severely compromised.18 While this latter point is not new, it is emphasised here because omnibus statistics continue to be published as a basis for drawing international comparisons.6 While there are usually caveats in the form of cautionary explanatory notes or footnotes to international tabulations such as those provided by the International Labour Organisation (ILO), the very existence of the data in tabulated form encourages comparisons. This is particularly the case for national policy makers who, understandably, find such data compelling when assessing their nation's performance. On the other hand, those accessing these data are often not in the position to assess the viability of comparisons, nor is enough technical detail usually provided to be able to judge the comparability of data.
A case in point is provided by recent published estimates of the global burden of occupational fatal injuries.18 Using data submitted to the ILO, and attempting to adjust for the under-reporting which is expected (but not well quantified) in the data submitted by nations, rates of occupational fatal injuries for many countries were estimated. These published data provided useful global estimates of order of magnitude differences between countries. However, the present results suggest that their accuracy would be hampered by the quality of the source data. Comparing New Zealand, Australia and the United States, the rates of fatal injury based on the ILO data estimated that the highest fatality rate was to be found in Australia, with a rate nearly double that reported in the Australian dataset used here.18 The rates estimated for New Zealand and the United States were identical, but again the estimated United States rate was nearly double that found in the present study. In other words, the overall benchmarking of the performance of the three countries based on the published data would have provided a very different picture to that provided by the present data. It is acknowledged that sometimes comparisons need to be made even when there are uncertain, and possibly important, methodological differences between the data sources. Clearly it is preferable to standardise the definitions and inclusion criteria used in the data to be compared. When this is not possible, it is imperative that the limitations and differences in the definitions and criteria are clearly described in order to permit accurate interpretation.
Validity of the comparison of the datasets for New Zealand, Australia, and the United States was a key concern of the present study. To compare like with like, corresponding subsets of each country's dataset were identified and these were used as the basis of the fatality rates for comparison. The harmonisation of both numerator and denominator data for the comparison was a unique feature of the present study, serving to enhance the accuracy and viability of the comparison. The definition of work relatedness, a fundamental question in such comparisons, was also considered. In general terms, the comparability between Australia and the United States of classification of what constitutes a work related injury have been noted elsewhere.7 The classification used in the New Zealand data was specifically designed with such comparability in mind.2 However, in the Australian and New Zealand studies a small group of researchers well versed in the issues of classification made the decision. This may not be the case for routine surveillance, as is the case with medical examiners identifying work related deaths. More detailed examination of the comparability of case definitions is currently underway.
The present paper has provided an overview of fatal work related injury experience in three countries. To our knowledge, it is the first multicountry comparison where the numerator and denominator data have been directly harmonised, both in terms of inclusion of cases and in terms of classification of cases. Of particular interest in such comparisons is the distribution of injury by occupation and industry classification, as proxy indicators of hazards. Overcoming the lack of consistency between the seemingly comparable classification systems for occupation and industry used in the three countries was perhaps the greatest challenge in the present study.
Implications for prevention
The present results suggest considerable consistency across the three nations with respect to some of the major high risk areas, providing clear targets for further attention. It is unclear whether the same specific occupations and hazards are contributing to the aggregated industry and occupation group rates reported here. Examination of relatively homogenous high risk occupational groups common to each dataset, and detailed examination of mechanisms of injury, are likely to yield data that are more revealing about the nature of specific hazards and strategies for their prevention.
Acknowledgments
We are grateful for the assistance of Leigh Hendrie, National Occupational Health and Safety Commission; Suzanne Marsh, National Institute for Occupational Safety and Health; Simon Horsburgh, New Zealand Environmental and Occupational Health Research Centre.
Funding for this project was provided by National Institute for Occupational Safety and Health, New Zealand Environmental and Occupational Health Research Centre, and New Zealand Occupational Safety and Health Service.
The authors wish to acknowledge the International Collaborative Effort (ICE) on Injury Statistics for contributions to this research. The ICE is sponsored by the National Center for Health Statistics, US Centers for Disease Control and Prevention with funding from the National Institute of Child Health and Development, National Institutes of Health.
The views expressed in this paper are those of the authors and do not necessarily reflect those of the National Occupational Health and Safety Commission.