Article Text

Abstract
Objective This study investigated whether the Child Safety Collaborative Innovation and Improvement Network (CS CoIIN) framework could be applied in the field of injury and violence prevention to reduce fatalities, hospitalizations and emergency department visits among 0–19 year olds.
Sample Twenty-one states/jurisdictions were accepted into cohort 1 of the CS CoIIN, and 14 were engaged from March 2016 through April 2017. A quality improvement framework was used to test, implement and spread evidence-based change ideas (strategies and programs) in child passenger safety, falls prevention, interpersonal violence prevention, suicide and self-harm prevention and teen driver safety.
Procedures Outcome and process measure data were analyzed using run chart rules. Descriptive data were analyzed for participation measures and descriptive statistics were produced. Qualitative data were analyzed to identify key themes.
Results Seventy-six percent of CS CoIIN states/jurisdictions were engaged in activities and used data to inform decision making. Within a year, states/jurisdictions were able to test and implement evidence-based change ideas in pilot sites. A small group showed improvement in process measures and were ready to spread change ideas. Improvement in outcome measures was not achieved; however, 25% of states/jurisdictions identified data sources and reported on real-time outcome measures.
Conclusions Evidence indicates the CS CoIIN framework can be applied to make progress on process measures, but more time is needed to determine if this will result in progress on long-term outcome measures of fatalities, hospitalizations and emergency department visits. Seventeen states/jurisdictions will participate in cohort 2.
- child safety
- injury and violence prevention
- quality improvement
This is an Open Access article distributed in accordance with the Creative Commons Attribution Non Commercial (CC BY-NC 4.0) license, which permits others to distribute, remix, adapt, build upon this work non-commercially, and license their derivative works on different terms, provided the original work is properly cited and the use is non-commercial. See: http://creativecommons.org/licenses/by-nc/4.0/
Statistics from Altmetric.com
Child injury
Despite progress in reducing child injury mortality and morbidity, more children and adolescents aged 1-19 years die from injuries and violence in the USA than from all diseases combined.1 In 2015, 13,300 children and adolescents aged 0-19 years died of an injury, and there were an additional 200,225 injury-related hospitalizations and almost 7.7 million injury-related emergency department (ED) visits.2 Nationwide in 2015, the leading cause of injury deaths among children and adolescents aged 5-19 years was motor vehicle traffic-related injuries. Among children 1-4 the leading cause of injury death was drowning. Homicide is the second leading cause of injury deaths for infants less than one and children 1-9, and the third leading cause for age groups 10-14 and 15-19.2 For children and adolescents aged 10-19 years, suicide is the second leading cause of injury deaths.2 Falls are the leading cause of hospitalized injury among infants and children aged 0-14 years and lead the reasons for treatment in an ED.2 Injuries and violence are often predictable and preventable,3 4 yet reductions have not occurred evenly across populations.5 6 A gap persists in the broad implementation of evidence-based programs,3 7 especially among high-risk populations.
Children’s Safety Network
Funded by the Health Resources and Services Administration’s Maternal and Child Health Bureau (HRSA MCHB), the Children’s Safety Network (CSN) at Education Development Center worked with 21 state maternal and child health and injury and violence prevention programs to increase uptake of evidence-based strategies for injury and violence prevention. In December 2015, CSN launched the first cohort of a Child Safety Collaborative Innovation and Improvement Network (CS CoIIN) that employed a quality improvement (QI) approach8–10 to improve the translation of science into practice and reduce injury-related deaths, hospitalizations and ED visits. The CS CoIIN focused on five topics, selected by CSN and HRSA MCHB based on a review of injury data and in consultation with the National Coordinated Child Safety Initiative Steering Committee: (1) child passenger safety (CPS), (2) falls prevention (FP), (3) interpersonal violence prevention (IPVP), (4) suicide and self-harm prevention (SSHP) and (5) teen driver safety (TDS). CSN studied:
Can the CS CoIIN framework be applied in injury and violence prevention to achieve population level outcomes?
What results can be expected in injury and violence prevention using a collaborative QI methodology over the course of a year?
CS CoIIN framework
The CS CoIIN leveraged Foundation Strategy Group’s collective impact approach, the Institute for Healthcare Improvement’s (IHI) breakthrough series (BTS) and Associates in Process Improvement’s (API) model for improvement (MFI). The Collective Impact approach has been successfully tested for large-scale social change and identifies five components for success: a common agenda, shared measurement, mutually reinforcing activities, continuous communication and backbone organizations with a structured process and dedicated staff.11 IHI’s BTS is a collaborative model, with wide-spread use in healthcare, that provides a structure for achieving breakthrough improvements through an expert meeting, three face-to-face learning sessions and action periods between learning sessions.9 The expert meeting is an in-person meeting of subject matter experts who develop a driver diagram, or theory of change, and accompanying measurement strategy.9 The CS CoIIN framework adapted the BTS expert meeting to include application experts, along with subject matter experts, and the three face-to-face learning sessions to two 4 hour, virtual learning sessions and one face-to-face learning session. Driver diagrams and measurement strategies for each child safety topic were informed by the expert meeting and developed by CSN staff. They were based on API’s MFI that asks: ‘What are we trying to accomplish (aim statement)? How will we know a change is an improvement (measurement strategy)? What changes can we make that will result in improvement (driver diagram)?’8 12 Driver diagrams contain drivers (eg, norms, systems and processes) necessary to achieve the aim statement and actionable, evidence-based change ideas necessary to achieve the drivers.13 The MFI then applies the Plan, Do, Study, Act Cycle (PDSA) as a framework for testing, implementing, and spreading change ideas.8 14 Change ideas are tested rapidly, on a small scale,8 15 and implemented and spread once teams make necessary adaptations and establish organizational commitment.8 Given the complex environment of reducing injury and violence prevention on a national scale, these models were selected based on promise of large-scale, sustainable change that can be achieved over a year.
CS CoIIN in practice
At the CS CoIIN launch, application experts came together in leadership teams from 21 states/jurisdictions, along with child safety subject matter experts and CSN staff, to provide input on driver diagrams.16–27 Leadership teams included the state/jurisdiction health officer, the maternal and child health director, and the injury and violence prevention director or designees. Strong leadership teams are necessary to align improvement work with organizational initiatives and secure appropriate resources for large-scale spread projects.8 Leadership teams were responsible for composing state/jurisdiction strategy teams that included public health program staff, epidemiologists and staff from partner organizations. Strategy teams participated in monthly topic calls, made day-to-day decisions, submitted data and built the capacity of pilot sites to test, implement and spread change ideas from March 2016 to April 2017 (see figure 1). Strategy teams received technical assistance from CSN on child safety strategies and programs and improvement science throughout this time.

CS CoIIN timeline. CS CoIIN, Child Safety Collaborative Innovation and Improvement Network.
Methods
Sample
An invitation to participate in cohort 1 of the CS CoIIN was sent to US states/jurisdictions and tribal communities, and 21 states/jurisdictions were accepted. Table 1 indicates the number of participating state/jurisdiction teams per topic.
Number of states/jurisdictions and percent of US population and fatalities by topic
Measures
Outcome measures were the number of: (1) ED visits, (2) hospitalizations and (3) deaths due to child injury. These measures reflect the national performance and outcome measures for state maternal and child health programs to reduce severe and fatal injuries among children and adolescents aged 0–19 years.28 Each CS CoIIN topic had these three outcome measures. States/jurisdictions were asked to report on a quarterly or monthly basis from March 2016 to April 2017 using the best real-time data available.
Each CS CoIIN topic had 11–19 process measures. Measures were selected based on expertise from the NCCSI, CSN and states/jurisdictions. Consideration was given to quality of the measures and access to data. States/jurisdictions were asked to report monthly on 5–7 measures, per topic, from March 2016 to April 2017. At times data were available through pilot sites, such as schools or hospitals, and at times states created new surveys and datasets. Table 2 illustrates a sample of process measures.
Sample process measures by topic
Participation measures tracked (1) engagement in CS CoIIN activities, (2) reporting practices, (3) retention and (4) overall progress. CSN tracked data monthly from March 2016 to April 2017, with the exception of overall progress data tracked from March 2016 to November 2016.
Engagement in CS CoIIN activities was measured by percent of states/jurisdictions attending learning sessions and percent participating in topic calls. Reporting practices were measured by percent of states/jurisdictions that submitted driver diagrams, PDSA cycles and monthly reports. Retention was the percent of states/jurisdictions from cohort 1 that continued in cohort 2. Overall progress was measured on a 5.0 IHI Assessment Scale for Collaboratives that ranged from 1.0, forming a team, to 5.0, outstanding sustainable results.29
Procedures
Outcome and process measure data were plotted monthly on run charts, or time series graphs, and analyzed using run chart rules.30 Run chart rules include identification of trends, five or more consecutive data points heading in the right direction, shifts, six or more consecutive data points all above or below the baseline, and astronomical points.8 30 Trends and shifts signal non-random variation that point to the evidence-based changes having an effect.8 Astronomical points are assessed to understand if something outside the system is acting on process or outcome measures. Astronomical points are data considered outliers, clearly outside common variation, to anyone studying the run chart data.8 30 Descriptive statistics were produced and analyzed monthly for participation measures. Key themes across the CS CoIIN were identified through word repetition analysis of qualitative data made available through monthly reports, PDSA submissions, topic calls and evaluations from March 2016 to April 2017.
Results
Twenty-five percent (n=5) of states/jurisdictions worked with state epidemiologists to identify data sources and report real-time outcome data. One state leveraged an electronic database from its Office of Emergency Medical Services to track suicide-related ED visits. Another worked with the Traumatic Brain Injury Registry to track hospitalizations, and another accessed the state death registration system to track fatalities.
Fifty-seven percent (n=12) of states/jurisdictions submitted process measure data on at least one topic; of these, seven submitted data on at least two topics, and one submitted on three. These 12 states/jurisdictions account for 86% of the states/jurisdictions that were actively engaged throughout cohort 1. Two states/jurisdictions that will continue in cohort 2 were selected to illustrate CS CoIIN progress in more detail.
CPS: state/jurisdiction 1
State/jurisdiction 1 aims to improve CPS by increasing the number of mobile fitting and safety seat inspection sites, the distribution of car seats, and the number of certified CPS technicians. The state/jurisdiction is targeting high-risk populations by increasing fitting stations in areas with the highest incidents of motor vehicle crashes and fatalities, holding booster seat promotional events in rural and low socioeconomic areas, increasing the number of Spanish speaking car seat technicians, and partnering with resettlement agencies to reach refugee populations new to the culture of CPS and with limited English language skills. In January 2016, state/jurisdiction 1 operated 95 mobile fitting and child safety seat inspection sites. By October 2016 that number increased to 116, then dropped to 107 in January 2017. All the stations operated in underserved communities. From January to April 2016, state/jurisdiction 1 distributed an average of 275 free or discounted car seats monthly. This increased to an average of 344 seats between July and October 2016, with 410 seats distributed in October 2016. State/jurisdiction 1 also increased the number of technicians receiving certification from 11 in January 2016 to 34 in November 2016, and the number of universal safety seat inspection forms submitted from 657 in January 2016 to 859 in October 2016. This CPS team also hosted 27 events in a state-wide push to promote safety seat distribution.
TDS: state/jurisdiction 2
State/jurisdiction 2 aims to increase parental and teen understanding of Graduated Driver Licensing (GDL) requirements and parental enforcement of GDL with teen drivers. The state/jurisdiction created and tested a GDL educational card with parents and teens in five pilot schools that included high performing, low performing, urban and rural schools. Three of the schools are located in the state/jurisdiction’s Department of Transportation’s priority counties, due to high crash rates related to speed, alcohol, youth drivers and low seat belt use. The card was distributed to 77 parents through five schools and led to increased knowledge for 71% of recipients. When tested with 76 teens across five schools, 80% of teens reported increased knowledge. State/jurisdiction 2 also sought to learn if the card contributed to parental willingness to enforce GDL through a signed parent-teen driver agreement. In a group of 77 parents, 67% reported having a parent-teen driver agreement in place, and among those who did not have an agreement, 79% indicated they would be willing to create one. The state/jurisdiction’s Department of Motor Vehicles has begun to distribute the GDL card at 98 sites.
Looking at participation measures, on average, 79% of TDS, 81.7% of CPS, 67.8% of IPVP, 50% of SSHP and 100% of FP states/jurisdictions were engaged in CoIIN activities and reporting data (see table 3).
Number and percent of states/jurisdictions by participation measure and topic team
At least 60% of states/jurisdictions participated in topic calls each month. The percent of respondents who indicated that the topic calls were very good or excellent in terms of usefulness to the participants’ work varied by monthly call from 55% of respondents in topic call 6 to 100% of respondents in topic call 10. The reason provided for not attending topic calls was scheduling conflicts. Increased positive responses for the usefulness of topic calls are attributed to states having more work to share with one another and CSN staff over time.
More states submitted or revised PDSAs in the beginning of cohort 1, which tapered off around month 9. This drop off was expected as state/jurisdiction teams built their QI capacity. Thirteen states and one jurisdiction from cohort 1 reapplied to cohort 2, in addition to 3 new states, for a total of 16 states and 1 jurisdiction. For overall CoIIN progress, of the 65% of states/jurisdictions that reported data, 96.9% received a 2.5, testing changes, and 0.3% received a 3.0, or modest improvement, on the IHI assessment scale.29
A key theme that emerged is the CS CoIIN framework is a promising approach to achieve child safety outcomes, with 100% of states/jurisdictions reporting utility of the driver diagrams and measurement strategies during CS CoIIN events and topic calls. States/jurisdictions commented on the comprehensive nature of the driver diagrams, with a variety of evidence-based change ideas, and the flexibility of measurement strategies that allowed for focus on subsets of measures.
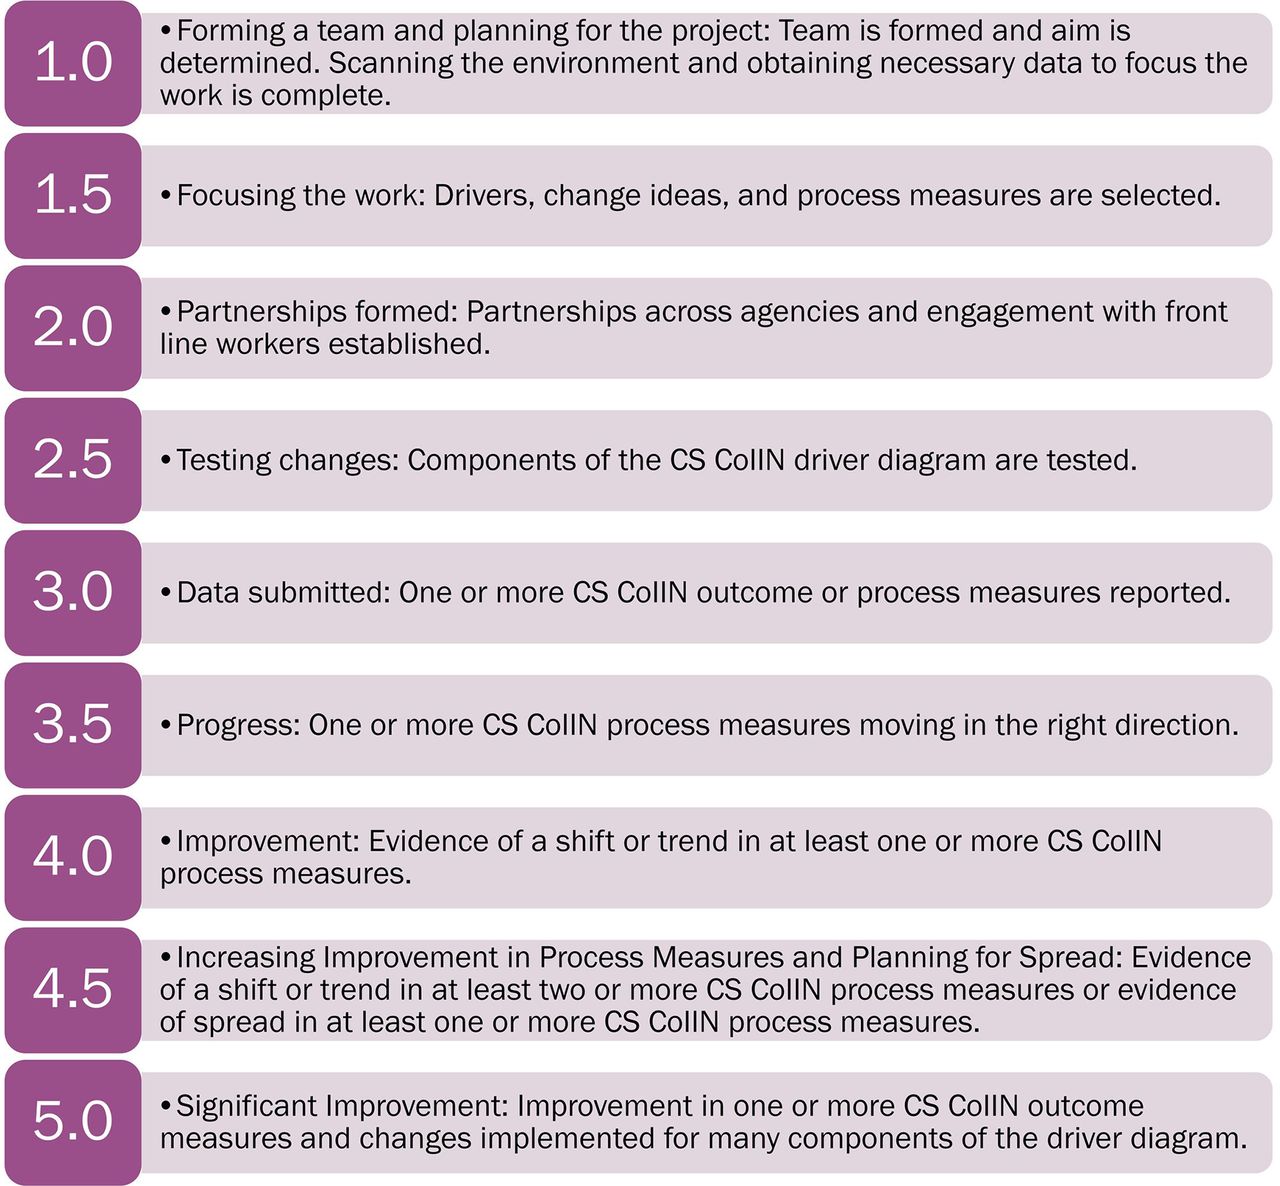
Another key theme was that aligning CS CoIIN work with state/jurisdiction strategic initiatives, assessing pilot site needs, building partnerships, and identifying and creating data systems were critical, and often new, efforts for states/jurisdictions that took more time than anticipated. Based on this, the IHI Assessment Scale for Collaboratives was adapted to create the five point CS CoIIN Progress Scale that provides increased sensitivity to (1) early work necessary to focus CoIIN efforts and (2) process measure reporting and analysis (see figure 2). An initial test of the CS CoIIN Progress Scale, using a purposive sample of 33% of CS CoIIN states/jurisdictions in April 2017 (n=7), indicated states/jurisdictions can form partnerships, begin testing and implementing evidence-based changes, and start reporting process measure data within a year, with some states/jurisdictions able to make progress on process measures (median=3.0).

The CS CoIIN Progress Scale note 1. The CS CoIIN Progress Scale was adapted from the IHI BTS model.29
Discussion
The CS CoIIN aim is to reduce child injury mortality and morbidity by spreading evidence-based prevention strategies across five topics: CPS, FP, IPVP, SSHP and TDS. CSN studied two questions: Can the CS CoIIN framework be applied in injury and violence prevention to achieve population level outcomes? What results can be expected in injury and violence prevention using a collaborative QI methodology over the course of a year?
Preliminary results demonstrate that the CS CoIIN framework is a promising approach, with states/jurisdictions increasing uptake of evidence-based practices and reporting on progress along process measures within 1 year. This was achieved through application of the CS CoIIN framework that utilized the collective impact approach,11 BTS,9 and MFI8 with three key adaptations. The first adaptation was to broaden the group of stakeholders who develop the driver diagrams and measurement strategies to include both subject matter and application experts from the National Coordinated Child Safety Initiative Steering Committee, CSN, HRSA and state/jurisdiction practitioners in order to address the challenge of translating research into practice across multiple injury and violence prevention topics. The second adaptation was to use a blended delivery model that replaced two face-to-face learning sessions with 4-hour virtual meetings, to facilitate increased participation. A third adaptation that emerged midway through the CS CoIIN was creation of a CS CoIIN progress scale to reflect working in a complex, multisectoral environment at the population health level. The scale recognizes early work should focus on states/jurisdictions aligning CS CoIIN activities with strategic plans, scanning and assessing their environments and building partnerships.8
Within a year, states/jurisdictions that participate in injury and violence prevention using a collaborative QI methodology can expect to test and implement changes in pilot sites and begin to report data. Some states/jurisdictions can expect to show improvement in process measures and readiness to spread evidence-based practices. Based on CS CoIIN results, improvement in outcome measures is not expected within a year; however, some states/jurisdictions are expected to identify data sources and begin to report on outcome measures in real time.
A key lesson from the CS CoIIN is that development of flexible driver diagrams and measurement strategies was necessary to engage states/jurisdictions. States/jurisdictions were first encouraged to review topic-specific aim statements and make revisions based on the population, geographic region, and changes they selected. Driver diagrams included a range of change ideas, from providing primers to parents to creating coalitions, participating in campaigns, and implementing evidence-based programs. This allowed for testing at the societal, organizational, relationship, and individual levels of the injury and violence prevention system31 and alignment with state/jurisdiction priorities and resources. A robust and flexible range of process measures were used to ease the burden of data collection and test what was feasible for states/jurisdictions to measure. Process measures ranged in the unit of analysis from individuals to organizations, and from measuring implementation of activities (eg, percent of teens educated on GDL) to changed knowledge and behaviors (eg, percent of teens reporting driving during restricted hours).
Limitations
Working on improvement in complex systems often brings the challenge of delayed response from the time evidence-based changes are tested to observing outcomes.8 Limited access to real-time outcome data is a limitation of the CS CoIIN. The CS CoIIN assumes that progress on intermediate process measures will correlate with progress on long-term outcome measures. The frequency of data collection is another limitation. Working within and across state agencies requires significant time to coordinate efforts and share resources. CS CoIIN data are collected from different agencies and pilot sites and reported monthly, rather than weekly or daily. General QI guidance is to establish baseline data using ≥10 data points.10 Due to monthly data collection and a 1-year cohort, the baseline was established using the first 3–5 available data points.8 10 Therefore, seasonal variation cannot be ruled out as a threat to validity. Additional limitations include the threat of history with time series design, inability to rigorously control for extraneous variables and self-report bias on measures of knowledge and behavior change.32
Future directions
The CS CoIIN framework begins to close the diffusion gap between research, practice and policy33 in the field of injury and violence prevention. Bringing all stakeholders together in one expert faculty group from conceptualiszation of driver diagrams and measurement strategies through implementation of a step-by-step approach to testing, implementing and spreading evidence-based strategies and programs allowed for top-down and bottom-up evidence from the National Coordinated Child Safety Steering Committee, HRSA, CSN and states/jurisdictions representing over one-third of the nation. The CS CoIIN driver diagrams were revised at the conclusion of cohort 1, based on state/jurisdiction evidence, and reorganized according to the social–ecological model31 to elucidate the overall systems approach to injury and violence prevention. This includes working on policy and practice at all levels of society. Cohort 2 will continue the work of cohort 1, with increased attention to systems mapping and improvement34 35 through QI topic calls.
What is already known on the subject
More children and adolescents aged 1-19 years die from injuries and violence in the USA than from all diseases combined.
During the past three decades, reductions have occurred for some causes of injuries (eg, motor vehicle-related) but not evenly across all causes or populations and a gap persists in the broad implementation of evidence-based programs, especially among high-risk populations.
What this study adds
There is promising evidence that the Child Safety Collaborative Innovation and Improvement Network framework, using a quality improvement (QI) methodology can be applied in the field of injury and violence prevention to achieve reductions in fatalities, hospitalizations and emergency department visits among 0–19 year olds.
Use of a collaborative QI methodology over the course of a year can increase the uptake of evidence-based strategies in injury and violence prevention and lead to wide-scale spread initiatives
Acknowledgments
The authors would like to thank Jane Taylor, EdD, independent consultant, quality improvement advisor to the Child Safety CoIIN and Jenny Stern-Carusone, MSW, Education Development Center, technology director to the Child Safety CoIIN.
References
Footnotes
Contributors JBL and MK: made substantial contributions to the manuscript’s conception, design, and writing. RSS: contributed to the study’s conception and reviewed and edited the manuscript. JA and RT: contributed to the drafting and editing of the manuscript. All authors: approved this version for publication.
Funding This project is supported by the Health Resources and Services Administration of the US Department of Health and Human Services (HHS) under the Child and Adolescent Injury and Violence Prevention Resource Centers Cooperative Agreement (U49MC28422) for $1,199,683.
Disclaimer The information or content and conclusions are those of the authors and should not be construed as the official position or policy of, nor should any endorsements be inferred by, HRSA, HHS or the US Government.
Competing interests None declared.
Provenance and peer review Commissioned; externally peer reviewed.
Correction notice This article has been corrected since it was published Online First. In the first paragraph of the Introduction, ’drowning' has replaced ’homicide' as the first cause of injury deaths among children aged 1-4 years old. In the following sentence, ’children 1-9' has replaced ’children 5-9'.