Article Text

Abstract
Objectives—To estimate the number and rate of occupational injuries and illnesses treated in hospital emergency departments and to characterize the nature, event, and source of injury and illness.
Setting—Twenty four hour emergency departments in hospitals in the United States.
Methods—Surveillance for occupational injuries and illnesses was conducted in a national probability based sample of hospital emergency departments through the National Electronic Injury Surveillance System (NEISS). Worker demographics, nature of injury and disposition, and incident circumstances were abstracted from emergency department medical records, typically within 24–72 hours of treatment.
Results—Approximately 3.6 million occupational injuries and illnesses were treated in emergency departments in 1998. Younger workers, particularly males, continue to have the highest rates of work related injuries. Together, lacerations, punctures, amputations, and avulsions represented one fourth of the emergency department treated injuries, mostly to hand and fingers. Sprains and strains, largely to the trunk, also accounted for one fourth of the injuries. The three leading injury events were contact with objects, bodily reactions and exertions, and falls.
Conclusions—Despite apparent decreases in rates, youth continue to have a high burden of injury in the workplace. However, three fourths of all emergency department treated injuries occur to workers 20–44 years of age. Emergency department surveillance is particularly amenable to capture of young worker injuries and provides a wealth of injury details to guide prevention efforts—efforts that will likely reduce occupational injuries as these workers age. Emergency department surveillance also provides injury estimates with few demographic or employer constraints, other than the medical venue used.
- surveillance
- emergency department
- National Electronic Injury Surveillance System (NEISS)
- occupational injury
Statistics from Altmetric.com
- surveillance
- emergency department
- National Electronic Injury Surveillance System (NEISS)
- occupational injury
Surveillance plays a critical part in highlighting the more dangerous industries, types of jobs, and characteristics of workers at risk. This allows targeted injury and illness intervention strategies and helps assess success of prevention efforts. There are several national surveillance systems that provide estimates of the magnitude of occupational injury and illness burden in the United States as well as provide details of circumstances and trends by industry or population group. Each system offers a unique perspective that is dependent on what is captured, be it the class of worker or employer, the types of injuries, the medical venue for treatment, or the surveillance methods. No system currently provides a complete picture of the occupational injury burden in the United States.
One system, the National Electronic Injury Surveillance System (NEISS)*, helps meet occupational safety and health data needs through capturing non-fatal work related injuries and illnesses treated in hospital emergency departments. Whereas this surveillance perspective is restricted by the type of injuries treated in emergency departments, NEISS is not constrained by worker demographics such as age; type of employer or industry (for example, self employed, private industry, or government); or employer size.
In 1998, the NEISS derived national estimate of occupational non-fatal injuries and illnesses treated in an emergency department was 3.6 million.1 The overall national estimate arose from a large case capture (>47 000 cases) that also allows examination of subpopulations and circumstances of work related incidents. For example, NEISS has been used previously to examine injuries to adolescents,2–4 older workers,5 and African-American women,6 in addition to finger,7 and inhalation injuries.8 The general characteristics of injured workers by age, sex, and the nature of injuries and illnesses treated in an emergency department in 1982,9 1996,10 and 19981 have also been described. This report extends these previous characterizations by focusing on the incident event and source of injury and illustrates the differences among several occupational injury surveillance systems.
Methods
The magnitude and characteristics of work related injuries and illnesses treated in hospital emergency departments in the United States in 1998 were estimated by using NEISS, which is a national stratified probability sample of hospitals with a minimum of six beds and a 24 hour emergency department. Hospitals in the sample were selected from the approximately 5300 rural and urban hospitals after stratification by total annual emergency department visits†. Sixty seven geographically distributed sample hospitals captured work related injuries and illnesses (47 458 cases) in 1998‡. Each case captured in a NEISS sample hospital was assigned a statistical weight, based on the inverse probability of selection, which was summed across all cases to obtain a national estimate. National estimates that are less than 1200, based on fewer than 20 cases in the sample, or that have a coefficient of variation greater than 33% are considered unstable and not reported.
Work related emergency department visits for injury or illness were identified from admissions information and emergency department chart review by hospital coders. A work related case was defined as any injury or illness incurred by a civilian, non-institutionalized worker while doing work for compensation, arriving or leaving work but on the employers' premises, during transportation between locations as a part of the job (excluding commuting to or from home), while doing agricultural production activities, or working as a volunteer for an organized group (for example, volunteer fire department).11 Military injuries, common illness cases (for example, colds or flu), routine drug and alcohol screening, and revisits to the same emergency department for a previously treated injury or illness were excluded.
NEISS records include limited information on worker demographics, the nature of the injury or illness, the incident or condition leading to the emergency department visit, and products involved (if any). Based largely on the incident description, NIOSH classified each case as to the event or exposure and the source of the injury or illness by using the Occupational Injury and Illness Classification System.12 Although specific enumeration of injury versus illness has not been done for these cases, the diagnosis classifications suggest that at least 90%–95% of all cases are injury and would have ICD-9-CM codes 800–999.13 Thus, injuries and illnesses are henceforth referred to as injuries.9, 10
Employment estimates were based on 12 month averages for full time equivalent workers (1 FTE = 2000 hours/year) from the 1998 Current Population Survey.14 The Current Population Survey is a monthly household survey of the civilian, non-institutionalized population in the United States 15 years of age and older that includes wage and salary workers, self employed, part time workers, and unpaid workers who worked 15 hours/week or more in family operated enterprises, but excludes volunteers for organized groups. Injuries to workers 14 years of age and younger (0.1% of total) were included in the total injury/illness estimate, but were excluded from injury/illness estimates in the rate calculations because employment data were not available. Although not represented in the employment data, volunteers are included in the injury estimates and subsequent rate estimates because of the difficulty in reliably identifying volunteers within NEISS.
Results
In 1998, an estimated 3.6 (0.6) million injuries and illnesses were treated in hospital emergency departments (national estimate (±95% confidence interval)).1 The overall injury and illness rate was 2.9 (0.5) incidents/100 FTE. Emergency department treated workers ranged in age from less than 14 to more than 80 with 55% of the workers being less than 35 years of age and 70% being male (table 1). Males had an incidence rate of 3.4 (0.6) and females a rate of 2.1 (0.3)/100 FTE. Young males and females, particularly those 15–24 years of age, had the highest incidence rate of injuries—a trend that was observed nearly two decades earlier (fig 1). Males, 15–24 years of age, had an injury rate about four times higher than older workers 55–64 years of age. For females, the injury rate for younger workers (15–24 years) was nearly two and one half times higher than the older female workers (55–64 years).
National estimates (NE) of occupational injuries and illnesses treated in an emergency department by sex and age* (in thousands)
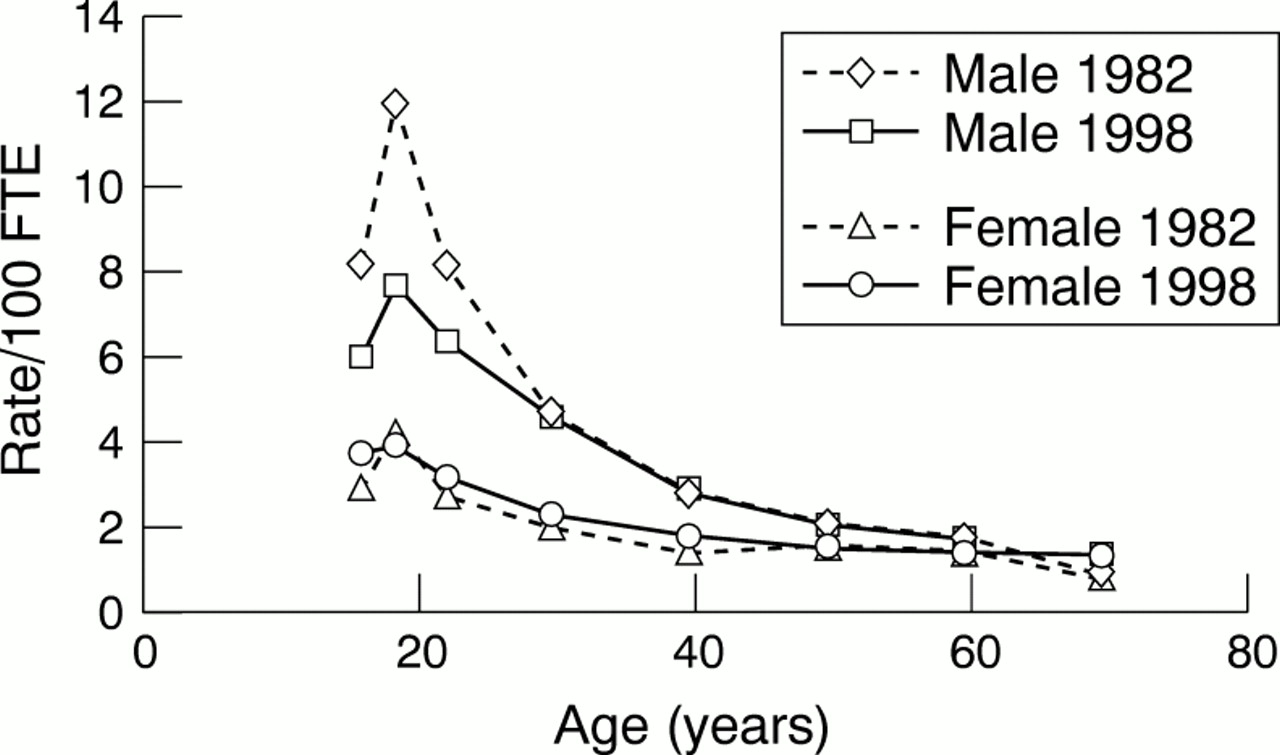
Rates/100 full time equivalent (FTE) workers by sex and age for injuries and illnesses treated in an emergency department for 1982 and 1998. (Note: age is plotted as a linear function by using the mid-point of the age categories shown in table 1.)
About one fourth of all injuries involved lacerations (22%), punctures (4%), amputations (1%), and avulsions (1%) (table 2). These types of injuries overwhelmingly affected hand and fingers with the balance of injuries about equally divided among head and neck, upper extremities (except hand), and lower extremities. Another one fourth of all injuries were sprains and strains, predominantly to the trunk. Contusions and abrasions (19%), hematomas (1%), and crushing injuries (1%) occurred about one fifth of the time, mostly to upper and lower extremities. Burns, which most frequently affected the head and neck or hands and fingers, were primarily divided among scalds from liquids or steam (33%), thermal burns from flames or surfaces (28%), and chemical burns (23%). An additional 12% of burns were attributed to radiation (for example, ultraviolet induced cell damage such as welder's flash) and 2% to electrical burns.
National estimates of injury or illness diagnosis and part of body affected* (in thousands)
As would be expected from the nature of the emergency department treated injuries, about half of the incident events were contact with objects or equipment followed by lesser numbers of bodily reaction or exertion and falls (table 3). For events involving contact with objects, the source of the injury was widely distributed, although tools, instruments, and equipment along with parts and materials were most frequent. Generally the worker was struck by the object (41%) or struck against the object (13%); however, in 34% of the cases, the type of contact was not specified. Instances of being caught in or compressed by equipment (6%) and rubbed or abraded (6%) were less common.
National estimates of event or exposure and source of the injury or illness (in thousands)
The second leading injury event was bodily reactions or exertion. Two thirds of these incidents (478 200) resulted from overexertion with 23% involving containers such as boxes and 15% involving physical effort with another person (for example, lifting). About one fourth of all bodily reaction and overexertion injuries involved free bodily motion such as from a sudden movement, slips or trips without a fall, or while walking, reaching, bending, or twisting. Carpal tunnel syndrome and other repetitive motion injuries (4%) were not a large contributor to the overall estimate for overexertion or bodily reactions.
The one half million fall events ranked third among emergency department treated incidents. Among the falls, 63% were falls on the same level and 33% were falls to a lower level. Most falls were to a floor, walkway, or ground surface. Emergency department treated slips or trips that did not result in a fall were comparatively few (49 700 included in bodily reaction events) as would be expected based on the likely severity outcome.
Exposure to, or contact with, a condition or substance in the environment resulted in nearly one tenth of all emergency department treated injuries. Among these incidents, the distribution was 27% skin contact, 24% contact with hot objects, 16% needlesticks, 7% inhalation of substances, and 4% venomous stings or bites. For these events, the sources of injury and illness were quite diverse. However, various chemicals and chemical products accounted for about a third of the incidents. Medical needles and syringes were the source for all needlesticks and most of the instrument or tool related sources.
The remaining and less frequent injury events involved assaults, transportation incidents, and fires. About 81% of assaults were by people with 28% of all assaults or violent acts by healthcare patients. The balance of assaults (19%) were by animals, mostly dogs, cats, and cattle. Although details were missing for more than one half of transportation incidents, numerous transportation incidents resulted from pedestrians being struck by a vehicle (19%), highway collision and non-collision (for example, rollover or jack-knife) incidents (14%), and non-highway incidents (11%). Lastly, the smallest event category for emergency department treated injuries involved a multitude of sources that resulted in fires and explosions. Seventy one per cent of these events were fires.
The sources for injuries overall were highly variable, but several source subcategories stand out as significant contributors: 12% floors, walkways, and ground surfaces; 8% non-powered hand tools; 7% self induced and bodily conditions or motion by the injured worker him or herself; 6% non-pressurized containers; 6% scrap, waste, and debris; 5% building materials; and 5% a person other than the worker. A secondary source (that is, the object or person that generated the source or contributed to the event) was involved in (or identifiable) for 20% of all incidents. Among those incidents with a secondary source, the distribution was 20% tools and equipment such as ladders, powered hand tools, nail guns, and welding torches; 13% other sources such as unspecified liquids and ice; 11% structures and surfaces; 11% vehicles; 10% persons and animals; and 10% machinery.
About 2% (77 600) of the emergency department treated injuries resulted in hospitalization of the worker with the balance of the cases being treated and released from the emergency department. For these injuries, which were presumably more severe than the treated and released cases, contact with objects continued to be the leading injury event for hospitalized workers, although the proportion decreased (fig 2). Incidents involving bodily reaction and exertion also declined proportionately, but there was a shift in the nature of injury with hospitalized cases being about one third overexertions and one third heart attacks. Falls increased proportionately more than twofold among hospitalized workers, as did transportation and fire or explosion related injury events.

Injury event classification (refer to table 3) for NEISS emergency department (ED) treated; ED treated, hospitalized; and Bureau of Labor Statistics (BLS), lost work time cases (percentage of national estimates).
Discussion
The 1998 NEISS estimate of 3.6 million occupational injuries and illnesses treated in an emergency department is similar to estimates in 1996 (3.2 million, as recalculated§),10 the annual average for 1982–86 (3.6 million),15 and the one year estimate for 1982 (3.2 million),9 despite an overall increase in employment from 1982 to 1998 in the United States (FTEs increased roughly 28%, ∼21% for males and ∼38% for females, based on the 1982 and 1998 Current Population Survey, although the surveys are not rigorously comparable over time). This suggests that an apparent decrease in injury rate (3.2 v 2.9 incidents/100 FTE) occurred over the 16 year time span, 1982–98. The apparent decrease is most notable for young males (fig 1). The rate differences between these years may not be representative of an overall decrease in injury rates but may be either an artifact of changes in emergency department usage or the two years examined being atypical of the intervening years. However, the apparent decrease is at least partially supported by Bureau of Labor Statistics annual survey trends. In 1992, the Bureau of Labor Statistics began reporting the number of injuries by age for cases involving days away from work. From 1992 through 1997 there was nearly a 50% decrease in young worker reportable incidents that has been partially attributed to an increase in workplace safety.16 This downward trend continued in 1998,17 but the precipitous drop only began in 1995.
The distribution of injury events that resulted in emergency department treatment also has not changed greatly from the mid-1980s to 1998. Cumulatively from 1982 through 1986, the leading injury events were contact with objects and equipment (∼59%), bodily reaction and overexertion (∼15%), and falls (13%)15—percentages that are somewhat similar to the event distributions in 1998 (table 1). Additionally, lacerations to fingers in 1982 were a high proportion of all injuries and similar in number to 1998.7
The distribution of injury events captured in an emergency department is, however, different from other surveillance systems such as the United States Department of Labor's Bureau of Labor Statistics annual Survey of Occupational Injuries and Illnesses.17, 18 This survey captures all injuries and illnesses for private industry employers. However, it only reports event and source characteristics for lost work time injuries and illnesses, but without restriction to treatment in a particular medical venue (fig 2). The emergency department captures many injuries such as lacerations that require immediate medical treatment but do not result in lost work time of one or more days. Many sprain and strains, particularly to the trunk, may result in lost work time as well as receive treatment more frequently in doctors' offices or outpatient clinics compared with an emergency department. Hence, the emergency department based NEISS and systems such as the Bureau of Labor Statistics complement each other in characterizing the injury burden of workers in the United States.
Besides its medical venue, NEISS is limited by the ability to reasonably identify injuries as work related based on the information in the emergency department record.19 For a variety of reasons, injured workers may not specify to the emergency department staff that their injury occurred on the job. Also, the emergency department staff, with their focus on treatment issues, may omit details of the injury circumstances in the medical record that would allow work association. The National Hospital Ambulatory Medical Care Survey (NHAMCS), which also has an emergency department based surveillance component, has similar limitations.20, 21 NHAMCS reviews medical records in a larger sample of 400 hospitals, but only about one out of every 20 records during a four week period each year. This resulted in approximately 1000 occupational cases in the 1998 sample on which to base national estimates. Work relatedness was unknown for 29% of all NHAMCS emergency department injury visits in 1998, however unknown cases have been shown to resemble the characteristics of non-work related injury visits.21 Additionally, NHAMCS estimates include revisits to the same emergency department and exclude work related illnesses, whereas NEISS excludes revisits and includes illnesses. Despite these differences, the NHAMCS estimate for emergency department treated work related injuries in 1998 was 4.4 million, which is reasonably similar to the NEISS estimate of 3.6 million.
Based on the 1988 National Health Interview Survey Occupational Supplement, an estimated (95% confidence interval) 34(5)% of occupational injuries were treated in an emergency department.10 Although patterns of medical usage may well have changed since 1988, if the proportion of injured workers using an emergency department remained about the same in recent years, the 1998 NEISS emergency department treated estimate extrapolates to 10.5 million occupational injuries and illnesses and the NHAMCS estimate extrapolates to 12.9 million overall.
By way of comparison to these extrapolated estimates, the 1998 National Health Interview Survey (NHIS) estimated that 5.9 million medically attended injuries and poisonings occurred while performing paid work, based on self reports from 38 000 household interviews.22 The NHIS estimate is considerably lower than the emergency department based extrapolated estimates. The differences may be owing to respondent interpretation of work relatedness, the NHIS self reporting with a three month recall period, the NHIS question format where paid work is only one of several options for what the person was doing at the time of injury, and the goals of the surveys.
For the same year, the 1998 Bureau of Labor Statistics survey estimate of 5.9 million injuries and illnesses23 is also lower than the NEISS and NHAMCS extrapolated estimates, at least in part because the Bureau of Labor Statistics survey is constrained to private industry in the United States, excluding federal, state, and local government from national estimates, self employed, farms with fewer than 11 employees, and private households. By using the Current Population Survey, we estimate that private industry represented about 78% (100.5 million wage and salary FTE including small farms and excluding private households) of FTE (129.2 million) in 1998. Thus, by crude extrapolation of the 5.9 million private industry incidents, 7.6 million injuries were incurred by workers among all industries—an estimate that is still lower than the emergency department extrapolated estimates. A disproportionate number of injuries among the workers not covered by the survey as well as reporting issues may contribute to the difference. Mandatory reporting to the Bureau of Labor Statistics produces very high response rates from the approximately 165 000 establishments sampled as well as high precision. Because the survey captures incidents recorded on the Occupational Safety and Health Administration No 200 log, employer perceptions of what is work related and adherence to current reporting guidelines may affect the survey from year to year.24 Additionally, similar to issues with NEISS and case identification from medical records, the employer can only report injuries or illnesses about which they have been notified by the worker. Although under-reporting has been noted,25–27 the Bureau of Labor Statistics survey remains the primary surveillance system in the United States for detailed overall estimates of the number and rates of work related injuries and illnesses by detailed breakdown of industry categories as well as characteristics of worker demographics, nature of injury, event, and source of injury for days-away-from-work incidents.
Implications for occupational injury prevention
Reporting issues, work related definition, sampled population, nature of survey/surveillance, as well as the form of medical treatment undoubtedly all influence the differences in the estimates among the four surveillance systems. Nevertheless, with estimates ranging from 6 million to nearly 13 million medically treated incidents, there is a substantial and unacceptable injury and illness burden to workers in the United States that can be addressed through prevention based on the information supplied by these surveillance systems. The Department of Health and Human Services Healthy People 2010 objectives target a 30% reduction in workplace injury rates over the next decade.28 The Bureau of Labor Statistics survey and NEISS will be used to assess reductions.
Despite apparent improvements, as suggested by NEISS data, young workers continue to have high rates of injuries that need to be addressed. Reducing lacerations and burns, injuries that are typically treated and released from an emergency department but may have significant long term impact such as on hand mobility, could substantially affect young worker injury rates. The Bureau of Labor Statistics survey has identified two areas of severe injuries to young workers: falls from ladders and incidents where a worker is caught or compressed by equipment or objects.16 Although not enumerated herein by age, falls and contact with objects are the two leading causes of hospitalization for workers initially treated in an emergency department. Further detailed analysis of the NEISS data along with followback interviews of injured workers should help elucidate reasonable safety interventions as demonstrated for adolescents working in fast food establishments.4 Improvements in the recording of work incident details in the medical chart would also substantially aid this task.
Although young workers less than 20 years of age continue to have higher rates than older workers, their injuries accounted for less than 8% of all occupational injuries treated in an emergency department in 1998. Workers aged 20–44 years had 73% of emergency department treated injuries that need to be addressed through better safety training, hazard assessments, tool and workstation design, engineering controls, and use of personal protective equipment. Investments in improved safety for these workers will likely have long term benefits towards reducing injuries as they age.
Acknowledgments
I thank Arthur McDonald, Tom Schroeder, Eileen Kessler, and other members of the CPSC Division of Hazards and Data Systems for their continued efforts in the management of NEISS and collaboration with NIOSH in the collection of work related injuries and illnesses, as well as the coders at each NEISS hospital for their diligent medical record abstraction. Additionally, I thank Larry Layne and Pam Hixon of NIOSH for their substantial efforts in the collection, coding, editing, and analysis of NEISS work related injury data.
References
Footnotes
↵* The Consumer Product Safety Commission (CPSC) operates NEISS. The National Institute for Occupational Safety and Health (NIOSH) has collaborated with CPSC to collect work related injuries and illnesses treated in an emergency department (without regard to consumer product involvement) during 1981–87, 1992–95 (with age or industry restrictions), and 1996 through the present (without restrictions).
↵† The NEISS sample design for work related emergency department visits was updated in October 1997 based on the 1995 listing of hospitals in the United States (SMG Marketing Group, Chicago, IL). This resulted in changes in the makeup of hospitals within each size stratum in the sample and the statistical weight for cases that are used to extrapolate to national estimates compared with earlier reports.9, 10
↵‡ Work related injury and illness information was collected at two thirds of the 101 NEISS hospitals utilized by the CPSC for the collection of product related injuries and illnesses. The 67 hospital sample was distributed proportionately across the strata similar to the larger CPSC sample and weighted to appropriately account for the smaller sample size.
↵§ Because of the NEISS sampling frame update in 1997 and minor procedural modifications, the previously reported estimate (3.3 million) for 1996 is crudely estimated to be 4% lower (NIOSH and CPSC unpublished data).