


Abstract
Background: Injury is recognized as an important public health problem not only in high-income countries, but also in low- and middle-income countries. Other studies have shown inverse association between economic development and unintentional injury mortality (UIM) among children and young adults. In this study we aimed to examine the association between economic development and UIM rates among 45+ years-old populations within the theoretical framework of epidemiologic transition. Methods: The World Health Statistics Annual 1996 was used as the main source of data. The relationship between UIM rates and gross national product (GNP) per capita was studied by using two methods: (i) with regression analysis, and (ii) by categorizing the data in four income-based country groups and the comparison of differences in their mean values. The ages were divided into four sub-groups: 45–54 years, 55–64 years, 65–74 years and 75+ years. Results: UIM rates were inversely correlated with GNP per capita in 45–54, 55–64 and 65–74 year-olds for both sexes. On the other hand, among the 75+ years populations for both sexes, the association between GNP per capita and UIM rates was positive (male, r = 0.234, and female, r = 0.337). Conclusion: Our study suggests that UIM rates shows deviating patterns across age groups. UIM exhibits declining rates among younger age groups by economic development which is consistent with what could be expected from the epidemiologic transition model, while injuries in older groups appear to increase by economic development. These findings imply that unintentional injury, as a whole, is not a homogeneous phenomenon from an epidemiological transition perspective.
Today injury is recognized as an important public health problem not only in high-income industrialized countries, but also in low- and middle-income countries. In many low-income countries injuries are rapidly becoming a major cause of death and disability1,2 and have a greater impact on the health of populations than has generally been recognized.3 According to a World Health Organization (WHO) report on injury, an estimated 5 million people worldwide died from injuries in the year 2000: a mortality rate of 83.7 per 100000 population.4 It is also estimated that within the first decades of this millennium injuries will rival communicable diseases as a cause of ill health globally.5 The magnitude of the problem, however, varies considerably by age, sex, region and economic development. Prevention and control of injury require information about the causes of injury and determinants or risk factors.
Economic development is one of the main determinants of changing patterns of mortality, disease and injury.6–8 In order to examine the association between economic development and injuries; several cross-sectional studies have been performed so far. It has been found that on the scale of the global level, unintentional injury mortality (UIM) rates show a negative correlation with the gross national product (GNP) per capita when studying 1–14 year-olds.9 In a similar study, among 15–44 year-olds, Ahmed and Andersson also found an inverse association between UIM rates and GNP per capita,10 while the GNP per capita in a traffic injury study showed a positive correlation with traffic injury mortality in the global population.11 On the global level, therefore, these studies have produced different results by injury types and age groups. Moreover, most of this research has focused on children and younger adults and there is a dearth of information on the association between UIM rates and economic development among older adults and the elderly population.
To understand these dynamic changes of mortality in relation to economic development, it is necessary to refer to the theory of ‘epidemiologic transition’.12 Epidemiological transition would involve a one-way movement through a sequence of three stages. These start with an ‘Age of Pestilence and Famine’ (stage 1), through an ‘Age of Receding Pandemics’ (stage 2), to an ‘Age of Degenerative and Man-Made Diseases’ (stage 3). Further changes in the mortality profile have been associated with a proposed fourth stage of transition described by Olshansky and Ault.13 They have called this the ‘Age of Delayed Degenerative Diseases’: a stage characterized distinctly by rapid declines in degenerative disease in advanced ages.
The aim of this study is to examine the association between economic development and UIM rates among populations 45 years and older within the theoretical framework of epidemiologic transition.
Methods
Data sources and study population
The World Health Statistics Annual 1996 was used as the main source of data.14 All countries reported in the World Health Statistics 1996 were reviewed, but, if unavailable, the closest preceding or subsequent years in the period of 1994–1995 were collected. Some countries were excluded due to small population size (<1 million), or out of date data (earlier than 1994), or lack of information about GNP and population subgroups. The GNP per capita for the same year was obtained from the World Development Indicators 1998.15 The ages were divided into four sub-groups: 45–54-years, 55–64-years, 65–74-years and 75+ years.
Data classifications
Unintentional injury was coded as E47-53 under the International classification of diseases (ICD) 9th edition and V01-Y98 under the ICD-10.
Table 1 shows the country groups and their important characteristics. Country groupings were obtained from the World Health Development Indicators 1998. The estimates for the republics of the former Soviet Union were preliminary.
Income-based country groups, their abbreviation, GNP values used for grouping, countries and mean (±SD) of GNP per capita, 1996
| Income-based country groups | GNP per capita (US$) | Countries (year of data)a | Mean GNP per capita (±SD) |
|---|---|---|---|
| Low-income countries, n = 5 | 785 or less | Armenia, Azerbaijan, China (94)b, Kyrgyzstan, Republic of Moldova | 556.5 (57.2) |
| Lower middle-income countries, n = 15 | 786–3115 | Belarus, Bulgaria, Colombia (94), Costa Rica (95), Cuba, Estonia, Macedonia, Kazakhstan, Latvia, Lithuania, Romania, Russian Federation, Thailand (94), Ukraine | 1970.9 (615.5) |
| Upper middle-income countries, n = 8 | 3116–9635 | Argentina, Chili (94), Croatia, Czech Republic, Hungary, Mexico (95), Poland, Slovenia | 5068.89 (2206.3) |
| High-income countries, n = 24 | 9636 or more | Australia (95), Austria, Canada, Denmark, Finland, France, Germany, Greece, Hong Kong (95), Ireland, Israel, Italy (95), Japan, Republic of Korea, Netherlands, New Zealand, Norway (95), Portugal, Singapore, Spain (95), Sweden, Switzerland, UK, USA | 23426.8 (8769.5) |
a: Figures in parentheses following the country names refer to the year of the data and no parentheses means that the data is for 1996
b: China reported mortality in two selected data sets, as rural and urban areas. The estimation of the average mortality rate was calculated by weighting of rural and urban distribution (rural = 0.7 and urban = 0.3) (World Bank, 1998)
Statistical methods
Where Y = UIM rates/100 000 populations, X = GNP per capita in US$, i = age group (45–54, 55–64, 65–74 and 75+ years), and k = gender.
The second method used was the categorization of the data into four income-based country groups and then a comparison of the differences in their mean values. Two levels of P-value (P < 0.01 and P < 0.05) were used as significance levels.
Results
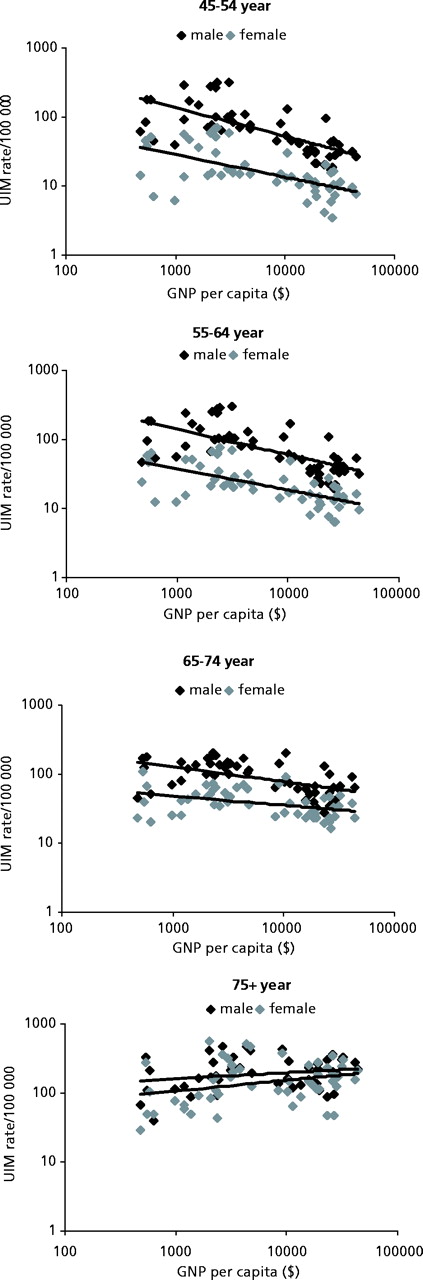
Figure 1 shows relations between GNP per capita and UIM rates by age- and gender-specific groups for 52 countries by using the log–log model. It illustrates that there was an inverse correlation between the two variables among 45–54, 55–64 and 65–74 year-olds, while a moderate positive correlation was seen among 75+ year-olds for both sexes.
The scatterplot of the relationship between GNP per capita and unintentional injury mortality rates by age- and sex-specific groups in 52 countries, 1996
The association was stronger among younger age groups compared to older groups for both sexes (table 2). For males, Pearson correlation coefficients was highest in the 45–54 years age group (r = −0.69) and correlation coefficients decreased with increasing age and was lowest, however positive, in the age group 75+ years (r = 0.22). The correlation coefficient was also lowest and positive for the females in the age group 75+ years (r = 0.30). Male sex and older age groups were related to higher UIM rates. The slope of trend lines (β) for males were steeper than for females in the age ranges 45–54, 55–64 and 64–74 years. For both sexes, the trend line increased (males, β = 0.09 and females, β = 0.16) with GNP per capita among 75+ year-olds: this meant that higher UIM rates among the 75+ years age groups were associated with higher per capita GNP.
Regression analysis results for unintentional injury mortality rates and GNP per capita by age- and sex- specific groups, 1996
| Age-sex group | r | r2 | Regression coefficient (β) | Standard error (SE) | t-value | P-value | ||||||
|---|---|---|---|---|---|---|---|---|---|---|---|---|
| Males | ||||||||||||
| 45–54 years | −0.688 | 0.474 | −0.415 | 0.062 | −6.713 | <0.01 | ||||||
| 55–64 years | −0.661 | 0.437 | −0.364 | 0.059 | −6.225 | <0.01 | ||||||
| 65–74 years | −0.546 | 0.298 | −0.219 | 0.047 | −4.611 | <0.01 | ||||||
| 75+ years | 0.222 | 0.049 | 0.086 | 0.054 | 1.610 | 0.114 | ||||||
| Females | ||||||||||||
| 45–54 years | −0.592 | 0.351 | −0.327 | 0.063 | −5.196 | <0.01 | ||||||
| 55–64 years | −0.630 | 0.397 | −0.309 | 0.054 | −5.742 | <0.01 | ||||||
| 65–74 years | −0.393 | 0.155 | −0.130 | 0.043 | −2.778 | <0.08 | ||||||
| 75+ years | 0.304 | 0.092 | 0.157 | 0.070 | 2.257 | <0.05 | ||||||
Table 3 presents means of UIM rates and UIM as a percentage of total mortality by income-based country and age–sex groups. For both sexes in all income groups, UIM rates were higher among 75+ year-olds, while UIMs as percentage of total mortality were higher among younger groups (i.e. 45–54 years). For most income-groups, UIM as a percentage of total mortality decreased by increasing age groups for both sexes. UIM rates started to increase in the countries with a GNP per capita income more than US$1000, which are lower middle-income countries (LoMICs) and are mostly former Soviet or Eastern European countries. The mortality rates then gradually declined when GNP per capita income reached approximately US$5000.
Means for unintentional mortality rates (per 100000), injury as percentage of all causes of mortality rates by income, age- and sex- specific groups
| Income based country groups | Males | Females | ||||
|---|---|---|---|---|---|---|
| Injury mortality rate | Injury as percentage of total mortality | Injury mortality rate | Injury as percentage of total mortality | |||
| 45–54 years | ||||||
| LIC | 108.8 | 10.2 | 30.9 | 6.3 | ||
| LoMIC | 174.5 | 13.4 | 37.1 | 7.4 | ||
| UpMIC | 80.5* | 9.5* | 15.4* | 4.1* | ||
| HIC | 38.9** | 7.9 | 11.1* | 4.3 | ||
| 55–64 years | ||||||
| LIC | 113.4 | 4.7 | 41.6 | 3.3 | ||
| LoMIC | 169.8 | 6.7 | 42.6 | 3.9 | ||
| UpMIC | 94.8* | 4.9 | 23.2* | 2.6 | ||
| HIC | 47.0** | 3.7 | 15.6* | 2.6 | ||
| 65–74 years | ||||||
| LIC | 112.5 | 2.2 | 52.2 | 1.7 | ||
| LoMIC | 136.9 | 2.9 | 47.8 | 1.8 | ||
| UpMIC | 121.0 | 2.8 | 52.5 | 2.2 | ||
| HIC | 66.3** | 2.1 | 32.2** | 2.0 | ||
| 75+ years | ||||||
| LIC | 153.6 | 1.8 | 102.6 | 0.5 | ||
| LoMIC | 205.6 | 2.4 | 160.6 | 1.7 | ||
| UpMIC | 305.8 | 2.5 | 283.4 | 2.7 | ||
| HIC | 202.5** | 2.0 | 167.4** | 2.1 | ||
LIC, low-income countries; LoMIC, lower middle-income countries; UpMIC, upper middle-income countries; HIC, higher-income countries
P <0.01;
P <0.05; P-values refer to comparison between two consecutive country groups
Discussion
Our findings are mostly in line with those of earlier studies dealing with economic differences in injury risks. There are, indeed, considerable economic gradients in injury risks across nations.16,17 Yet some findings are new and put the dynamics of injury mortality by economic development in a brighter light.
UIM rates and economic development in older adults and the elderly have complex relations that are mediated by the victim's age and sex. Our results show an inverse association between economic development and UIM rates among the age groups 45–54, 55–64 and 65–74 years. The association between the two variables became weaker by increasing age and turned positive for both sexes among 75+ year-olds, meaning that UIM rates among the elderly are higher in the higher income countries. In accordance with other studies, UIM rates were also found to be higher in the elderly (75+ years) in all country groups.16,17
Comparison with previous studies
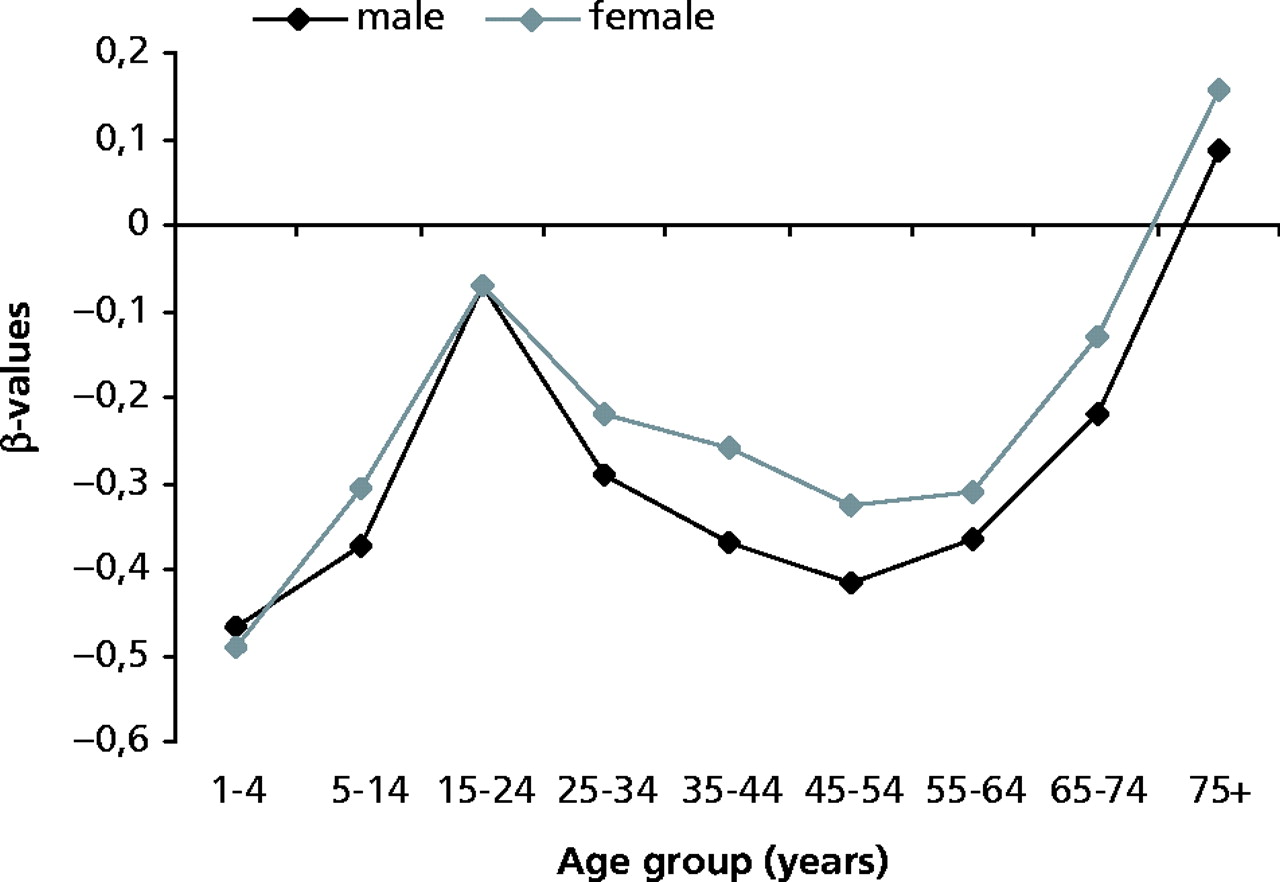
The present study was inspired by earlier studies among younger age groups. Plitponkarnpim et al. studied magnitude and patterns of unintentional child injury mortality by economic development (1–14 years),9 and Ahmed and Andersson performed a similar analysis among adolescents and young adults (15–44 years).10 After combining these two studies with our results, we found that it was the younger children (1–4 years) who had the strongest negative association between economic development and UIM rates, while a weak or positive relation was seen among age groups 15–24 years and 75+ years (figure 2). This is due to high rates of UIM among the 15–24 and 75+ years age groups in high-income countries, rather than low rates in low-income countries. Results from these studies are also consistent with regard to gender differences in injury mortality; mortality among males was higher than that among females in all age groups.
Regression coefficients (β) for unintentional injury mortality rates and economic development by age- and sex-specific groups
Concerning the dynamic changes in UIM rates, LoMICs were found to be in the stage of high priority where both injury mortality rates and injury as percentage of total deaths are high for most age–sex groups. Furthermore, many countries in these studies were former Soviet republics, a region where a political and economic crisis was experienced in the early and mid 1990s. This crisis may be one of the important causes of the high rates of injury mortality in LoMICs, since more than 50% of the LoMICs in these studies were part of the former Soviet Union. However, the populations represented in these studies total half of the world's population. This study may not yield accurate results in all details, but it does provide a clear indication of the global injury situation.
Study limitations and data validity
Although WHO data are the best estimates available at the present time for cross-national study, they do suffer from a number of limitations. The first is missing information. Whereas vital registration systems capture around 17 million deaths annually, this represents just under three-quarters of the total estimated global mortality.4 Some regions of the world are especially poorly represented in this regard; for example, national vital registration data were only available for 19% of the countries in the African region.4 In countries where such data are missing, information from other sources (e.g. survey data) coupled with indirect demographic techniques are used to estimate mortality. However, extrapolations of this type should be interpreted with caution.
Another problem is the limited sample size for low-income countries and the regional distribution, especially for middle-income countries. There are 35 European countries (11 of which are newly independent former USSR countries), six Latin American and Caribbean countries, two North American and seven countries representing Western Pacific regions. Only one African country and one South-east Asian country were included. So there is great difficulty in generalizing the results. The study design could also be susceptible to aggregation bias; this means that associations observed for pooled countries do not necessarily apply to individual societies.
Cross-national differences in coding practice may also have a profound influence on published cause-of-death statistics, as well as similar changes over time in single countries.18 We have chosen to present data as the WHO gives them, however, we believe that results should be interpreted with caution for this reason.
The UIM and epidemiologic transition model
While UIM rates among younger populations, according to earlier studies,9,10 confirm the theory of ‘epidemiologic transition’ stage 1–3 well [i.e. high child mortality in low-income countries, and mortality is dominated by degenerative and man-made disease in high-income countries], as an example of man-made disease which is clearly declining during the fourth stage of transition. The pattern is more complex and dubious when including older population sub-groups. Our results actually indicate that UIM increases with improved economic condition among the elderly, while declining rates are seen for all other age groups. It should also be mentioned that not all countries that entered the third stage of epidemiological transition, where man-made diseases are higher, have yet entered the fourth. Several countries in Europe (particularly Eastern Europe and the former Soviet countries) continue to experience higher injury mortality. In contrast, some countries outside Europe and North America namely Australia, New Zealand, Japan and Israel have entered the fourth stage.
The 21st century and beyond, however, is expected to be one of great human achievements in disease control, health promotion and further prolongation of healthy life.19 The fundamental change in the age structure, with rapidly increasing proportions of successive birth cohorts surviving into advanced ages in high-income countries, literally creates an entirely new segment of the population with unique health care needs and demands that are tied to fall-related injuries, self-inflicted injuries, degenerative diseases and age-associated physiological impairments. Decreasing this burden of injury among the elderly is one of the main challenges for public health in the next century in high-income countries.
Conclusion
Our study suggests that UIM rates shows deviating patterns across age groups. UIM exhibits declining rates among younger age groups by economic development, which is consistent with what could be expected from the epidemiologic transition model, while injuries in older groups (75+ years) appear to increase by economic development. These imply that unintentional injury, as a whole, is not a homogeneous phenomenon from an epidemiological transition perspective.
This study aimed to examine the global cross-sectional association between economic development and unintentional injury mortality among older adults and the elderly.
Our results show that unintentional injury generally tend to decline by economic development except among the elderly (yrs 75+) for which an increasing tendency was indicated.
The exploratory nature of our study design calls for more rigorous cross-national comparisons based on longitudinal data.
We wish to thank the Swedish International Development Cooperation Agency, Sida, for its valuable support.
References
Zwi BA, Forjuoh S, Murugussampillay S, et al. Injury in developing countries: policy response needed now.
Mock CN, Adzota E, Denno D, et al. Admission for injury at a rural hospital in Ghana: Implication for prevention in the developing world.
World Health Organization. The Injury Chart Book—a graphical overview of the global burden of injuries. Geneva: WHO,
Murray CJL, Lopez AD, editors. The Global Burden of Disease: a comprehensive assessment of mortality and disability from diseases, injuries and risk factors in 1990 and projected 2020. Cambridge, MA: Harvard University Press,
Moniruzzaman S, Andersson R. Relationship between economic development and suicide mortality: a global cross-sectional analysis in an epidemiological transition perspective. Public Health
Rogers RG, Wofford S. Life expectancy in less developed countries: socioeconomic development or public health?
Plitponkarnpim A, Andersson R, Jansson B, et al. Unintentional injury mortality in children: a priority for middle income countries in the advanced stage of epidemiological transition.
Ahmed N, Andersson R. Unintentional injury mortality and socio-economic development among 15–44 year-olds: in a health transition perspective.
Söderlund N, Zwi AB. Traffic-related mortality in industrialized and less developed countries.
Omran AR. The epidemiologic transition: a theory of the epidemiology of population change.
Olshansky SJ, Ault AB. The fourth stage of epidemiologic transition: the age of delayed degenerative diseases.
Smith GS, Barss P. Unintentional injuries in developing countries: the epidemiology of a neglected problem.
Laglois JA, Smith GS, Baker SP, et al. International comparisons of injury mortality in the elderly: issues and differences between New Zealand and the United States.
Jansson B, Ahmed N. Epilepsy and injury mortality in Sweden-the importance of changes in coding practice.

Comments