Article Text

Abstract
Introduction Non-fatal shooting rates vary tremendously within cities in the USA. Factors related to structural racism (both historical and contemporary) could help explain differences in non-fatal shooting rates at the neighbourhood level. Most research assessing the relationship between structural racism and firearm violence only includes one dimension of structural racism. Our study uses an intersectional approach to examine how the interaction of two forms of structural racism is associated with spatial non-fatal shooting disparities in Baltimore, Maryland.
Methods We present three additive interaction measures to describe the relationship between historical redlining and contemporary racialized economic segregation on neighbourhood-level non-fatal shootings.
Results Our findings revealed that sustained disadvantage census tracts (tracts that experience contemporary socioeconomic disadvantage and were historically redlined) have the highest burden of non-fatal shootings. Sustained disadvantage tracts had on average 24 more non-fatal shootings a year per 10 000 residents compared with similarly populated sustained advantage tracts (tracts that experience contemporary socioeconomic advantage and were not historically redlined). Moreover, we found that between 2015 and 2019, the interaction between redlining and racialized economic segregation explained over one-third of non-fatal shootings (approximately 650 shootings) in sustained disadvantage tracts.
Conclusion These findings suggest that the intersection of historical and contemporary structural racism is a fundamental cause of firearm violence inequities in Baltimore. Intersectionality can advance injury prevention research and practice by (1) serving as an analytical tool to expose inequities in injury-related outcomes and (2) informing the development and implementation of injury prevention interventions and policies that prioritise health equity and racial justice.
- Socioeconomic Status
- Urban
- Health Disparities
- Geographical / Spatial analysis
- Descriptive Epidemiology
- Firearm
Data availability statement
Data are available upon reasonable request. Some data may not be released due to policy and/or statute.
This is an open access article distributed in accordance with the Creative Commons Attribution Non Commercial (CC BY-NC 4.0) license, which permits others to distribute, remix, adapt, build upon this work non-commercially, and license their derivative works on different terms, provided the original work is properly cited, appropriate credit is given, any changes made indicated, and the use is non-commercial. See: http://creativecommons.org/licenses/by-nc/4.0/.
Statistics from Altmetric.com
- Socioeconomic Status
- Urban
- Health Disparities
- Geographical / Spatial analysis
- Descriptive Epidemiology
- Firearm
WHAT IS ALREADY KNOWN ON THIS TOPIC
Non-fatal shootings are a significant public health issue and are on the rise in Baltimore, Maryland.
Social and structural factors, including concentrated poverty and segregation, contribute to firearm violence.
Intersectionality is a useful theoretical framework for understanding how multiple social processes of marginalisation and power intersect with one another to produce health inequities between individuals and social groups.
WHAT THIS STUDY ADDS
An understanding that the intersection of historical and contemporary structural racism is a fundamental cause of firearm violence inequities.
An intersectional framework that researchers can use to effectively investigate and communicate how social and structural factors are related to injury prevention.
HOW THIS STUDY MIGHT AFFECT RESEARCH, PRACTICE OR POLICY
This study provides tools and intersectional measures that advocates, policy-makers and public health practitioners can use to (1) Highlight and frame violence inequities to the general public and (2) Develop, implement and evaluate violence prevention policies and interventions with a lens towards health equity and racial justice.
Introduction
Non-fatal shootings are a significant public health issue in the USA. More than 200 non-fatal shootings occur every day in the USA and these shootings are even more of an acute problem for Baltimore city.1 Over 5000 non-fatal shootings have occurred in the 7 years since the 2015 Baltimore uprising after Freddie Gray’s death.2 This sizeable number of shootings in a city of 585 000 people has resulted in numerous physical injuries, high healthcare system costs and an immense amount of trauma, grief and stress for city residents.3 4 Survivors of non-fatal shootings in particular experience profound physical, psychological, medical and financial impacts after their shooting.5 6 However, non-fatal shootings receive far less media attention compared with fatal shootings.7 Moreover, the burden of non-fatal shootings is not evenly distributed across Baltimore’s neighbourhoods, and it is not fully understood which factors contribute to the inequitable distribution of non-fatal shootings. Two factors related to structural racism, (historical) redlining and (contemporary) racialized economic segregation, may play a role in shaping spatial disparities in violence.
Redlining in the 1930s ‘spatially marked’ certain neighbourhoods as not desirable for investment.8 This process was led by the New Deal era agency Federal Home Owners’ Loan Corporation (HOLC) and informed by racist housing policies and practices largely developed by Baltimore politicians decades earlier.9 HOLC’s primary tool for operationalising the redlining process was through the residential security maps in over 200 cities throughout the USA.10 In these maps, HOLC assessors designated neighbourhoods into one of four different categories, each with a HOLC grade and corresponding colour (in descending order, A-green, B-blue, C-yellow and D-red). The HOLC assessors’ determination of how to categorise neighbourhoods was largely based on racist, xenophobic and classist ideologies that deemed neighbourhoods with low-income housing stock and large populations of working-class people, immigrants, Black people and other people of colour as ‘detrimental’ from a real estate perspective.8–10 Black neighbourhoods were systematically classified by HOLC assessors as hazardous for investment.10 Thus, in residential security maps, Black neighbourhoods were drawn and outlined in maps with red, hence the term ‘redlining’. Redlining and other racist housing policies and practices had long-lasting effects on the economic development of historically Black neighbourhoods. During the intervening years since the redlining maps were created, redlined Black neighbourhoods have experienced a continuous denial of economic capital and wealth, which has resulted in lower home values and fewer neighbourhood amenities and resources.11–13 Contemporary neighbourhoods that are highly segregated and socioeconomically disadvantaged tend to have high levels of concentrated poverty and disinvestment.14 This dynamic is often associated with built and social environment problems within those neighbourhoods.15 In his book The Black Butterfly, Brown highlights Baltimore’s racial hypersegregation and provides several factors related to spatial racism that have led to the deterioration and current struggles of redlined Black neighbourhoods.11 This includes several factors directly related to historic redlining and contemporary segregation including (1) the usage of the real estate market to extract wealth and resources, (2) the housing precarity of Black residents in highly segregated neighbourhoods and (3) the resource apartheid of Baltimore’s Black and White neighbourhoods.11
Both redlining and segregation are associated with many health and public safety outcomes, including firearm violence.16–22 However, redlining and segregation have generally been examined separately in violence research. Investigating historical and contemporary forms of structural racism individually may not adequately capture the social, structural and spatial dynamics that lead to firearm violence inequities. An alternative way to examine the different dimensions of structural racism, such as redlining and segregation, is through an intersectional perspective. Bowleg describes intersectionality as a theoretical framework that explores how different social categories intersect with one another to reflect interlocking systems of privilege and oppression at the macrosocial level.23 Researchers have used intersectionality as an analytical tool to better understand systems of power, contextualise the experiences of marginalised communities, and expose and address health and social inequities.24 Violence has long been a theme in intersectionality research, specifically within the domains of legal studies, sociology, gender studies and qualitative research.25 26 However, there has been limited research that has used quantitative-based intersectional analysis to investigate firearm violence inequities. Our goal was to describe how two forms of structural racism and economic isolation—historical redlining and contemporary racialized economic segregation—are related to non-fatal shootings in Baltimore.
Methods
We performed an ecological cross-sectional study of non-fatal shootings in Baltimore, Maryland. We excluded 51 of Baltimore’s 200 census tracts from our analyses. Of the 51 tracts excluded, 49 tracts were excluded because a majority of the tract’s land mass was not covered by one HOLC grade. Two additional tracts were excluded as they did not contain residential zoning. We assigned census tracts a HOLC grade if at least 50% of the tract’s residentially zoned land was covered by a single HOLC grade. Our final dataset included 149 census tracts. The primary outcome was the 2015–2019 non-fatal shooting data provided by the Baltimore Police Department. A total of 3435 non-fatal shootings were geocoded and aggregated to the census tract level. To calculate the non-fatal shooting rate, we divided the total number of shootings in a census tract by its total population in the 2019 5-year US Census Bureau’s American Community Survey (ACS). We scaled our rates to annualised rates per 10 000 residents (the size of a large neighbourhood).
We had two primary neighbourhood-level exposures: historical redlining and contemporary racialized economic segregation. For historical redlining, we dichotomised the HOLC grades from the 1937 Baltimore residential security map.10 We operationalised our redlining construct based on whether the census tract’s HOLC grade would be considered desirable (or not) for home loans and investment. Census tracts with high HOLC grades of ‘A’ and ‘B’ (areas that were viewed by HOLC assessors as being the ‘best’ and ‘still desirable’ for investment) were defined as having no redlining. Conversely, census tracts with low HOLC grades of ‘C’ and ‘D’ (areas that were viewed by HOLC assessors as being ‘definitely declining’ and ‘hazardous’ for investment) were defined as having high redlining. For contemporary racialized economic segregation, we generated tract-level Index of Concentration at the Extremes (ICE) scores, using non-Hispanic Black and non-Hispanic White median annual household income from the 2019 5-year ACS.17 Our study’s ICE scores can be used as a proxy for whether the type of segregation within a census tract is advantageous or detrimental for the tract’s residents from the perspective of socioeconomic status and neighbourhood resource allocation. The ICE measure quantifies the concentration of households in Census tracts that are most socioeconomically advantaged (non-Hispanic White Households with an income of US$100 000) versus most socioeconomically disadvantaged (non-Hispanic Black Households with incomes below the federal poverty line of US$25 000). Census tracts with an ICE score above the median split were defined as having high ICE scores (greater advantage) and tracts with scores below the median split were defined as having low ICE scores (greater disadvantage). We combined the two binary variables (redlining and segregation) across their axes to create four intersectional groups which describe our study’s census tracts (figure 1): (1) Sustained advantage (tracts that experience contemporary socioeconomic advantage and were not historically redlined); (2) Sustained disadvantage (tracts that experience contemporary socioeconomic disadvantage and were historically redlined); (3) Contemporary advantage (tracts that experience contemporary socioeconomic advantage and were historically redlined) and (4) Previous advantage (tracts that experience contemporary socioeconomic disadvantage and were not historically redlined). A map of Baltimore’s intersectional groups is in figure 2.

Description of intersectional groups.
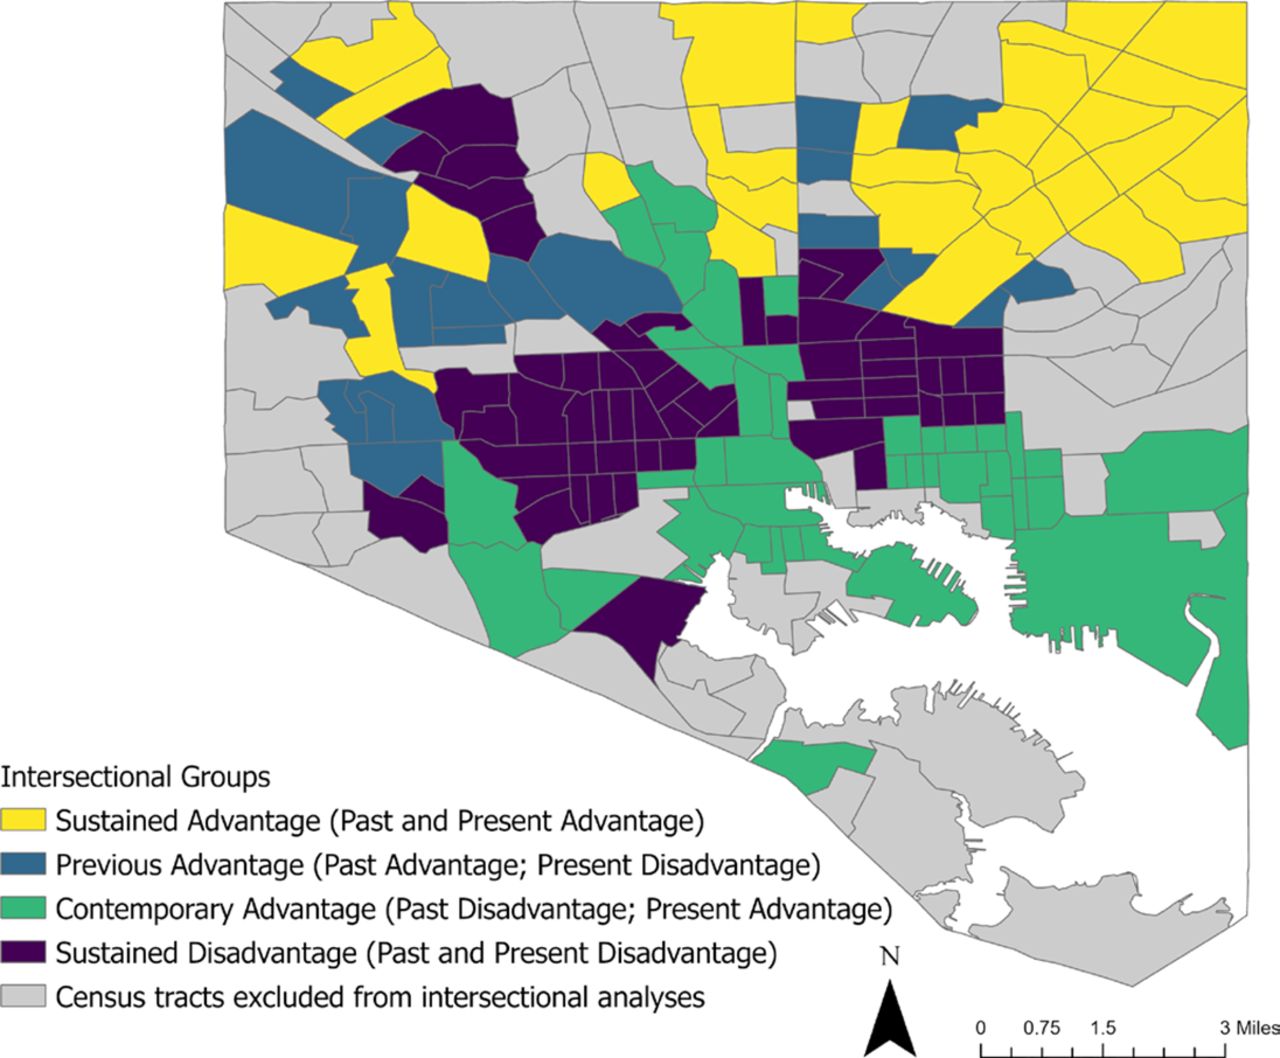
Map of intersectional groups in Baltimore.
We used three measures of additive interaction (joint disparity, excess intersectional disparity and the attributable proportion of excess intersectional disparity) to describe the relationship between redlining and racialized economic segregation on neighbourhood-level non-fatal shooting rates.27 28 The joint disparity describes the difference in average annual non-fatal shooting rate between the sustained disadvantage tracts and sustained advantage tracts. The excess intersectional disparity describes the magnitude to which the intersection of redlining and racialized economic segregation contributes to the joint disparity outcome (as opposed to the contribution of redlining alone or racialized economic segregation alone). The attributable proportion of excess intersectional disparity describes the proportion of non-fatal shootings within sustained disadvantage tracts that can be explained by the intersection of redlining and racialized economic segregation. Before performing our additive interaction calculations, we first determined some descriptive statistics for our four intersectional groups and excluded tracts (see table 1). The results of our additive interaction measures were derived from calculations that used the non-fatal shooting rate averages of our intersectional groups.28 We used a bootstrapping procedure to compute estimated confidence intervals for each intersectional measure (see table 2). We did not adjust for other factors as additive interaction measures are descriptive epidemiological measures.28–30
Descriptive statistics of the four intersectional groups, excluded tracts and Baltimore city average (non-fatal shooting rate and selected socioeconomic indicators).
Intersectional measures for historical redlining and contemporary racialized economic segregation on non-fatal shootings in Baltimore city (2015–2019)
Results
Of the study’s 149 census tracts, 38% were classified as sustained disadvantage, 20% were sustained advantage, 27% contemporary advantage and 15% were previous advantage. Descriptive statistics of the intersectional groups are in table 1. Of the four intersectional groups, the sustained disadvantage group was the most vulnerable on key socioeconomic indicators including median household income, college-educated percentage and vacant housing percentage. The sustained disadvantage and previous advantage groups had high percentages of Black residents (87% and 90%). Interestingly, the contemporary advantage intersectional group had the lowest percentage of Black residents (25%) while the sustained advantage group had a Black resident percentage (56%) that was the closest to Baltimore’s citywide average (62%). The mean yearly average non-fatal shooting rate was 14 per 10 000 residents (range 0–57 per 10 000 residents). For the four intersectional groups, the mean annualised non-fatal shooting rates per 10 000 residents were as follows: sustained disadvantage: 28, previous advantage: 13, contemporary advantage: 8 and sustained advantage 4. We used data visualisation techniques to present the non-fatal shooting rate data in figure 3 (beeswarm plot) and figure 4 (map). There is also a online supplemental figure that displays a combined boxplot and beeswarm plot.
Supplemental material
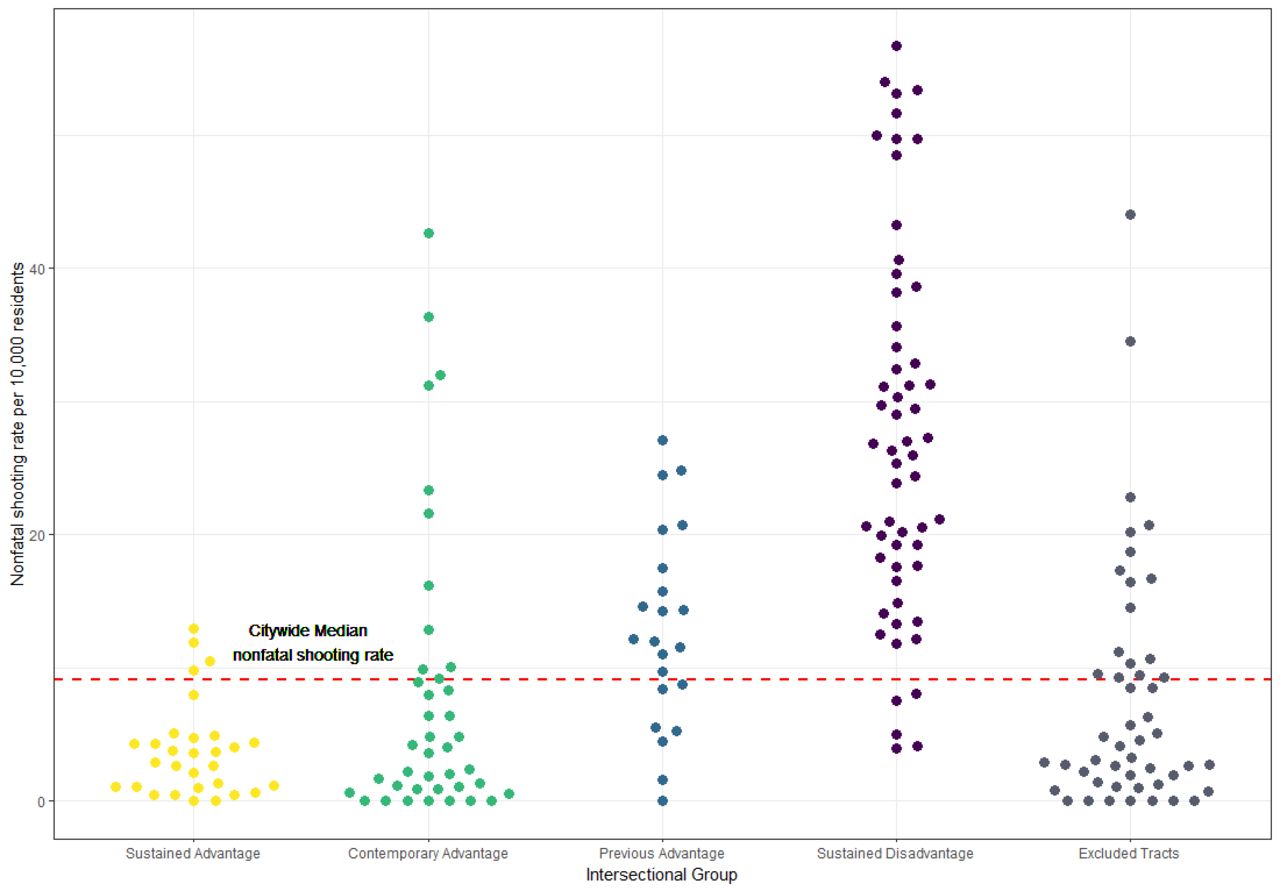
Beeswarm plot of non-fatal shooting rates by intersectional groups, 2015–2019.
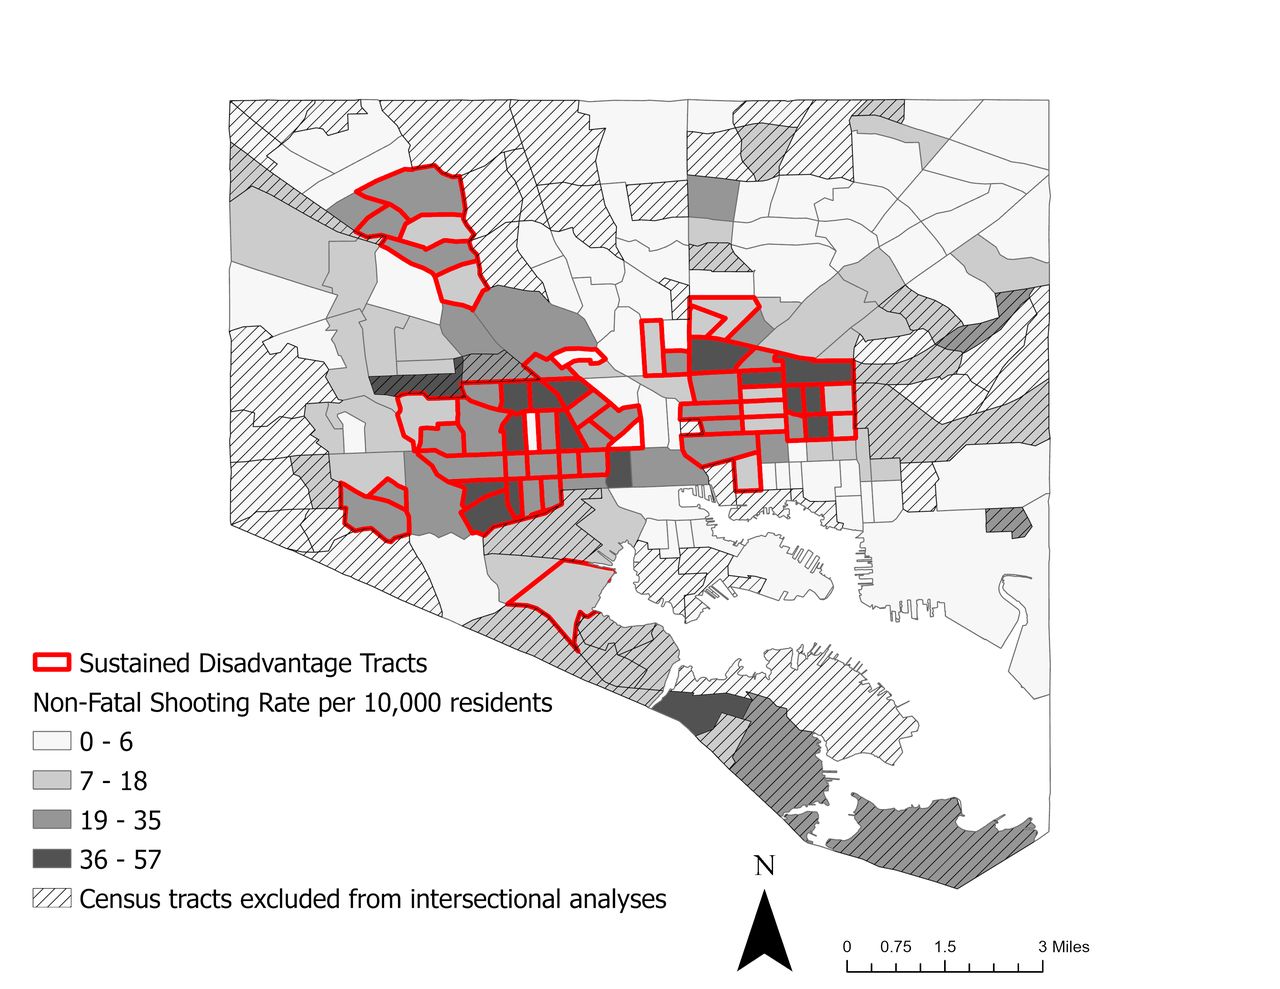
Map of average annual non-fatal shooting rates for Baltimore census tracts, 2015–2019
With regard to our measures of additive interaction (table 2), the joint disparity of non-fatal shootings was 24 per 10 000 residents, meaning that a sustained disadvantage tract of 10 000 residents had on average 24 more non-fatal shootings a year compared with a similarly populated sustained advantage tract. The excess intersectional disparity for non-fatal shootings was 10 per 10 000 residents. This suggests that in a sustained disadvantage census tract of 10 000 residents, the intersection of redlining and racialized segregation results in an excess of 10 non-fatal shootings a year. Moreover, we found the attributable proportion of excess intersectional disparity was 38%, indicating that over one-third of the non-fatal shooting rate in sustained disadvantage census tracts can be explained by the intersection of redlining and racialized economic segregation.
Discussion
Our study found that the intersection of historic redlining and contemporary racialized economic segregation is related to spatial inequities in non-fatal shootings within Baltimore. There was a large disparity in non-fatal shooting rates when comparing sustained advantage and sustained disadvantage census tracts. We found that sustained disadvantage census tracts are highly burdened with non-fatal shootings. A sustained disadvantage tract of 10 000 residents had, on average, two more non-fatal shootings a month compared with a similarly sized sustained advantage tract. The intersection of redlining and racialized economic segregation specifically played a large role in explaining the non-fatal shooting rate gap between sustained advantage and sustained disadvantage tracts. Our study showed that the intersection of redlining and segregation accounted for more than 10 excess non-fatal shootings a year in a sustained disadvantage neighbourhood of 10 000 residents. To put this another way, when looking at a sustained disadvantage neighbourhood over 1 year, 10 additional non-fatal shootings occur in the neighbourhood than what we would expect specifically due to the interplay between historical and contemporary structural racism. Moreover, more than one-third of the non-fatal shooting rate in sustained disadvantage tracts can be explained by the intersection of redlining and racialized economic segregation. This represented 650 of the 1721 non-fatal shootings that occurred in sustained disadvantage tracts between 2015 and 2019. These results suggest that in sustained disadvantage tracts, the contributors to non-fatal shootings go beyond the contemporary neighbourhood landscape. Our findings also emphasise the importance to consider the interaction between historical and contemporary factors when investigating root causes of firearm violence inequities.
To our knowledge, our study is one of the first that uses additive interaction approaches to investigate the relationship of intersecting structural factors with neighbourhood-level violence disparities. Our results align with previous research that independently link high redlining or socioeconomic disadvantage with higher violence rates.16–19 The additive interaction measures we used are primarily descriptive. We did not adjust for other factors as recommended by standard guidelines for descriptive quantitative intersectional research.31 Our research is mainly interested in identifying violence inequalities and revealing real-world risks of firearm violence. While our study’s intersectional approach exposes non-fatal shooting inequities, more research is needed to delineate the pathways from structural racism to firearm violence. To advance intersectionality research on firearm violence, the research field must identify the social, structural and economic forces that influence the diverging trajectories of advantage and disadvantage among the intersectional groups. Academic scholarship that is at the intersection of history, sociology, geography, ethnic studies and public health could provide key insights into understanding how past and present structural racism contributed to the development and decline of Baltimore neighbourhoods. For example, Baltimore-based public health scientists Marisela Gomez and Lawrence Brown have written extensively about how the intersection of racist and classist policies and practices by governmental and private institutions in Baltimore has led to the wealth extraction, resource disinvestment and destruction of Black neighbourhoods.11 32
Our study limitations should be noted. The contemporary advantage intersectional group had highly skewed data and hence the mean and median annualised rates differed significantly (8 vs 4, respectively). Mean rates are used in additive interaction calculations.28 We suspect that the skewed data may partially be a result of the misclassification of non-fatal shooting data from the Baltimore Police Department. Both of Baltimore’s level I trauma centres are located in contemporary advantage tracts. The geographical location of some non-fatal shootings may have been incorrectly classified as occurring at or near these trauma centres. To improve data quality for intersectional research, trauma centre staff, ambulance services and police departments should collaborate and use data sharing principles from the Cardiff violence prevention model framework.33 Nevertheless, our calculations using mean annualised rates resulted in a conservative estimate of additive interaction and underestimated the magnitude of the intersectional contribution to violence inequities in our data. Furthermore, a common limitation in neighbourhood-level data is the Modifiable Areal Unit Problem. Our study conclusions may not be the same if we used a different level of geography since the aggregation of non-fatal shootings would change.
Overall, we used an intersectional framework to illustrate how two interlocking processes related to structural racism—redlining and racialized economic segregation—act individually and simultaneously to reinforce violence inequities in Baltimore City. Currently, narratives around the causes of violence are being debated within our nation’s governmental branches and in the general public. Our research suggests that the intersection of historical and contemporary structural racism is a fundamental cause of firearm violence inequities in Baltimore city. The findings of our study are aligned with research literature delineating structural racism as a fundamental cause of health inequities.34 This suggests that violence prevention efforts should address the root causes of firearm violence, including structural racism and its related impacts (eg, lack of education, housing and economic investment).
Intersectionality is an action-oriented research framework. One of the core tenets of intersectionality is social justice; thus promoting social change should be an active part of the research practice for academics that use intersectionality in their work.24 35 We have used the intersectional measures in our study as an effective tool to communicate the impact of structural racism on firearm violence in Baltimore city and promote community-oriented violence prevention interventions to academic, governmental and community audiences. One of the benefits of using additive interaction measures and other forms of descriptive statistics is that they are effective in communicating complex research findings in a simple and digestible manner.36 We used several data visualisation techniques to convey how the two dimensions of structural racism in our study operate singularly and synergistically to influence firearm violence inequities. Two examples of this are in figures 3 and 4 of this paper. In figure 3, we use a beeswarm plot to highlight the inequities in non-fatal shooting rates between intersectional groups. Each dot in the plot represents one census tract. Tracts only exposed to present-day structural racism (previous advantage) and tracts exposed to combined historical and present-day structural racism (sustained disadvantage) are more likely to have non-fatal shooting rates above the citywide median (red-dashed line). If there was equitable public safety, all intersectional groups would have the same proportion of tracts above and below the citywide median non-fatal shooting rate. Moreover, with equitable public safety, the citywide median non-fatal shooting rate would be substantially lower. In figure 4, we demonstrate the high burden of non-fatal shootings in sustained disadvantage tracts (highlighted in red). These tracts tend to have higher non-fatal shooting rates (darker grey colour) in comparison to other tracts.
Approaches to violence prevention that prioritise health equity are growing in popularity. We need tools, measures and frameworks to adequately describe and address the relationship between structural racism and firearm violence inequities.37–39 An intersectional approach to violence prevention will benefit researchers, advocates, policy-makers and practitioners by fostering social change. Researchers can partner with stakeholders to generate simple descriptive statistics from intersectional measures. Usage of these statistics can be a powerful way to highlight and explain how multiple social and structural factors intersect to influence violence inequities. Advocates can use these measures to reorient the focus of violence prevention efforts from traditional policing and criminal justice strategies to public health place-based policies and interventions. This includes approaches that simultaneously address violent crime and structural drivers, including systemic racism.40 41 Policy-makers and injury prevention practitioners can use an intersectional framing to develop, implement and evaluate violence prevention policies and interventions with a lens to health equity and racial justice.42 This could include providing greater social and economic investments in neighbourhoods that have experienced historical and contemporary structural racism; including greening vacant lots, conducting structural housing repairs, supporting credible messengers in violence prevention efforts and building communities of care.40 41 43–45
Data availability statement
Data are available upon reasonable request. Some data may not be released due to policy and/or statute.
Ethics statements
Patient consent for publication
Acknowledgments
We would like to thank several people for providing advice and feedback on this research project. This includes Dr. Cass Crifasi and Dr. Daniel Webster (Center for Gun Violence Solutions at Johns Hopkins Bloomberg School of Public Health); Dr. Graham Mooney (Johns Hopkins School of Medicine); Dr. Shani Buggs (University of California, Davis); Dr. Danielle German and Dr. Craig Pollack (Johns Hopkins Bloomberg School of Public Health); Dr. Dustin Duncan (Columbia Mailman School of Public Health); Khadijah Ameen (Georgia State University); Dr. Antoine Rogers (Brunel University); and Dr. Keshia Pollack-Porter, Dr. Shannon Frattaroli, Jessica Harrington, Dr. Attia Goheer, Amanda Williams, and Laurie Unruh (Health Policy Research Scholars Program). Finally, we would like to thank SAVIR (Society for Advancement of Violence and Injury Research) for honoring our team’s work on this paper with the 2022 Brooks Webb student paper competition award.
References
Supplementary materials
Supplementary Data
This web only file has been produced by the BMJ Publishing Group from an electronic file supplied by the author(s) and has not been edited for content.
Footnotes
Twitter @MudiaUzzi
Correction notice A second affiliation has been added to the author Lorraine T Dean
Contributors MU conceptualised and developed the design of the research project. MU, KTA and FKJ supported with data analysis. MU, CAL, LTD, JWJ and LM supported with data interpretation. MU led drafting the manuscript. All authors contributed to the manuscript, provided critical revisions to the manuscript, and read and approved the final manuscript. MU is the author responsible for the overall content as guarantor.
Funding MU and LM are supported by the Interdisciplinary Research Training in Trauma and Violence programme at Johns Hopkins University (Eunice Kennedy Shriver National Institute of Child Health and Human Development: T32 HD094687). Additional support was provided by the Health Policy Research Scholars programme at the Robert Wood Johnson Foundation, the 21st Century Cities Initiative at Johns Hopkins University and the Susan P. Baker Scholarship in Injury Prevention and Control at the Johns Hopkins Bloomberg School of Public Health.
Map disclaimer The inclusion of any map (including the depiction of any boundaries therein), or of any geographic or locational reference, does not imply the expression of any opinion whatsoever on the part of BMJ concerning the legal status of any country, territory, jurisdiction or area or of its authorities. Any such expression remains solely that of the relevant source and is not endorsed by BMJ. Maps are provided without any warranty of any kind, either express or implied.
Competing interests None declared.
Patient and public involvement Not Applicable
Provenance and peer review Not commissioned; externally peer reviewed.
Supplemental material This content has been supplied by the author(s). It has not been vetted by BMJ Publishing Group Limited (BMJ) and may not have been peer-reviewed. Any opinions or recommendations discussed are solely those of the author(s) and are not endorsed by BMJ. BMJ disclaims all liability and responsibility arising from any reliance placed on the content. Where the content includes any translated material, BMJ does not warrant the accuracy and reliability of the translations (including but not limited to local regulations, clinical guidelines, terminology, drug names and drug dosages), and is not responsible for any error and/or omissions arising from translation and adaptation or otherwise.