Article Text

Abstract
Background School safety zones were created in 2017 under the City of Toronto’s Vision Zero Road Safety Plan. This pilot study examined the effect of built environment interventions on driver speeds, active school transportation (AST) and dangerous driving.
Methods Interventions were implemented at 34 schools and 45 matched controls (2017–2019). Drivers travelling over the speed limit of >30 km/hour and 85th percentile speeds were measured using pneumatic speed tubes at school frontages. Observers examined AST and dangerous driving at school arrival times. Repeated measures beta and multiple regression analyses were used to study the intervention effects.
Results Most schools had posted speed limits of 40 km/hour (58%) or ≥50 km/hour (23%). A decrease in drivers travelling over the speed limit was observed at intervention schools post-intervention (from 44% to 40%; OR 0.79, 95% CI 0.66 to 0.96). Seventy-one per cent of drivers travelled >30 km/hour and the 85th percentile speed was 47 km/hour at intervention schools, with no change in either postintervention. There were no changes in speed metrics in the controls. AST increased by 5% (OR 1.22, 95% CI 0.97 to 1.54) at intervention schools. Reductions in dangerous driving were observed at all schools.
Conclusions Posted speed limits were >30 km/hour at most schools and high proportions of drivers were travelling above the speed limits. There were reductions in drivers exceeding the speed limit and in dangerous driving, and modest increased AST post intervention. Bolder interventions to slow traffic are required to effectively reduce speeding around schools, which may increase safe AST.
- environmental modification
- pedestrian
- child
- speed
- interventions
- driver
Data availability statement
Data are available in a public, open access repository.
This is an open access article distributed in accordance with the Creative Commons Attribution Non Commercial (CC BY-NC 4.0) license, which permits others to distribute, remix, adapt, build upon this work non-commercially, and license their derivative works on different terms, provided the original work is properly cited, appropriate credit is given, any changes made indicated, and the use is non-commercial. See: http://creativecommons.org/licenses/by-nc/4.0/.
Statistics from Altmetric.com
Introduction
The Vision Zero Road Safety Initiative—to eliminate all severe and fatal road traffic injuries—originated in Sweden in the 1990s.1 Vision Zero focuses on the design of safe roadways and transportation systems, while moving the responsibility for road safety away from the individual to the built environment. The Vision Zero approach emphasises a multidisciplinary, intersectoral collaborative approach informed by data, and has been implemented in many cities throughout North America, Europe, Australia and New Zealand.
Evidence of the effectiveness of Vision Zero—primarily from descriptive government reports—is inconsistent. For example, New York City reported a 33% decrease in traffic deaths from 2013 to 2019, and Edmonton, Canada, reported a 56% reduction in road user fatalities and a 30% reduction in serious injuries following Vision Zero interventions.2 3 Conversely, other North American cities such as Toronto, Chicago and Washington, DC have seen traffic fatalities rise or remain unchanged following Vision Zero implementation.4 5 Major barriers to Vision Zero implementation include political resistance to road traffic policy changes, for example, rhetoric about a ‘war on cars’ in the context of road safety, and the absence of the political will necessary to allocate sufficient resources to capital projects.4 There is also heterogeneity in what is considered a Vision Zero approach and cities are at various stages of implementing Vision Zero initiatives, which may influence the findings.
The City of Toronto adopted its inaugural Vision Zero Road Safety Plan in July 2016 with little effect on killed or severe injuries (KSI) among cyclists and pedestrians in the first 3 years of the programme (185 KSI in 2017, and 184 in 2019). More specifically, there were no real changes in KSI in children (19 in 2017; 22 in 2019) .6 7 These city-wide data may obscure local effects and the plan has been only relatively recently implemented. Important areas of continued focus are schools and pedestrians, including the creation of ‘school safety zones’ based on a package of built environment interventions around schools. Interventions near schools are important as the density of child pedestrian motor vehicle collisions, particularly fatal collisions, was found to be highest in school zones and decreased as distance from schools increased in Toronto, Canada.8 There have been 305 school safety zones completed to date.9
There are few studies on the effects of built environment interventions around schools in Canada. This pilot evaluation study represents an important and unique multidisciplinary collaboration between municipal decision-makers and educators, school travel planners, public health epidemiologists, geographers and injury prevention specialists to examine the effects of the first phase of Vision Zero interventions around schools in Toronto, Canada, from 2017 to 2019. Study objectives include examining the influence of a package of built environment interventions implemented as part of Toronto’s Vision Zero school safety zone strategy on (1) driver speeds, (2) active school transportation (AST), and (3) dangerous driving. As collisions are relatively rare events, we examined the effect of the package of interventions on driver speed, given that driver speed is the most important predictor of pedestrian collision risk and severity.10–12 Changes to AST (walking, cycling and other non-motorised transportation) were also measured as AST has health benefits related to physical activity, enhances community and social engagement and benefits the environment. Last, dangerous driving behaviours were measured as they have been associated with higher area-level collision rates surrounding schools and could potentially be associated with less AST.13 The overall goal of the Vision Zero interventions was to enable safe active transportation by reducing speeds.
Methods
Study design
A pre-post quasi experimental controlled design was used to evaluate the impact of Vision Zero school safety zone interventions. The City of Toronto Transportation Services, as a representative of the public, was involved in all aspects of the project, including developing the research questions, the design and school sample selection, and how the outcomes were going to be measured. Transportation Services was responsible for the determination of which interventions were to be installed and their installation.
Interventions
The package of interventions included speed feedback signs, flashing beacons, ‘school’ and speed limit markings and other pavement markings (eg, zebra bars, crosswalk lines) portrayed in figure 1. The frequency of installation varied based on identified need as determined by the City of Toronto. Criteria for assessing need primarily focused on the number of roads and the intersections near schools.9 A total of 357 interventions were installed (table 1). All schools received the five types of interventions, with the exception of three schools that did not receive a Watch Your Speed Board as part of their package of interventions. Flashing beacons and ‘school’ symbols were the most frequently installed interventions.
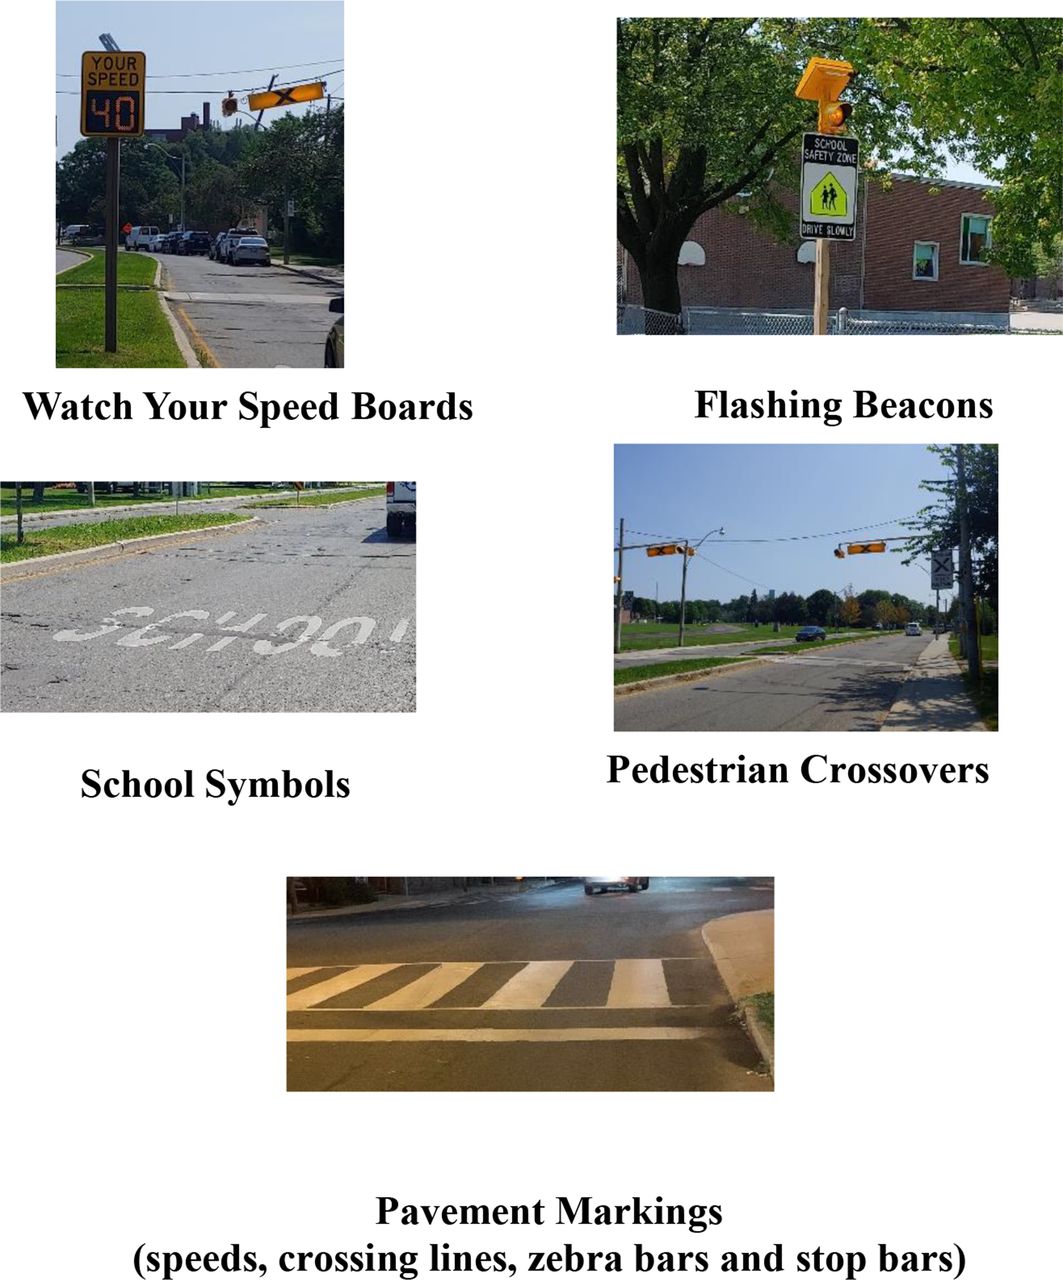
School interventions, City of Toronto (photos by LR, 7 August 2021).
Intervention treatments implemented at intervention schools (n=34)
Sample selection
Intervention schools
Initially, 45 public elementary and secondary schools had Vision Zero school safety zone interventions between 2017 and 2019. However, 11 of the schools had insufficient pre-intervention data. Therefore, 34 intervention schools were included. The priority schools for this study were selected by the City of Toronto based on the historical number of pedestrian motor vehicle collisions involving school-age children within a 1.6 km radius of the school and the proportion of students attending the school living within a 1.6 km walking distance to school. School safety zone interventions were implemented at 13 schools in the 2017–2018 school year and 21 schools in the following 2018–2019 school year.
Control schools
Forty-five control schools were matched to the intervention schools, which did not did not receive school safety zone interventions during the study period. The schools were not matched pairwise and comparisons were based on groups, not pairs. Therefore, we decided to retain all the control schools to maximise the power of the comparisons. Both the intervention and control groups were selected to ensure a balance on school level (ie, elementary (Junior Kindergarten–8), middle (5–8) and high school (9–12)) and socioeconomic status (based on the 2016 Canadian census after-tax low-income cut-off).14 15 Matching was done on school level as active transportation patterns may differ between younger and older students.16 Schools were also matched on socioeconomic status as low-income areas in Toronto have greater densities of higher speed roadways and higher collision rates.17 The prevalence of families below the 2016 census after-tax low-income cut-off living around the school was used as an indicator of low-income status.15
Data collection
Driver speed
Driver speeds were measured at all schools (34 intervention and 45 control) over 2 years. Thirteen schools had interventions implemented during the 2017–2018 school year, and pre-intervention speeds were measured in the Fall 2017 and post intervention in the Fall 2018. The remaining 21 intervention schools received interventions in 2018–2019 and driver speeds were measured pre-intervention in the Spring 2018, and post intervention in the Spring 2019. The 45 control schools had pre-intervention and post intervention driver speeds measured in Spring 2018 and Spring 2019, respectively. Driver speeds were measured during school activity times between 07:00 and 18:00 at the main frontage of the school using pneumatic speed tubes. The driver speed outcomes examined were: (1) proportion of drivers exceeding the speed limit, (2) the proportion of drivers exceeding 30 km/hour, and (3) the 85th percentile speed. Speeding over 30 km/hour was used as an indicator of pedestrian safety because there is a greater chance of pedestrian survival if struck by a driver travelling at 30 km/hour or under.11 The 85th percentile speed was used as an indicator as it is often used by traffic engineers to set speed limits.
AST and dangerous driving
AST and driver behaviour observations were only feasible for the 2018/2019 intervention schools (n=21) and control schools (n=45). Pre-intervention measurements were conducted in Spring 2018 and post intervention measurements were conducted in Spring 2019. Trained university students conducted the observations during morning drop-off time.
Two observers (three observers at larger schools with >700 students) counted the children arriving to school by car, walking, biking or other active means (scooter/rollerblading) using the methods used by our group in previous studies.18 Observations were conducted from 20 min before to 5 min after the morning school bell. Arrivals by school bus were not counted. In a previous study, repeating this protocol for observations at 10% of sampled schools led to Pearson’s r=0.96.18
The driver checklist had moderate to high inter-rater agreement (≥60%).19 Dangerous driving was categorised as a dichotomous variable (ie, observed at least once at the school or not). Data were collected on: cars blocking pedestrians, cars blocking other cars and traffic controls, U-turns, dropping off children on the opposite side of the road from the school with no crosswalk, backing up dangerously, double parking, not following traffic controls, and seen talking and/or texting on the phone in a moving or stationary vehicle.
Covariates
Speed outcome models were adjusted for posted speed limits and the presence of traffic calming in front of the school. Posted speed limit was a four-level categorical variable representing 30, 40, 50 and 60 km/hour. Traffic calming was measured using a binary variable (present/absent) to indicate presence on the roadway segment directly in front of the school. Traffic calming was defined as at least one of speed humps, bollards, curb extensions, traffic circles, chicanes or raised crosswalks; however, in Toronto, the majority of traffic calming is speed humps (85%). The model for the AST outcome was adjusted for crossing guard presence near the school using a binary variable (present/absent) as school crossing guards are associated with AST.18
Analysis
Descriptive analyses of the proportions of drivers exceeding the speed limit and exceeding 30 km/hour, as well as the 85th percentile speeds, were conducted. Repeated measures beta regression modelling was used to examine the intervention effects on proportion over 30 km/hour and over the speed limit, and multiple regression was used for the mean 85th percentile. A pre-post intervention variable was included in models as the main exposure. Multivariable models were adjusted for posted speed limits and presence of traffic calming. ORs with 95% CIs are presented.
A pre-post analysis was conducted to examine AST and dangerous driving for the 21 intervention schools (2018/2019) and 45 control schools. A repeated measures beta regression analysis (adjusted for presence of crossing guards) was used to estimate post intervention changes in the proportion of AST. Post intervention changes in dangerous driving were examined descriptively. All analyses were conducted in SAS University Edition 14.2.20
Results
Overall, few schools had posted speed limits of 30 km/hour (n=14), with most at 40 km/hour (n=46) and a substantial number (n=18) having 50 km/hour or higher posted speed limits (table 2). Less than half of schools had traffic calming and school crossing guards.
School characteristics
Driver speed
Four outlier intervention schools were removed from the analysis due to invalid speed measurements because of construction impacting traffic (three schools) and a measurement location error at a fourth school (ie, pre and post measurements were not conducted at the same location).
A high proportion of drivers exceeded the speed limit around intervention and control schools (figure 2). After intervention, there was a decrease in the average proportion of cars travelling over the speed limit (44% to 40%), with little change at control schools. At intervention schools, the proportion of drivers travelling over 30 km/hour pre-intervention was 71% and the 85th percentile speed was 47 km/hour, with no change in either measure post intervention and no changes at control schools. All reductions in the proportion of traffic exceeding the speed limit occurred at the schools with posted speed limits of 40 km/hour (online supplemental table 1).
Supplemental material

Vehicle speed metrics at intervention and control schools pre-intervention and post intervention.
Multivariable modelling was conducted for all speed outcomes. The proportion of drivers exceeding the speed limit was the only metric showing a pre-post intervention effect. At intervention schools, there was a significant decrease from 44% to 41% representing a 21% decrease in the odds of drivers exceeding the speed limit (OR 0.79, 95% CI 0.66 to 0.96). Adjusting for traffic calming and the posted speed limit had no effect on the estimates (online supplemental table 2).
AST and dangerous driving
The proportion of students using AST increased from 59% to 64% post intervention. The unadjusted odds of using AST increased by 22% post intervention (OR 1.22, 95% CI 0.97 to 1.54) in the intervention group. Adjusting the models for school crossing guard presence had a little effect on the estimates (online supplemental table 3). There was no change in AST in the control group (65% pre-intervention and post intervention).
At least one dangerous driving behaviour was observed at 64 (97%) schools (intervention and control) pre-intervention, with 43 (65%) schools exhibiting >3 behaviours. In the intervention schools, there were decreases in the number of schools observed with six of the nine driver behaviours (figure 3). The largest decrease was seen in drivers backing up dangerously (90% to 62%). In the control schools, there were decreases in six of the nine dangerous driver behaviours (online supplemental figure 1).

Pre-intervention and post intervention of observed risky driving at intervention schools (n=21).
Discussion
This study examined the effects of Vision Zero interventions on speeding, AST and dangerous driving in front of pilot schools included in the School Zone Safety Project as part of the Vision Zero Road Safety Plan in Toronto. The interventions implemented in this pilot study were limited as they were restricted to school zone and speed indicators (lines and signs), with no physical traffic calming measures and no additional enforcement. As a result, only modest reductions in speeds and increased AST were observed. This emphasises the need for bolder interventions which may include physical changes to the road environment as well as greater enforcement to achieve meaningful speed reduction around schools.
A notable finding was that a high proportion of drivers were speeding in front of schools. At all schools, pre-intervention, close to half of all drivers were exceeding the speed limit, and approximately 75% exceeded 30 km/hour. The 85th percentile speeds were high, with some observed to be 45 km/hour or higher. Following interventions, there was a modest reduction in drivers over the speed limit (44% to 40%). There were also trends towards increasing AST and a reduction in dangerous driving.
The issue of speeding around schools in North America has long been recognised.21–23 Small, site-specific engineering studies have evaluated the effectiveness of single interventions such as lights, signs and markings in front of schools on speed with inconsistent results.21 24 25 Small samples likely contribute to the inconsistent results. Results may also vary depending on city, highlighting the importance of examining the local effects of interventions, as well as including comparisons with matched control locations.
Packages of built environment interventions may be most effective in creating safe environment around schools versus single interventions. Dimaggio and Li evaluated ‘Safe Routes to Schools’ interventions from 2001 to 2010, which included traffic calming, exclusive pedestrian crossing times, speed boards, high-visibility crosswalks and new parking regulations. The study found a 44% decrease in collisions in census tracts with the interventions compared with no change in rates in control census tracts without interventions. Collision rates were almost 50% less during school travel hours in the intervention schools.26
An important finding of our study was that most schools (64/78, 82%) had frontages on roads with posted speed limits exceeding 30 km/hour. Reducing speed limits to 30 km/hour has been associated with a 28% reduction in collision rates compared with a reduction of 7% on control roads in Toronto, and a reduction in collision frequency and severity in Switzerland (15% and 27%, respectively).25 27 Despite the effectiveness of reducing posted speed limits on collision reduction, results from different studies consistently indicate continued poor driver compliance with lower speed limits.23 28 Lowering posted speed limits around schools is a necessary but not sufficient intervention—other evidence-based built environment interventions designed to physically slow traffic or to separate pedestrians and drivers are needed as part of a comprehensive package of interventions.
The trend towards increased AST in this study after the implementation of the school zone built environment interventions was small but notable. It may take a longer period of observation before larger changes will occur in regard to shifting towards active travel modes. Parental concerns regarding traffic safety have been consistently related to AST.29 30 Parent surveys after Safe Routes to School infrastructure improvements at schools in California indicated that the majority thought the projects would increase safety and that the improvements were important.31 Specific infrastructure improvement projects (eg, traffic signals) were associated with both observed and reported increases in pedestrian counts. In Toronto, Canada, parent perception of traffic route safety was associated with AST and higher driver speeds and speed limits have been found to be associated with decreased AST.32 33
Dangerous driving was prevalent at all schools during morning school drop-off time. A decrease in dangerous driving post intervention was more marked in the intervention schools compared with control schools. Few studies have focused on the measurement of dangerous driving around schools despite evidence of their association with collisions and the potential impact on reducing AST.13 Designated car drop-off locations and crossing guards decrease some dangerous driving behaviours; however, there is a need for further implementation and evaluation of interventions.
A limitation of the study was that it was ecological in nature and did not consider individual or household factors. The sample size was also small; however, results were strengthened by the inclusion of control schools. Selection bias was an issue as intervention and control schools were inherently different due to the prioritisation scheme whereby intervention schools were chosen based on the number of historical collisions around the schools as well as the proportion of children living within walking distance. However, despite higher proportions of children living close to the intervention schools, control schools had higher AST than intervention schools at baseline. Likewise, despite more historical collisions around intervention schools, driver speeding for all metrics was higher in the control schools compared with intervention schools. In other words, area-based historical collisions within 1.6 km of a school did not appear to be correlated with higher speeds in front of such schools. Regardless, the analysis attempted to take into account potential confounding factors. Bias due to regression to mean effects is also possible when interventions are ‘targeted’ by traffic authorities however this would apply more had we been doing a study with injuries as outcomes rather than the surrogates reported.
Another limitation was the inability to use collisions as the primary outcome measure, given the short time frame and small sample size. In addition, the time since installation of every intervention was not available, and it may be that the interventions were not in place long enough to lead to changes in outcomes. Routinely collected driver speed and volume data near schools have begun in Toronto with the introduction of automated speed enforcement (ASE) and driver feedback signs.34 35 These data collection tools will support larger and lengthier studies examining the effectiveness of road safety interventions near schools.
The Vision Zero interventions implemented in this pilot study were limited, given that they did not physically slow the traffic down, but were restricted to school zone and speed indicators (lines and signs), with no additional enforcement. Bolder interventions are now being implemented as part of the Toronto Vision Zero programme, including lowering speed limits, ASE and more physical interventions related to traffic calming such as speed humps, curb radii reductions and flexible in-road traffic signs.36 Lowering the speed limits from 40 to 30 km/hour has been associated with a 29% decrease in child pedestrian motor vehicle collisions in Toronto.27 ASE has been found to substantially reduce speeding, speed violations, collisions, injuries and deaths around schools.37 38 Physical infrastructure changes related to traffic calming are important around schools, as this study found more than half of schools did not have any traffic calming measures at their frontages. The implementation of speed humps has been associated with a 43% reduction in child pedestrian motor vehicle collision rates.39
Conclusions
This pilot study showed the modest effects of a package of built environment interventions on speed reduction, AST and dangerous driving. The reduction of traffic speed, which influences both collisions and injury, is essential to achieving Vision Zero. Our results emphasise the need for bolder interventions to reduce speeds around schools. Single interventions may not be as effective as a package of interventions such as a combination of posted speed limit reduction at all roadways around schools to 30 km/hour, together with automatic speed enforcement and physical interventions related to traffic calming. Reducing driver speeds around schools translates to safer environments for children to walk to school and will ultimately result in fewer collisions plus the added benefits of more AST.
What is already known on the subject
Driver speed is the most important predictor of pedestrian collision and injury.
Many drivers speed in front of schools.
Reducing posted speed limits together with other built environment interventions may be effective in reducing speed.
What this study adds
Many school frontages have high posted speed limits in Toronto (eg, ≥50 km/hour) and many drivers exceed these high-speed limits.
Built environment interventions showed modest effects on reducing speeding and dangerous driving, while increasing active school transportation.
Bolder interventions are required to reduce driver speed in school zones in Toronto. Reduced speed limits, automated speed enforcement and traffic calming are potentially effective interventions.
Data availability statement
Data are available in a public, open access repository.
Ethics statements
Patient consent for publication
Ethics approval
Ethics approval was obtained from the Hospital for Sick Children Research Ethics Board (1000059579), the Toronto District School Board External Research Review Committee (ERRC 2015-2016-63E) and the Toronto Catholic District School Board Research Review Committee.
Acknowledgments
We would like to thank Sheldon Koo and Roger Browne from the City of Toronto Transportation Services, Kristen Evers from the Toronto District School Board and Laura Zeglen from Green Communities Canada for their assistance related to data collection and conceptual framework of this project.
References
Supplementary materials
Supplementary Data
This web only file has been produced by the BMJ Publishing Group from an electronic file supplied by the author(s) and has not been edited for content.
Footnotes
Contributors LR: conceptualisation; funding acquisition; investigation; methodology; project administration; resources; supervision; writing–original draft. RL: formal analysis; project administration; methodology; writing–review and editing. BEH, CM, AKM: conceptualisation; investigation; methodology; writing–review and editing. RB: conceptualisation; investigation; writing–review and editing. PF: conceptualisation; funding acquisition; writing–review and editing. AWH: conceptualisation; funding acquisition; investigation; methodology; project administration; resources; supervision; writing–review and editing.
Funding This study was funded by the City of Toronto Transportation Services.
Competing interests None declared.
Provenance and peer review Not commissioned; externally peer reviewed.
Supplemental material This content has been supplied by the author(s). It has not been vetted by BMJ Publishing Group Limited (BMJ) and may not have been peer-reviewed. Any opinions or recommendations discussed are solely those of the author(s) and are not endorsed by BMJ. BMJ disclaims all liability and responsibility arising from any reliance placed on the content. Where the content includes any translated material, BMJ does not warrant the accuracy and reliability of the translations (including but not limited to local regulations, clinical guidelines, terminology, drug names and drug dosages), and is not responsible for any error and/or omissions arising from translation and adaptation or otherwise.