Article Text

Abstract
Objective To predict the coast-wide risk of drowning along the surf beaches of Gironde, southwestern France.
Methods Data on rescues and drownings were collected from the Medical Emergency Center of Gironde (SAMU 33). Seasonality, holidays, weekends, weather and metocean conditions were considered potentially predictive. Logistic regression models were fitted with data from 2011 to 2013 and used to predict 2015–2017 events employing weather and ocean forecasts.
Results Air temperature, wave parameters, seasonality and holidays were associated with drownings. Prospective validation was performed on 617 days, covering 232 events (rescues and drownings) reported on 104 different days. The area under the curve (AUC) of the daily risk prediction model (combined with 3-day forecasts) was 0.82 (95% CI 0.79 to 0.86). The AUC of the 3-hour step model was 0.85 (95% CI 0.81 to 0.88).
Conclusions Drowning events along the Gironde surf coast can be anticipated up to 3 days in advance. Preventative messages and rescue preparations could be increased as the forecast risk increased, especially during the off-peak season, when the number of available rescuers is low.
- drowning
- risk factor research
- prehospital
Data availability statement
Compiled data are available in a public, open access repository. Detailed data may be obtained from a third party and are not publicly available. Therefore, daily model data are available on the OSF repository: https://osf.io/p9u8a/ and, due to data providers restrictions, 3-hour step model data are available upon request from the corresponding author (eric.tellier@chu-bordeaux.fr).
This is an open access article distributed in accordance with the Creative Commons Attribution Non Commercial (CC BY-NC 4.0) license, which permits others to distribute, remix, adapt, build upon this work non-commercially, and license their derivative works on different terms, provided the original work is properly cited, appropriate credit is given, any changes made indicated, and the use is non-commercial. See: http://creativecommons.org/licenses/by-nc/4.0/.
Statistics from Altmetric.com
Introduction
According to the 2017 Global Burden of Disease study, drowning is a major cause of non-intentional deaths from injury worldwide.1 In France, the national public health agency (Santé Publique France) performs a national study every 3 years, registering all cases of drowning leading to hospitalisation or death between 1 June and 15 September of the studied year. In 2015, this study reported 1266 drownings, with 637 (50.3%) occurring along the seashore.2 In a previous study on the surf beaches of Gironde, southwestern France, 576 people required rescue over 6 years; there were 24 fatalities due to drowning.3 In terms of the length of the coastline, the annual mean was 3.3 deaths/100 km, a rate comparable to the highest recorded along the US coastline.4
The Gironde coast is a 126-km-long stretch of sandy beaches (figure 1) exposed to high-energy waves that drive intense, narrow seaward-flowing jets of water termed ‘rip currents’. A previous study showed5 that these currents cause 79% of drownings. Rip currents are the leading causes of rescues and drownings off many surf coasts worldwide.4 6–9
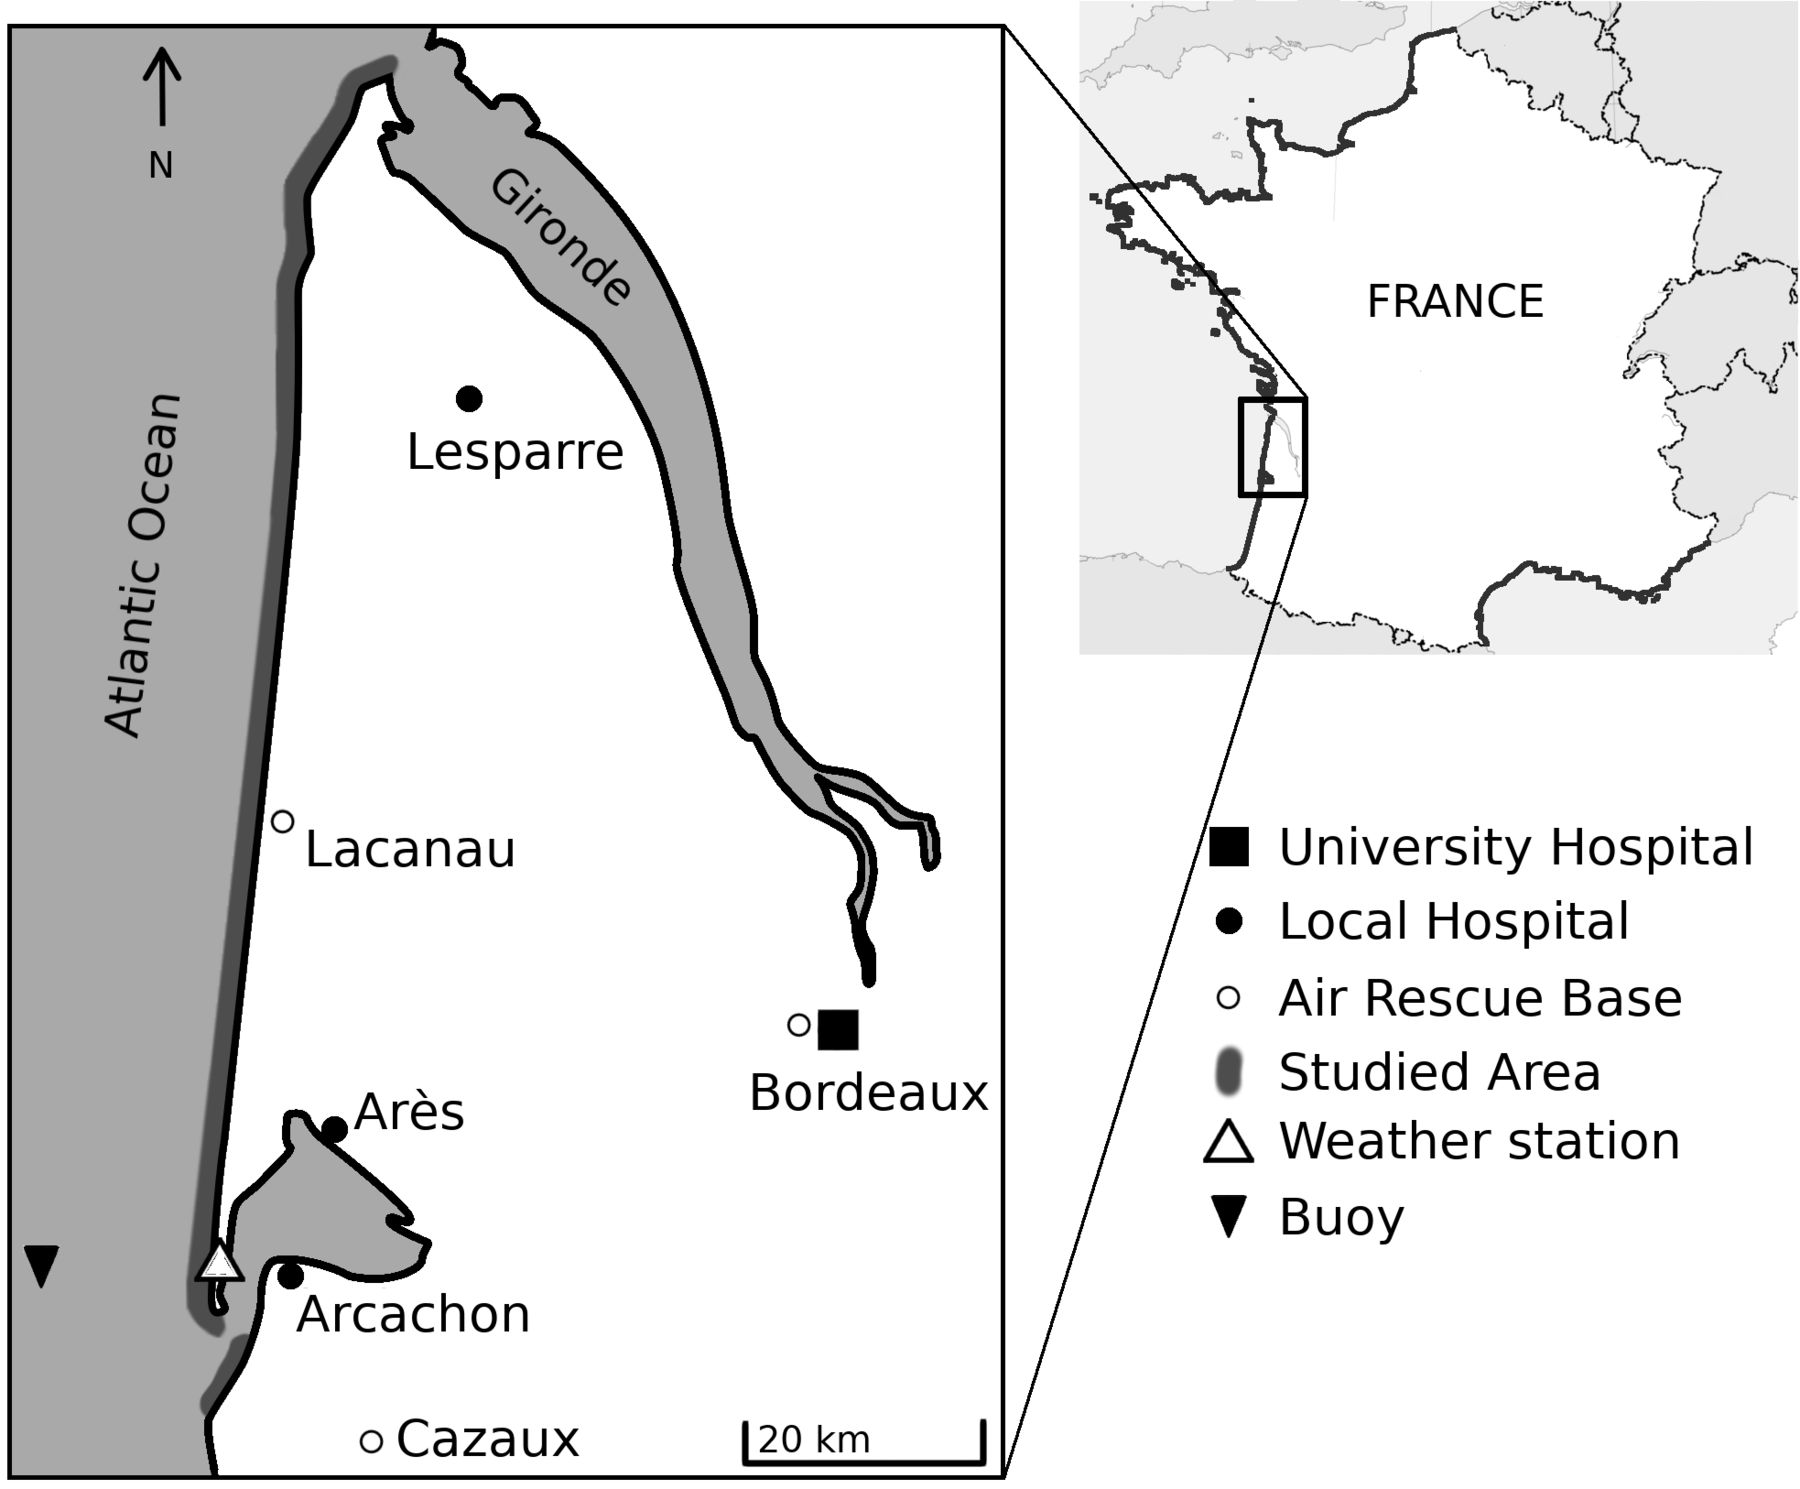
Map of Gironde, France, with studied area for life-risk prediction, location of air rescue bases used during high season, and hospitals. Observed data came from the Cap Ferret weather station and a buoy located offshore. Adapted from Tellier et al. 3
Drowning is sudden; prevention is key when the aim is to reduce the incidence of drowning.10–12 Primary prevention may modify beachgoer behaviour13; lifeguards can impart preventative messages,14 reducing the need for medical attention and cardiopulmonary resuscitation of drowning victims.15 16 When a drowning occurs, a fast response involving bystanders, lifeguards, paramedics and a medical team if necessary, is essential.17
Drowning prevention on the Gironde beaches features patrolled areas, signs at most beach entrances, and leaflets describing the rip current and shore-break hazards. However, the beaches are not patrolled during the entire bathing season, which extends from April to October. Most lifeguard stations are open only in July and August; the locations most frequented by tourists are patrolled from mid-June to mid-September. On weekends in May and June, some areas are watched, depending on local authorities. The mayor is responsible for beach supervision, which is regionally coordinated by the departmental prefect in collaboration with the prehospital care department of Bordeaux University Hospital. During high season, rescue helicopters are on standby (figure 1). On low-season weekends, one helicopter may be on duty, depending on the regional authority.
Models predicting the coast-wide life-risk of drowning would be useful if they enhanced the preventative measures taken to reduce risk. Predictive models of rip currents have been implemented in Florida,18 Puerto Rico,19 Mexico,20 India8 and Great Britain.21 These models were based on physics, modelling the occurrence and the speed of rip currents flow. They have been evaluated both retrospectively and in the field using hindcasts. To the best of our knowledge, they have not been prospectively evaluated using forecasts, and model predictions have not been compared with actual drownings.
The number of people exposed to a rip hazard is directly related to the number of swimmers and other water users, and therefore linked to beach attendance. Attendance rises on holidays, weekends, and with increased air temperature and less cloud cover; the number of bathers reflects air and water temperatures and (possibly) wind speed. As the risk of drowning is a combination of the hazard per se and exposure to it, and as the latter is poorly quantified, we created a model including parameters reflecting exposure to rip currents. We assessed whether drownings off Gironde beaches could be anticipated using a coast-wide risk prediction model based on forecast metocean conditions.
Materials and methods
Study setting
We performed an observational study along the French Atlantic coastline of Gironde (figure 1). The coast is meso-macrotidal, with spring tide range reaching 5 m. Summer-averaged significant wave height and peak period are approximately 1.3 m and 9 s, respectively.22 Deep rip channels incise the inner intertidal bar, with an average spacing of c. 400 m, through which intense rip currents can flow. In typical summer wave conditions, rip current activity is maximised for long period waves and shore-normal incidence between low-tide and mid-tide.23 Even for waves of approximately 1 m, mean rip current speed can reach 1 m/s.23
We first developed a model based on medical emergency calls from beaches, along with observed metocean conditions, in 2011, 2012 and 2013. We evaluated only the bathing season (April–October). We tested the model to assess whether it accurately predicted events that occurred from April to October in 2015, 2016 and 2017, using metocean forecasts. We used the RiGoR guidelines24 to address common sources of bias in risk-prediction models, and we adhered to the Strengthening the Reporting of Observational Studies in Epidemiology statement for observational studies.25
Data sources
Medical emergency calls
In Gironde, medical emergency calls either from a bystander or a lifeguard are received by a single medical emergency call centre (Service d’Aide Médicale d’Urgence). During each call, a physician records all information given by the caller, paramedics and (when applicable) prehospital care teams. All calls dealing with rescue from water or drowning were included in the data for this study; these were the events of interest. ‘Rescue’ refers to a need for evacuation from the water,11 and ‘drowning’ refers to respiratory impairment caused by submersion or immersion, as defined by the WHO.26 Both events were considered as adverse water events. We excluded calls lacking victims, training calls and duplicates. As every instance of a need for medical advice or a prehospital care team triggered a call, we considered that all events of importance would be identified. Information on every call was carefully read to avoid errors. Intentional drownings and drownings associated with known diseases (eg, seizure) were excluded.
Environmental conditions
Hourly tidal data were modelled by the ‘Service Hydrographique et Océanographique de la Marine’ (SHOM, authorisation no. 296/2014) using the Lacanau shore as the reference. Lacanau is located in the approximate centre of the study area; according to the SHOM, the maximum tide phase lag over the entire study area is approximately 15 min. Wave conditions were measured every 30 min by the Centre d’Archivage National de Données de Houle In-Situ buoy27 located at 044°39.150′N and 001°26.800′W (figure 1). The wave propagation time from the buoy to the coast is about 1 hour. Observed and forecast meteorological and wave conditions were provided by Météo-France, the French national meteorological service. We used data from the Cap Ferret weather station; Météo-France claims that these well-represent the weather along the entire Gironde coast. Retrospectively, forecasts were not available and observed data were used for 2011–2013. Forecast data, collected prospectively, were available for up to 3 days and at 3 hour steps (7:00 am UTC ±00:00, 10:00 am, etc.). Weather and sea forecasts were Météo-France expert data based on the AROME and WW3 models, respectively. We recorded sea height, the wave height, period and direction. We also recorded wind speed and direction, air and water temperatures, and cloud cover. Other factors influencing beach attendance were the season and type of day. High season was defined as the period from 15 June to 15 September, when most lifeguard stations are open. We distinguished between weekdays, weekends and holidays.
Statistical methods
We fitted two logistic regression models: a ‘daily model’ predicting the overall coast-wide risk of at least one adverse water event on a given day, and a ‘3-h-step model’ predicting the risks at different times of the day (9:30 am−12:29 pm, 12:30−3:29 pm, 3:30−6:29 pm and 6:30-9:30 pm; all local times). Given above mentioned differences in the environmental data collection modes between the training and validation periods, we checked data consistency both visually and using the Wilcoxon-Mann-Whitney and Student’s t-tests.
Days for which metocean data were lacking were removed from the analysis. Prospective cohort data (including variable selection) were not used during model development. We transformed the wave parameters : the wave factor (Wf ) is the product of significant wave height and peak wave period, and the wave incidence factor Df is defined by the equation (1), with θ the mean wave direction (in degrees):
 (1)
(1)
278° is the mean angle of the normal to the coastline of the studied area. Therefore, Df range is 0–1 and is maximal when the wave direction is perpendicular to the coast. This transformation emphasises on small variations around the shore normal and made Df log-linear. We categorised non-log-linear quantitative variables (temperatures, wave factor and sea height); these were first divided into quantiles and then reduced using the Akaike Information Criterion (AIC) in a multivariate context.28 Model selection used the AIC to perform interaction checks; we tested all possible models.29 ORs with 95% CIs were computed as bootstrap estimates. We checked that residual autocorrelation was absent. Goodness of fit was assessed using the Le Cessie-Van Houwelingen test.30 Calibration was assessed graphically employing a locally weighted, least-square regression smoother31 and the Spiegelhalter Z-test. Discriminatory power was assessed using receiver operator characteristic (ROC) curves based in data from each cohort. Fit and validation accuracies were assessed via Brier scoring. We measured the importance of the selected predictors by their partial Wald χ2 statistics minus the predictors’ degree of freedom and their proportions.31 The outcomes derived using 1, 2 and 3-day forecasts were compared by drawing ROC curves using the Delong and Venkatraman method for paired data32–34; we applied Holm-Bonferroni corrections. We created a five-level risk scale using the quintiles of the fitted probabilities. All analyses employed R software35 running the RMS31 and pROC packages.33
Results
Retrospective data were lacking for 77 days because of a buoy failure, and for 26 prospective days (21 because of data-link loss and 5 because of server unavailability). We analysed 563 days during 2011–2013; 242 adverse water events (136 rescues and 106 drownings) were reported on 108 different days. In 2015–2017, data were available for 612 days; there were 232 adverse water events (155 rescues and 77 drownings) on 104 different days (table 1). Demographics were similar between the two periods, with a sex ratio of 0.61 F/M, and a median age of 23 (quartiles (18–42)). All retrospective and prospective cohort data were consistent, except for wind speed, which differed significantly between prospective and retrospective data, and cloud cover, which was measured by different means over the retrospective and prospective periods. Both were excluded from prospective analyses.
Description of days without and with adverse water events
The final, predictive, daily coast-wide life-risk model included wave and wave incidence factors, air temperature, type of day and season (table 2). Water temperature and tidal range were not retained in the model. The model predicting risk at 3-hour steps featured sea height, wave parameters, air temperature, time of day, type of day and season (see online supplemental appendix table A1). Variation in the daily model was attributable principally to air temperature (proportion of the overall χ2 value, 40.9%), wave factors (21.7%), and time of day (16.2%) (figure 2). The principal 3-hour-step model predictors were air temperature (28.9%), the time of day (17.8%), and wave factors (12.6%) (online supplemental appendix figure A1). The probability of a daily drowning occurrence according to the final model is given by the equation (2), with Df the wave incidence factor, Wf the wave factor and Tair the air temperature.
Supplemental material
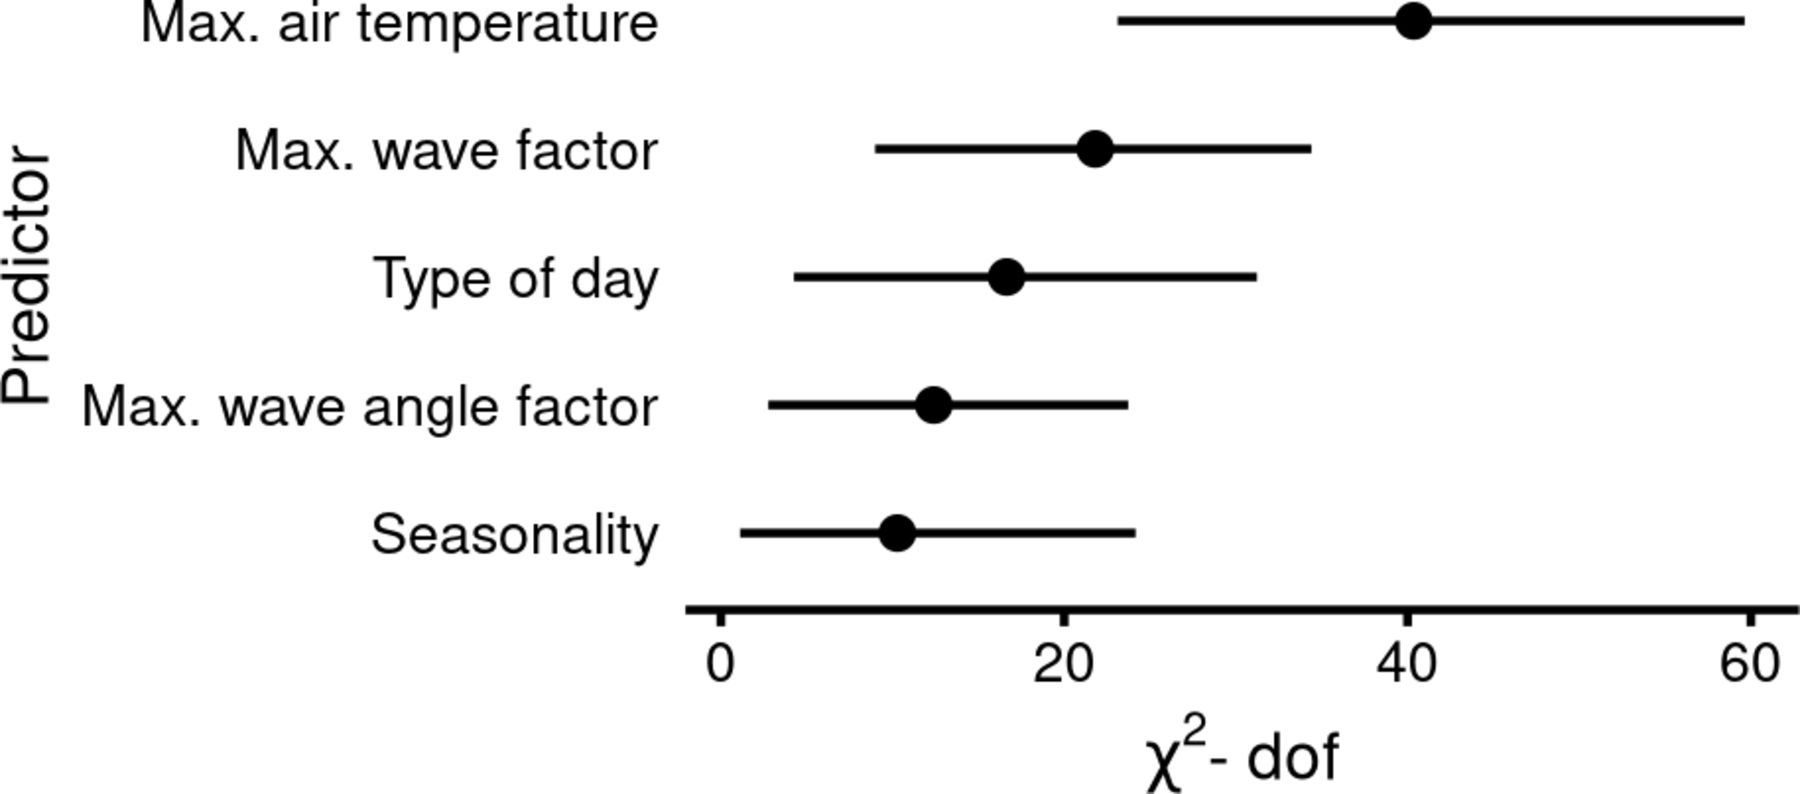
Importance of predictors in daily coast-wide life-risk along Gironde surf beaches. Importance of predictors is assessed using Wald statistics minus two df, with their 95% CI given by bootstrap estimations, multivariate logistic regression model.
Factors associated with daily adverse water events along the Gironde coast

The daily model had areas under the curves (AUCs) of 0.88 (95% CI 0.84 to 0.91) for 2011–2013 and 0.82 (95% CI 0.78 to 0.86) for 2015–2017 (figure 3). The 3-hour risk model had AUCs of 0.89 (95% CI 0.87 to 0.92) for 2011–2013 and 0.85 (95% CI 0.81 to 0.88) for 2015–2017 (figure 3). Model outcomes did not differ when forecasts for 1, 2 and 3 days were used (p>0.05). Both models were well calibrated in terms of retrospective data (goodness-of-fit test p=0.20 for the daily model, p=0.53 for the 3-hour-step model). Both models exhibited significant p values on Spiegelhalter Z-testing of prospective data, evidencing a lack of calibration: the daily model tended to overpredict days with risks of drowning >0.5; the 3-hour step model overpredicted risks as low as 0.1.

Receiver operator characteristic curves of prediction models of water adverse event along Gironde coast. (A) Prediction model using daily data: area under the curve (AUC) of 0.88 (95% CI 0.84 to 0.91) for 2011–2013 data and 0.82 (95% CI 0.78 to 0.86) for 2015–2017 data. (B) Model predicting coast-wide life-risk over 3-hour periods: AUC of 0.89 (95% CI 0.87 to 0.92) and 0.85 (95% CI 0.81 to 0.88).
Using prospective data with 3-day forecasts, we found that assessment of the coast-wide risk of water adverse event using the five-level scale missed 1 of 158 days featuring a rescue at the lowest risk level (0.6%). The missed case was a rescued man who presented without a cough and was discharged on site. The prospective data predicted 45.8% of days with rescue events at the highest risk level (table 3). Few differences between forecasts according to their delay and the risk level were observed (see online supplemental material table A2). The 3-hour step model missed 2 of 481 rescues, one at the lowest level (0.4%) and one at the highest (15.7%).
Observed rescues versus predicted coast-wide risk of adverse water event
Observed rescues and drownings by predicted risk level derived using regression models exploiting 3-day forecasts; Gironde, southwestern France.
The missed case at the lowest risk level in the retrospective cohort occurred during moderate wave conditions (wave factor ~8 m×s) and at low wave incidence factor (0.47), but the victim required only rescue, was asymptomatic on rescue, and was not evacuated. The second missed event occurred at the tip of the Cap Ferret sandspit, which lacks wave-driven rip currents. The last missed event occurred at La Salie Nord, adjacent to (south of) the Arcachon inlet, under moderate wave conditions.
The 3-hour step model missed two events in the prospective cohort, both in September 2017, and both occurring under strong wave conditions (wave factor>15 m×s). One was a surfer; the activity pursued by the other victim was not recorded. Both cases were minor and were treated in the local hospital.
Discussion
While previous studies examined the association of ocean drowning risk with weather conditions,36–39 our study is the first to focus on the prediction of life-risk. Air temperature, wave direction and the wave factor were the primary environmental predictors; the type of day and the season were also significant, but less important, predictors. Given the availability of extensive metocean data used to infer rip current activity, we were able to build a tool that accurately predicted coast-wide life risk.
Warm weather increases sea exposure and therefore the risk of drowning, consistent with other studies.40 41 This finding, associated with the importance of the time of day, highlights the social dimension of the drowning risk. Actually, air temperature and time of the day may be the primary controls for the number of beach users and their behaviours.
Wave parameters influencing rip current flow velocity were significant predictors of drowning, consistent with the results of physical models.21 For instance, coast-wide life-risk was increased for more shore-normally incident waves.42 Here, the life-risk was found to systematically increase with the wave factor Wf, which is in line with Castelle et al, but contrast with Scott et al 43 in UK where hazard was maximised for just below average Wf. In a previous study,44 it was qualitatively shown that the beach morphology, which has a profound impact on rip current hazard, was important to the number of drowning incidents. Given the low number of studied seasons and events, and the likely contrasting beachgoer profiles between seasons, it was not possible to robustly address the influence of the bathymetry. A beach bathymetry proxy could be added to the model via the integration of beach state estimation model based on the equilibrium concept.45
As the wind parameters differed between the retrospective and prospective periods, we could not use these parameters, although they might have further improved the models. Cloud cover was measured differently during the two periods and thus could not be incorporated into the models. Although univariate analysis showed that cloud cover was a significant predictor of drowning, it is strongly correlated with air temperature. Future models should integrate predicted rather than observed measures. Parameters such as cloud cover could be therefore studied.
Our models tend to overestimate the risk on days associated with moderate to high risks; some variables may thus be unknown, related to the beach morphology and the beach attendance. First, the summer beach morphology along the Gironde coast is very variable with rip channel exhibiting different morphologies from one summer to another,44 and even in space with more gently sloping and less channelized beaches northwards. Given that, for instance, the relative depth of the rip channels is critical to rip current flow speed,46 and thus physical hazard, and that beach type also influence attendance47 consideration of a constant beach morphology is limiting. Although the current version of our model does not account for beach attendance data, it can guide lifeguard/rescue decision makers who need to allocate resources. Moreover, drownings are certainly under-reported to the emergency call centre; reporting rates may vary over time. We could not directly estimate exposure, as beach attendance is not measured in Gironde. This findings might also be due to the consistency between the perception of the hazard by beach users and the computed risk.48 The timestamps for the calls are provided automatically by the emergency call centre database. It may be delayed by a few minutes from the event.
Turning to the missed events, two occurred in sectors adjacent to the Arcachon lagoon inlet, where local, strong tide-driven currents develop at low tide, constituting a major hazard. We hypothesise that the missed events were attributable to these currents. This highlights the need to carefully target preventative messages; the primary hazards vary locally.
Use of the 1, 2 and 3-day forecasts yielded similar results; this will aid in the efficient deployment of lifeguards and rescue equipment. Accurate local forecasts more than 3 days ahead are not available.
How may our findings save lives? This work can be used in two ways: the first as a trigger for targeted preventative messages, and the second as a decision aid for rescue services.
The use of a binary scale would trigger many false alarms; thus, we considered that a five-level scale was more appropriate, as such scales are used to predict other risks posed by natural hazards (such as snow avalanches). Our scale should be improved using a risk utility function, which remains to be specifically determined. We concede that our present levels are arbitrary; we must still explore what beachgoers and decision-makers consider to be ‘low’, ‘moderate’ or ‘acceptable’ risks. The study of social factors influencing beach attendance and water use might still be important to study to formulate preventative messages. This will be the object of a future study.
Any message suggested by our models must be consistent with ‘messages’ imparted by beach flags. These flags can be ‘green’ (no or minor hazard, bathing supervised), ‘yellow’ (hazard, bathing supervised) or ‘red’ (major hazard, no bathing allowed). They are determined by lifeguards based on wave conditions, water temperature, and beach attendance, and may vary depending (for example) on lifeguard experience. Unpublished local reports indicate that green and red flags are rarely raised during the high season on the Gironde coast. The future integration of forecasts into drowning prevention strategies should therefore take into account the social dimension of rip current hazard.49
We are confident that our model can be adapted to similar beaches with rip currents, but complete generalisation of our findings is inappropriate in the absence of more data. Lifeguard knowledge and the physical parameters of natural hazards require attention: our model was built on lifeguard hypothesis for beach attendance and physics models of natural hazard. The next steps are forecast validation by lifeguards and automation of feedback; these will allow the model to be continuously improved. As more data become available, other modelling strategies may be appropriate, such as Bayesian or neural networks. In such strategies, the importance of the exposure would be of interest to identify environmental conditions prone to risky behaviour.
Predicting the need for rescue from water in a hazardous environment is key to reducing the risk of drowning. Our predictive models can be used to efficiently deploy medical teams and rescue helicopters. An interventional study (performed under real-world conditions) is planned. A utility function reflecting risk perception/acceptance is required. This would allow prioritised preventative messages to be broadcast during high-risk periods. The strategy must employ behavioural change theory to reduce the risk to beachgoers. Evaluation requires reliable data from both lifeguard stations and emergency call centre files.
What is already known on the subject
Drownings along surf beaches are mainly caused by rip currents.
Rip currents activity is controlled by wave and beach morphology factors.
What this study adds
Along surf beaches of south western France, drownings can be anticipated using coast-wide wave and weather forecasts in combination with calendar factors.
Such methods could be adapted to other places with similar hazards.
Data availability statement
Compiled data are available in a public, open access repository. Detailed data may be obtained from a third party and are not publicly available. Therefore, daily model data are available on the OSF repository: https://osf.io/p9u8a/ and, due to data providers restrictions, 3-hour step model data are available upon request from the corresponding author (eric.tellier@chu-bordeaux.fr).
Ethics statements
Patient consent for publication
Ethics approval
Data collection was approved by the French national committee protecting data privacy (Commission Nationale de l’Informatique et des Libertés, CNIL), provided that only compiled (anonymised) data would be published. French law states that a retrospective observational study does not require ethics committee authorisation.
References
Supplementary materials
Supplementary Data
This web only file has been produced by the BMJ Publishing Group from an electronic file supplied by the author(s) and has not been edited for content.
Footnotes
Twitter @BrunoCastelle
Contributors ÉT: conceptualisation, methodology, software, validation, formal analysis, investigation, data curation, original draft preparation, review and editing. CG-J: methodology, original draft preparation, review. ML-B: methodology, original draft preparation, review. BC: conceptualisation, data curation, methodology, original draft preparation, review. BS: conceptualisation, methodology, data curation, investigation, review. RS: original draft preparation, review and editing.
Funding The authors have not declared a specific grant for this research from any funding agency in the public, commercial or not-for-profit sectors.
Map disclaimer The depiction of boundaries on this map does not imply the expression of any opinion whatsoever on the part of BMJ (or any member of its group) concerning the legal status of any country, territory, jurisdiction or area or of its authorities. This map is provided without any warranty of any kind, either express or implied.
Competing interests None declared.
Provenance and peer review Not commissioned; externally peer reviewed.
Supplemental material This content has been supplied by the author(s). It has not been vetted by BMJ Publishing Group Limited (BMJ) and may not have been peer-reviewed. Any opinions or recommendations discussed are solely those of the author(s) and are not endorsed by BMJ. BMJ disclaims all liability and responsibility arising from any reliance placed on the content. Where the content includes any translated material, BMJ does not warrant the accuracy and reliability of the translations (including but not limited to local regulations, clinical guidelines, terminology, drug names and drug dosages), and is not responsible for any error and/or omissions arising from translation and adaptation or otherwise.