Article Text

Abstract
Background Past research has shown how fires, heat and hot substances are important causes of health loss globally. Detailed estimates of the morbidity and mortality from these injuries could help drive preventative measures and improved access to care.
Methods We used the Global Burden of Disease 2017 framework to produce three main results. First, we produced results on incidence, prevalence, years lived with disability, deaths, years of life lost and disability-adjusted life years from 1990 to 2017 for 195 countries and territories. Second, we analysed these results to measure mortality-to-incidence ratios by location. Third, we reported the measures above in terms of the cause of fire, heat and hot substances and the types of bodily injuries that result.
Results Globally, there were 8 991 468 (7 481 218 to 10 740 897) new fire, heat and hot substance injuries in 2017 with 120 632 (101 630 to 129 383) deaths. At the global level, the age-standardised mortality caused by fire, heat and hot substances significantly declined from 1990 to 2017, but regionally there was variability in age-standardised incidence with some regions experiencing an increase (eg, Southern Latin America) and others experiencing a significant decrease (eg, High-income North America).
Conclusions The incidence and mortality of injuries that result from fire, heat and hot substances affect every region of the world but are most concentrated in middle and lower income areas. More resources should be invested in measuring these injuries as well as in improving infrastructure, advancing safety measures and ensuring access to care.
- burn
- descriptive epidemiology
- burden of disease
This is an open access article distributed in accordance with the Creative Commons Attribution 4.0 Unported (CC BY 4.0) license, which permits others to copy, redistribute, remix, transform and build upon this work for any purpose, provided the original work is properly cited, a link to the licence is given, and indication of whether changes were made. See: https://creativecommons.org/licenses/by/4.0/.
Statistics from Altmetric.com
Introduction
Burns and other injuries caused by exposure to fire, heat and hot substances can be severely disabling and can cause death even in the presence of healthcare services. While prevention of these injuries and safety programmes are integral to averting burden, it is also important to consider the role of medical services. The severity spectrum of such injuries may necessitate complex treatment by burn surgeons and intensive care services that are not reliably available in all areas of the world. When it comes to injuries such as burns, medical and surgical care advents such as split-thickness skin grafting in select anatomical locations, fluid and electrolyte repletion, and infection control have emerged as critical elements of care for victims of these injuries, in some scenarios mitigating risk of death and long-term disability.1 Comprehensive medical infrastructure for treating burn injuries is therefore a critical component of a healthcare system. Given the care requirements that severe injuries can demand, a detailed epidemiological assessment of the morbidity and mortality that can result from fire, heat and hot substances is important. Moreover, these injuries may become increasingly topical as there is increasing emphasis on ensuring that all areas of the world have access to standard-of-care interventions that have led to improved patient outcomes across various domains of illness and injury in resource-rich settings.1
Previous epidemiological research, which largely focuses on burns as opposed to all injuries that can result from fire, heat and hot substances, has found that the burden of morbidity and mortality from these injuries is distributed unevenly across income groups, with higher burden in lower income regions of the world but with persistent incidence and mortality even in higher income areas. Using mortality data from the WHO and economic data from the World Bank, Peck and Pressman explored the relationship between income and burn injuries, showing that these injuries presented the greatest burden in low and middle-income countries.2 There is some consensus in the literature that, with some exceptions, overall incidence and mortality are trending towards global declines, and several studies have concluded that still further decreases should be possible by increasing socioeconomic status, improving working conditions and launching focused safety awareness campaigns.2 3 Some country-specific increases in morbidity and mortality have been attributed to issues with injury documentation biases as well as increasing admission rates to burn centres as more patients seek treatment for minor injuries.3 Other country assessments, such as in Iran, have examined trends by age, sex, urbanicity and injury circumstances in order to make sense of trends over time.4 5 However, it is unclear whether these trends have continued in more recent years and in specific geographies. Changing population structures may also affect the morbidity and mortality risk of these injuries, as children under 4 years of age and adults over 60 years of age have been shown to have the highest rates of burn injuries and burn-related deaths.6 Injuries of this nature in younger populations are particularly concerning given the long period of disability that can follow. Hyder and colleagues conducted an injury surveillance study in four low and middle-income countries and found 17% of children with burn injuries experienced disability lasting longer than 6 weeks and 8% were estimated to have lifelong disability due to their burn injury.7 These findings point to the importance of comprehensive measurement of the burden of burns across countries, ages, sexes and time in helping to guide safety efforts, prevention interventions and resource planning.
Existing research on this topic is limited in several respects. These include data sparsity in low and middle-income countries where burden is estimated to be highest. Changes in criteria for and behaviour in seeking treatment from burn centres for injuries have led to difficulties in comparing data over time. In this paper, we aimed to address these limitations in three ways. First, we sought to provide updated estimates for all countries, including low and middle-income countries, using all available data sources with fatal and non-fatal cases. Second, we used covariates to help improve estimation in data-sparse locations. And, third, we generated estimates using modern spatiotemporal statistical modelling techniques.8 We also aimed to further explore the time trends of burn injuries across the socioeconomic development spectrum and to produce estimates for morbidity and mortality across all global locations, age groups, sexes and over time.
A worldwide network of collaborators contribute to the Global Burden of Disease (GBD) study, a comprehensive assessment of hundreds of diseases, injuries and risk factors. Using annually updated data and methods, the study produces estimates of all-cause mortality, causes of death (cause-specific mortality rates, years of life lost (YLL)), non-fatal health outcomes (ie, incidence, prevalence and years lived with disability (YLD)) and risk factors. These estimates are calculated across a range of years for all age groups, sexes and 195 countries and territories, grouped into 21 regions and seven super-regions. This level of estimation detail permits more granular analyses of morbidity and mortality across demographics, geographies and causes and nature of injuries.
To investigate the morbidity and mortality caused by fire, heat and hot substances, we used the GBD 2017 framework and findings. We then explored several themes that emerged from this investigation.
Methods
GBD 2017 study
The GBD 2017 study methods and results are described in extensive detail elsewhere, including description of the analytical estimation framework used to measure deaths, YLLs, incidence, prevalence, YLDs and disability-adjusted life years (DALY).8–13 A summary overview of the GBD study including key statistical methods is provided in online supplementary appendix 1. What follows is a description of the methodological components specific to injuries and fire, heat and hot substance estimation within the GBD framework.
Supplemental material
GBD injury classification
The GBD cause hierarchy categorises both the cause of injuries and the nature of injuries. External cause-of-injury categories or ‘codes’ are used for incidents such as falls and road injuries, as well as for fire, heat and hot substances. External cause-of-injury codes are mutually exclusive and collectively exhaustive within the injury estimation process. Nature of injury codes in turn categorise the injuries that result from an external cause, for example, the surface burn that can occur in a fire. Nature of injury codes group injuries into 47 mutually exclusive and collectively exhaustive categories, quantifying the various disabling outcomes of each cause of injury according to the International Classification of Diseases (ICD), specifically chapters S and T in ICD-10 and codes 800–999 in ICD-9. More information on nature of injury groups is provided in GBD literature.8
Mortality and YLLs from fire, heat and hot substances
The approach for modelling and estimating causes of death including deaths from fire, heat and hot substances is described in related GBD publications.14 A brief overview of this process is as follows. First, all available data sources for cause of death were accessed and mapped into the GBD cause list. Sources used for modelling fire, heat and hot substances include vital registration records, verbal autopsies, mortality surveillance, censuses, surveys, hospital data and mortuary data. For fire, heat and hot substances, we used ICD-9 codes E890–E899 and E924 and ICD-10 codes X00–X06.9 and X08–X19.9. Some sources, particularly verbal autopsy studies, typically do not codify cause of death using the ICD classification system and instead use custom cause of death categories; in these cases, the corresponding causes were mapped to the GBD cause list (eg, ‘fires’ as a cause in a verbal autopsy study would map to fire, heat and hot substances in GBD). Ill-defined causes of death are then redistributed to different causes, including fire, heat and hot substances via a process known as garbage code redistribution, which is conducted for each age, sex, country or territory, year and ICD type.15 16 This process allows for an individual who dies later from such an injury to still be included in the cause-specific mortality process.
After cause mapping, models for fire, heat and hot substances were conducted using the GBD Cause of Death Ensemble modelling (CODEm) method to produce estimates by age, sex, country, year and cause. CODEm builds an optimised cause of death model based on testing a large variety of possible models to estimate trends in causes of death using an algorithm to select varying combinations of covariates that are run through several modelling classes.17 An ensemble of best performing models is then created based on measured performance in out-of-sample validity testing. We also used covariates in these models, which included lag-distributed income per capita, education per capita in years, alcohol use in litres per capita, an indicator for opium cultivation, population density over 1000/km2, a summary exposure value for violent injuries, Socio-demographic Index (SDI) and Healthcare Access and Quality index.18 Deaths from each cause are then scaled to fit the overall mortality estimate for each demographic and location group in GBD.
YLLs due to fire, heat and hot substances are calculated by multiplying deaths by the residual life expectancy at the age of death as derived from the GBD 2017 reference model life table. YLLs are intended to show how many years of life are lost when a death occurs at an age less than the life expectancy; for example, if the life expectancy is 80 and a death occurs at age 5, then 75 years of life were lost.
Incidence, prevalence and YLDs due to fire, heat and hot substances
The approach to estimate non-fatal injury outcomes (incidence, prevalence and YLDs) in GBD is provided in related publications.8 19 A summary of these methods for fire, heat and hot substances is as follows. We applied DisMod-MR V.2.1 (an epidemiological meta-regression tool) to incidence data for fire, heat and hot substances from emergency department and hospital records and survey data to estimate inpatient and outpatient incidence by location, year, age and sex. This modelling process also used cause-specific mortality rates to guide model fits in data-sparse areas. We use a prior to assume that case fatality rates are higher in lower income settings by adding lag-distributed income per capita as a covariate on excess mortality, which causes a negative relationship between income and mortality. To determine the disability experienced by victims of fire, heat and hot substance injuries who experience multiple injuries, we developed a hierarchy to select the nature of injury that would lead to the largest long-term burden when an individual experiences multiple injuries. This calculation uses a combination of likelihood of long-term disability and the corresponding GBD disability weights, which are described in more detail in the GBD literature.19 The severity hierarchy was established using pooled data sets of follow-up studies from China, the Netherlands and the USA, where health status 1 year after injury could be mapped to existing GBD disability weights.20–26
Since injury disability is related to nature of injury (eg, burns covering more than 20% of the body or a digit amputation) rather than cause of injury (eg, exposure to a house fire as opposed to a road injury leading to a burn), we estimated the proportion of each cause-of-injury category, including fire, heat and hot substances, that results in a particular nature of injury category (eg, burns or digit amputation). These proportions were estimated using a Dirichlet regression method based on proportions of cause-nature combinations measured in dual-coded (ie, both cause of injury and nature of injury coded) hospital and emergency department data sets and data used elsewhere in GBD estimation as well as from the National Injury Surveillance System in China.8,27 Applying these matrices to our cause-of-injury incidence from DisMod-MR V.2.1, we produced incidence of injury warranting hospital admission and incidence of injury warranting other healthcare by cause and nature of injury. We then estimated short-term disability for each nature‐of‐injury category in the fire, heat and hot substance cause-of-injury category based on average duration for treated cases for each nature of injury and for inpatient and outpatient injuries from the Dutch Injury Surveillance System.23 Then, we estimated proportions of permanent disability (ie, longer than 1 year) for each nature of injury category using long-term follow-up studies.20–26 Then, we applied the ordinary differential equation solver used in the DisMod-MR V.2.1 computational engine to estimate the long-term prevalence for each nature of injury category from incidence and the long-term mortality risk for each nature of injury, since some nature of injury categories increase mortality risk above the background mortality rate. YLDs were calculated as the product of the prevalence of a health state and a disability weight, adjusted for comorbidity with other diseases and injuries as described in GBD literature.8
Mortality-to-incidence ratio
For select analyses in the Results section, we calculated the ratio of age-standardised mortality rates to age-standardised incidence rates of fires, heat and hot substances. These calculations were based on the same estimates reported in the Results section.
Socio-demographic Index
SDI is an indicator that incorporates lag-distributed income per capita, mean educational attainment among people 15 years or older and total fertility rate under the age of 25. The SDI ranges from 0 to 1; 0 is assigned to the GBD location with the lowest income per capita, lowest educational attainment and highest fertility rate from 1980 to 2017, and 1 represents the level above which higher income per capita, higher educational attainment and lower fertility under 25 are no longer associated with health improvements across results from the GBD study. We show some results by SDI quintile in order to illustrate morbidity and mortality trends along different levels of development.
Guidelines for Accurate and Transparent Health Estimates Reporting compliance
This study complies with the Guidelines for Accurate and Transparent Health Estimates Reporting recommendations (online supplementary appendix 2). All analytical code is available via healthdata.org.
Supplemental material
Results
Results were produced for 195 countries and territories in 1990 and 2017. Additional results with detail by age, sex, year and location are available via healthdata.org.
Incidence
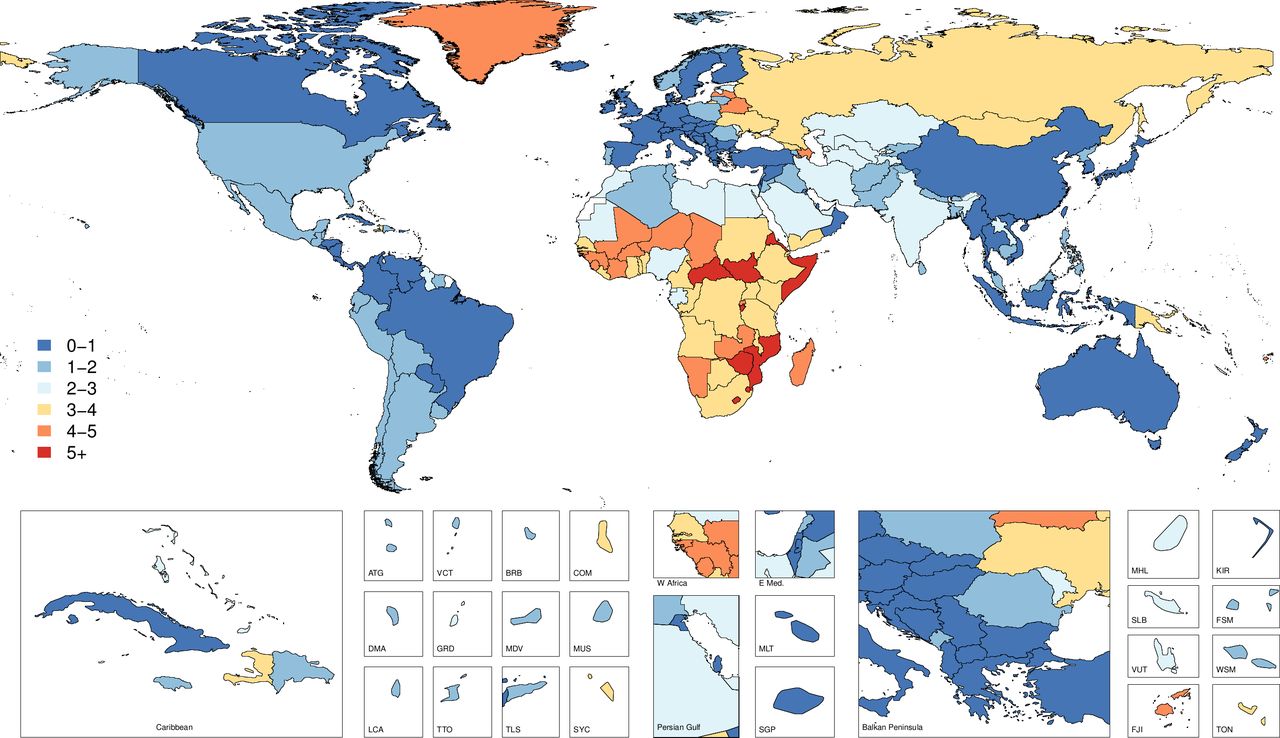
Online supplementary appendix table 1 presents the all-age incidence counts and the age-standardised incidence rates for 2017 as well as the percentage change in age-standardised rates from 1990 to 2017. Figure 1 shows these geographical patterns by country with age-standardised incidence rates by country and territory for 2017. Figure 2 provides per cent change in age-standardised incidence rates by country and territory. Globally, the age-standardised incidence was 119 (95% uncertainty interval (UI) 99 to 142) per 100 000 in 2017, representing a non-significant decline of 5.4% (−11.1 to 0.3) from 1990 to 2017, and equating to 8 991 468 (7 481 218 to 10 740 897) cases in 2017. The age-standardised incidence rate did not experience significant change for any SDI quintiles except the high SDI quintile, where it decreased significantly, by 12.0% (−17.4 to −6.7). The regions with the highest age-standardised incidence rates in 2017 were Eastern Europe with 303 (256 to 359) cases per 100 000, Central Asia with 298 (251 to 353) cases per 100 000 and Southern Latin America with 226 (187 to 272) cases per 100 000. Among the 21 GBD regions, 9 experienced significant decreases in age-standardised incidence rates (Eastern Europe, Eastern sub-Saharan Africa, North Africa and Middle East, Central Asia, Central Latin America, Southeast Asia, Southern sub-Saharan Africa, Tropical Latin America, High-income North America), 3 regions experienced significant increases in age-standardised incidence rates (East Asia, Southern Latin America, High-income Asia Pacific) and the remaining 9 regions experienced no significant change in age-standardised incidence rates (Australasia, Oceania, Caribbean, South Asia, Central Europe, Western sub-Saharan Africa, Western Europe, Andean Latin America and Central sub-Saharan Africa).
Supplemental material

Map of age-standardised incidence per 100 000 of fire, heat and hot substance injuries by country and territory in 2017.

Map of percent change for age-standardised incidence per 100 000 of fire, heat and hot substance injuries by country and territory between 1990 and 2017.
Prevalence
Online supplementary appendix table 1 shows the all-age prevalence counts and the age-standardised prevalence for 2017 as well as the percentage change in age-standardised prevalence from 1990 to 2017. Globally, the age-standardised prevalence was 1247 (95% UI 1065 to 1452) per 100 000 in 2017, representing a decline of 9.7% (−11.7 to −7.8) from 1990 to 2017, and equating to 99 746 814 (85 298 471 to 115 988 070) cases in 2017. East Asia had the highest number of prevalent cases in 2017 with 21 434 056 (17 943 830 to 25 366 091) cases across all ages and both sexes. The age-standardised prevalence rate decreased in every SDI quintile except the middle SDI quintile (where it did not change), with the largest decline in the high SDI quintile, at 11.4% (−13.0 to −10.0). The regions with the highest age-standardised prevalence rates were Central Asia with 2581 (2203 to 2981) cases per 100 000, Eastern Europe with 2346 (2006 to 2743) cases per 100 000 and High-income Asia Pacific with 2257 (1918 to 2658) cases per 100 000. Among the 21 GBD regions, 14 experienced significant decreases in age-standardised prevalence rates, 3 regions experienced significant increases in age-standardised prevalence (Australasia, High-income Asia Pacific, East Asia) and the remaining 4 regions experienced no significant change in age-standardised prevalence (Southern Latin America, Oceania, Caribbean, South Asia).
Cause-specific mortality
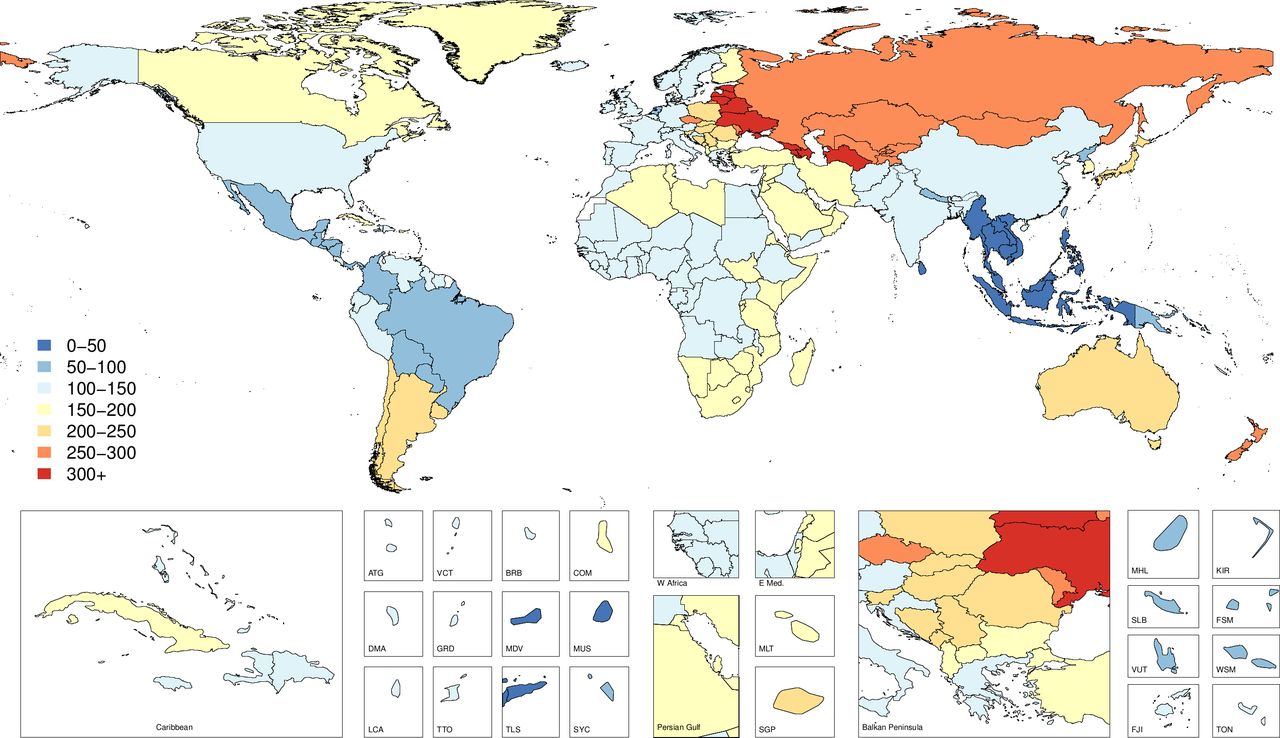
Online supplementary appendix table 2 shows the all-age death counts and the age-standardised mortality rates for 2017 as well as the percentage change in age-standardised rates from 1990 to 2017. Figure 3 shows mortality rates by country and territory for 2017, while figure 4 shows changes in mortality rates by country and territory from 1990 to 2017. Globally, the age-standardised mortality rate was 1.6 (95% UI 1.3 to 1.7), which equated to 120 632 (101 630 to 129 383) deaths in 2017 and represented a 46.6% (−49.7 to −38.8) decrease in age-standardised mortality from 1990 to 2017. Every SDI quintile experienced a significant decrease in age-standardised mortality rates, with the greatest decline in the high SDI quintile, by 55.2% (−56.1 to −54.2) from 1990 to 2017. The regions with the highest age-standardised mortality rates were Southern sub-Saharan Africa with 4.3 (3.6 to 5.1) deaths per 100 000, Eastern sub-Saharan Africa with 4.0 (3.4 to 4.7) deaths per 100 000 and Central sub-Saharan Africa with 3.7 (2.4 to 4.7) deaths per 100 000. South Asia had the highest number of deaths, with 31 684 (23 098 to 36 828) deaths estimated in 2017.
Supplemental material
Map of age-standardised mortality per 100 000 of fire, heat and hot substance injuries by country and territory in 2017.

Map of percent change for age-standardised mortality of fire, heat and hot substance injuries by country and territory between 1990 and 2017.
YLDs, YLLs and DALYs
Online supplementary appendix table 3 shows the counts, age-standardised rates and percentage change from 1990 to 2017 of YLDs, YLLs and DALYs. Globally, fire, heat and hot substances resulted in 5 286 270 (95% UI 4 308 890 to 5 836 389) YLLs, 3 177 003 (2 210 387 to 4 396 730) YLDs and 8 463 273 (7 034 048 to 9 881 099) DALYs, reflecting age-standardised rates of 71 (58 to 79) per 100 000, 40 (28 to 55) per 100 000 and 111 (93 to 129) per 100 000, respectively. Age-standardised YLLs, YLDs and DALYs declined by 50.8% (−55.8 to −39.3), 24.4% (−29.4 to −19.3) and 43.7% (−49.3 to −34.1), respectively, between 1990 and 2017. The region with the highest age-standardised DALY rate was Southern sub-Saharan Africa with 237 (198 to 281) DALYs per 100 000 which represented 171 (137 to 208) YLLs per 100 000 and 67 (48 to 88) YLDs per 100 000.
Supplemental material
Mortality-to-incidence ratios
Figure 5 shows the ratios of age-standardised mortality rates to age-standardised incidence rates by region in 1990 and 2017, which approximates the risk of death given a burn injury. This figure shows how the mortality-to-incidence ratios (MIR) vary by both time and location. Oceania had the highest MIR in 2017, while Australasia had the lowest, following the patterns of percentage DALYs caused by YLDs as described above. While MIR varied substantially across regions, it also declined in every region from 1990 to 2017.
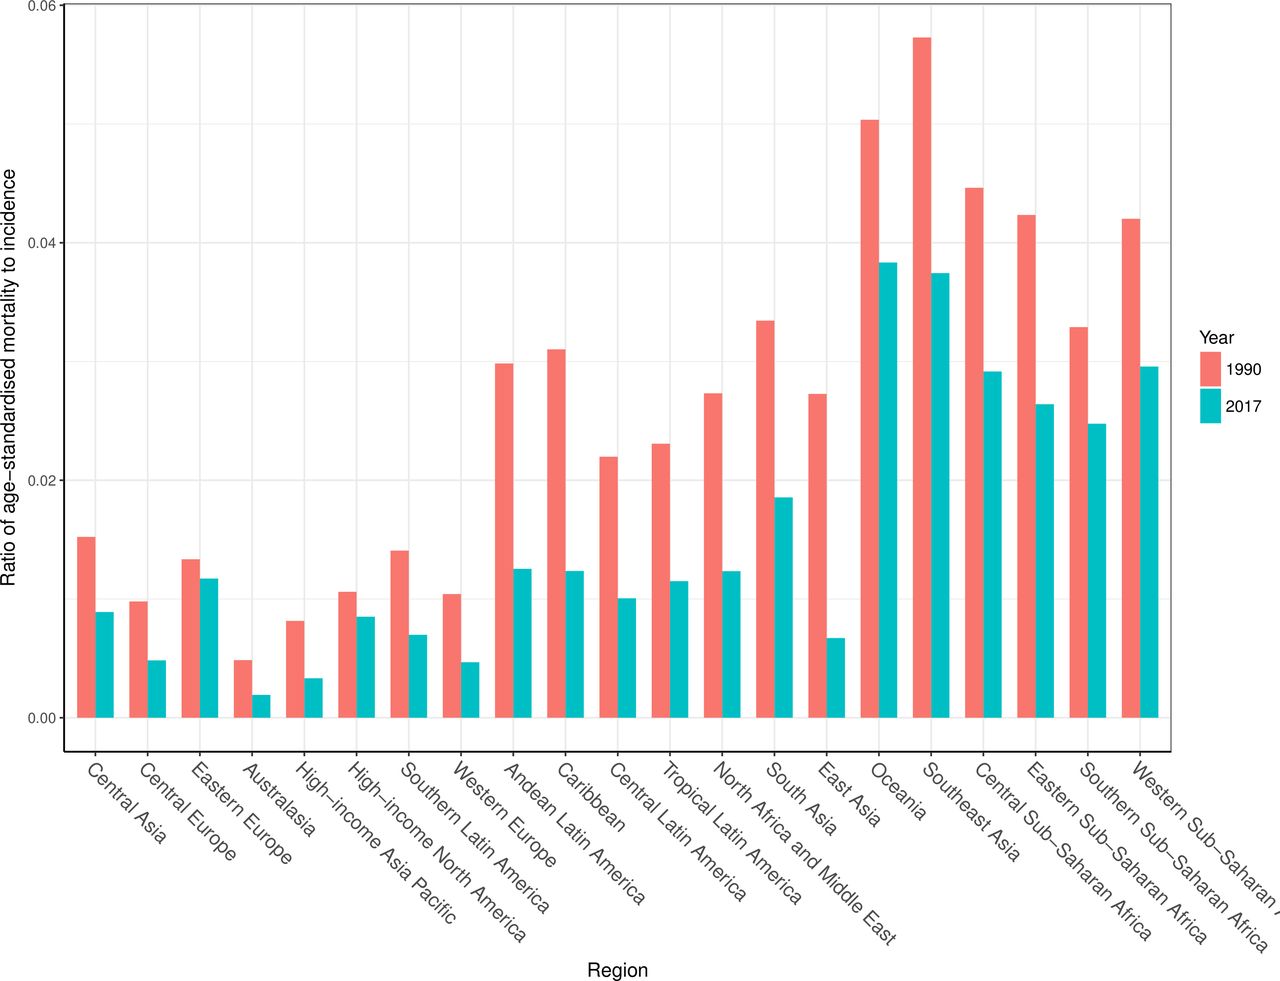
Mortality-to-incidence ratios for 1990 and 2017 by GBD region.
Nature of injuries caused by fire, heat and hot substances
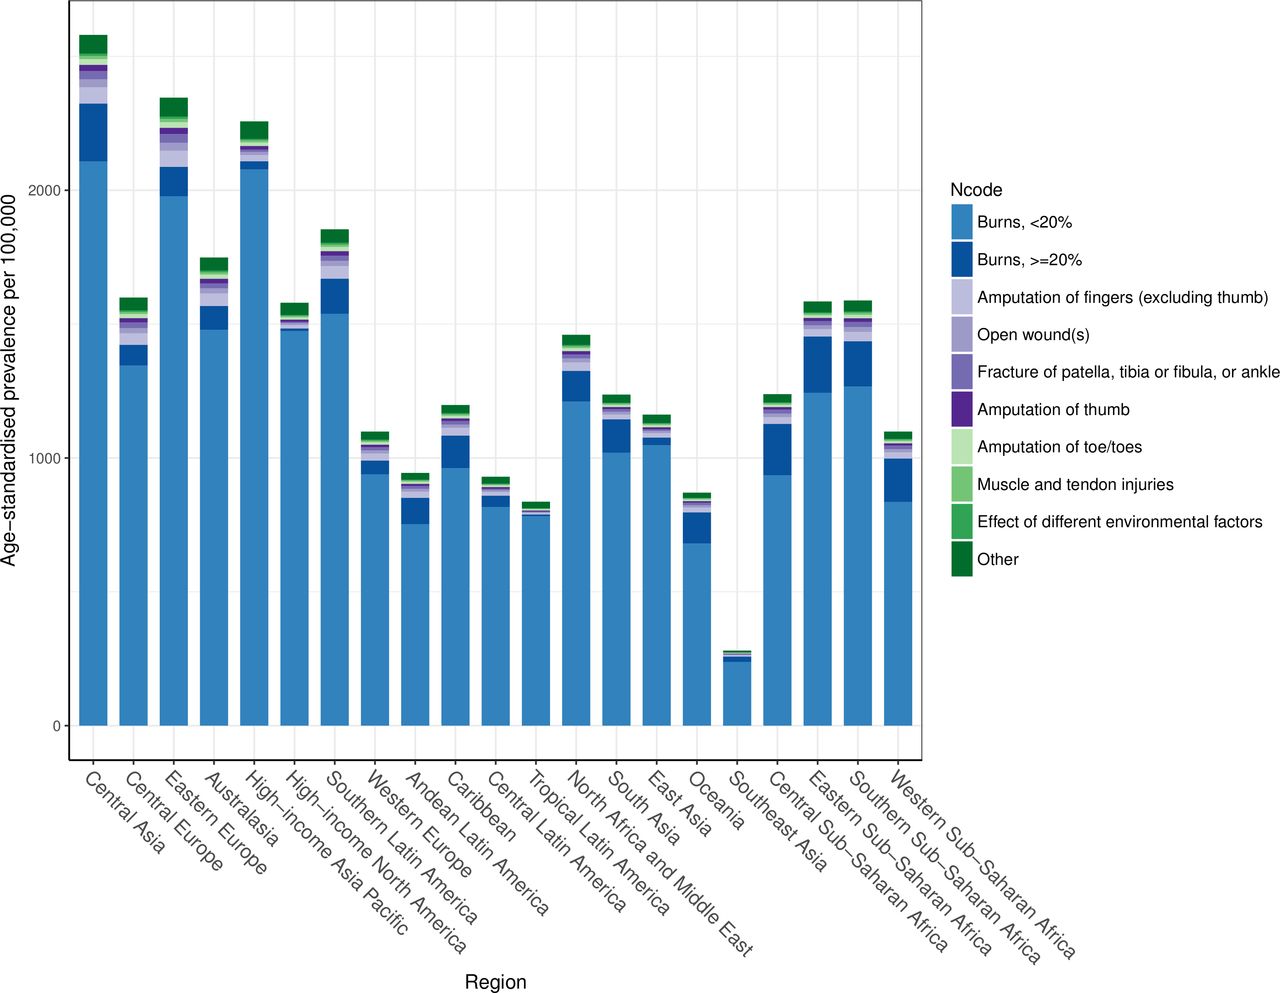
The average disability weight globally after comorbidity adjustment was 0.032, meaning that the average person suffering from a fire, heat and hot substance injury lost 3.2% of their full health status. This relatively small disability weight likely represents the large percentage of fire, heat and hot substance victims who experience less severe injuries. Figure 6 shows the distribution of nature of injury codes among the fire, heat and hot substance external cause codes for age-standardised prevalence by region. This figure shows that the leading cause of disability for victims of fire, heat and hot substances is—by far—burns affecting less than 20% surface area. Burns affecting over 20% of the body surface area are a relatively small proportion of all disability, as are the other nature of injury codes.
Composition of age-standardised prevalence by nature of injury category among all fire, heat and hot substance prevalent cases.
Discussion
Our study is the first to report global, regional, national and SDI-based estimates for fire, heat and hot substances in terms of incidence, prevalence, mortality, YLDs, YLLs and DALYs with the GBD 2017 study framework and findings. These results are of great value to health professionals and policymakers who can reduce burden and set priorities to develop and implement curative and prevention programmes to reduce incidence and ensure proper recovery in the event of these injuries. Our results point to three central themes in the epidemiology of injuries due to fire, heat and hot substances.
The first theme pertains to the relationship between burden and geography, both in terms of level of development and region of the world. As mentioned in the Introduction section, other epidemiological studies have observed this relationship and have provided some perspective on the reasons for this relationship. Our study observed similar trends, with SDI quintile and geographical region largely impacting the burden in terms of incidence, mortality and DALYs, as evidenced in the results tables.
The second theme is an extension of this observation. Development and geography appear to govern the incidence and the mortality of fires, heat and hot substances. The relationship between geographical region and mortality becomes more pronounced in the results shown in figure 5, which suggests that while lower income areas are more susceptible to fire, heat and hot substances as a cause of injury, they also experience higher mortality rates when these injuries occur. In other words, region appears to affect the risk of these injuries and explains the higher fatal burden driven by these causes. The higher MIRs in these regions suggest that one of the factors driving the relationship between income and health loss from fire, heat and hot substances is a lack of access to treatment and care facilities. Indeed, the body of literature that has explored the relationship between rapid access and treatment to care in the event of fire-related injuries substantiates the likely reason for the MIR distributions observed in this study.28 It is possible that the assumed relationship between income and mortality as described in the modelling process is contributing to this effect, and future research should be focused on using more data sets that allow for computation of case fatality rates to provide more guidance for future modelling updates. Similarly, it would be valuable to measure the effects of smoke alarms and smoking regulations on the incidence of these injuries or other variables that may be more relevant in certain geographies such as the use of certain types of cooking fuel.
The third theme is that across global locations and income groups, the burden of these injuries in terms of fatal and non-fatal health outcomes generally decreased between 1990 and 2017. Nine of 21 GBD regions experienced a significantly decreased burden from fires, heat and hot substances. It is likely these trends are partially explained by improvements in income over the 28-year period of our study as well as general improvements in safety and healthcare access and quality and decreases in smoking in certain areas of the world. Exceptions to this trend in terms of age-standardised incidence included areas of Latin America and Asia with countries such as China, Vietnam and Argentina within these regions demonstrating an increase in age-standardised incidence over time. There are several possible reasons for these exceptions. It is possible that population expansion and urban crowding in densely populated locations have led to living and working conditions that increase the risk of fire-related injuries, particularly in areas where development growth has not been commensurate with population growth and density. These trends could lead to unsafe infrastructure and heightened risk of fire injures in concentrated population spaces. While establishing the underlying reason for the fire, heat or hot substance injury was outside the scope of this study.Future GBD studies could potentially explore these reasons in more detail, particularly as more clinical data with detailed ICD coding become available or as other literature and survey-based estimates are added to the GBD.
There are a number of avenues for future research. Research on the epidemiology of fire, heat and hot substances might further measure the decreased quality of life that results from a fire-related injury and that is not necessarily captured in the GBD disability weight measurement. Such research might focus specifically on the economic implications of injury. For example, some studies have attempted to quantify the lost human capital resulting from burn injuries. One study in Spain estimated the mean annual cost (direct and indirect) of burn-related fatalities and hospital admissions was US$99 773, which included the cost of temporary and permanent disability in addition to medical care. The study also noted that burns were the costliest condition in their analysis, outranking stroke and HIV/AIDS.29 In the USA, one study estimated that the cost in terms of human capital per medically treated burn injury amounted to US$15 733 (2017 US$) after accounting for acute and long-term treatment, wage loss following injury and work loss in the event of permanent disability.30 A report released by the English Office of the Deputy Prime Minister notes the ethical barriers to and difficulties of associating monetary values with a human’s worth but recognises the necessity of the practice as these monetary estimates play an important role in policy development in terms of measuring both the immediate and long-term consequences of a serious burn injury, including lifelong disability, loss of work for the injured and family caregivers, psychological suffering and medical costs.31
Our study had several limitations which should be considered in the interpretation and utilisation of these results. First, a general limitation in the GBD study is that some areas of the world where the risk of an injury caused by fire, heat and hot substances is thought to be high can at times have relatively low data coverage for high-quality vital registration mortality data as well as hospital and clinical data that are used to inform our non-fatal modelling process. In addition, some individuals suffering minor injuries from these causes may not reliably seek medical care. An ongoing objective of the GBD study is to continue adding high-quality cause of death as well as incidence and prevalence data to our database and modelling framework.
A second limitation pertains to the number and type of data sets that inform the relationship between the cause of injury and the injuries that result, such as burns, amputations and other bodily harm. These relationships likely vary by age, sex, location and year, and currently we do not have hospital or clinical data from many lower-income areas of the world where the incidence of these injuries appears to be highest. Therefore, it will be advantageous in future iterations of this study to continue adding clinical data that include both cause-of-injury ICD codes and nature of injury codes so these relationships can continue to be measured with improved accuracy, which could also lead to more detailed sequelae estimates including contractures. Current research and development with the Global Burn Registry Form may also lead to improved data collection methods for these injuries.7 32 33
An additional limitation pertains to the burden of self-inflicted burns in areas of South and Southeast Asia. Prior research has characterised the high number of deliberate burn cases in India, Sri Lanka, Nepal and other countries.34–36 While the external cause for these injuries should in theory be classified as self-harm or intentional injury in the GBD hierarchy, it is possible that at the hospital level, diagnosis classification avoids certain codes due to stigmatisation of self-harm. Additionally, this study focuses on the burden of fire, heat and hot substances and does not include analysis of burns that result from other causes, which is important as other research has identified burns caused by interpersonal violence and gender-based violence as critical issues in countries including India and Nepal.37 38 Future research should also consider burns specifically from causes such as self-immolation, which would inform more focused prevention and intervention strategies.39
A final limitation is that we currently do not estimate the underlying reason or circumstances for exposure to fire, heat and hot substances, for example, exposure from cooking fires versus occupational injuries in the workplace. The available literature suggests that these mechanisms vary by country, depending on income, cultural idiosyncrasies and other factors.2 6 40 41 For example, one study noted that burn incidents in North Karnataka, India, tended to be concentrated among females wearing synthetic clothing who were exposed to open flames in the kitchen.42 Identifying underlying reasons for a fire, heat,and hot substance injury could help inform policy and discourse focused on mitigating the specific risks of exposure to these injuries for given populations.
Conclusion
The incidence and mortality due to fire, heat and hot substances are generally in decline, though there are important exceptions to these patterns among fatal and non-fatal health outcomes. This study includes burden estimates for every country and should be used to inform priorities and goals in health policy. The variation in these patterns highlights the need for universal access to care services that can mitigate disability and death from these injuries, as well as the importance of injury prevention methods that emphasise safety in consumer products and residential and occupational spaces as populations grow and concentrate as well as education and policy-level interventions. In addition, it will be important to continue collecting more detailed data on the underlying reasons for exposure to fire, heat and hot substances and to continue expanding the geographical coverage of data sources in epidemiological studies on the burden of these injuries.
What is already known on the subject
Existing research suggests that exposure to fire, heat and hot substances causes significant morbidity and mortality globally, and that the burden of these injuries falls disproportionately in lower resource settings.
What this study adds
This study provides further evidence that the burden of morbidity and mortality due to fire, heat and hot substances more heavily afflicts lower income locations.
This research found that from 1990 to 2017, just three of 21 Global Burden of Disease regions experienced a significant increase in age-standardised incidence rates of injury caused by fire, heat and hot substances.
This study measured wide variation in terms of trends over time across countries with some countries such as China increasing by more than 30% in terms of age-standardised incidence rates, while other countries such as Greenland decreased by more than 45%.
Acknowledgments
Prof. Till Bärnighausen was supported by the Alexander von Humboldt Foundation through the Alexander von Humboldt University Professor award, funded by the Federal Ministry of Education and Research. Prof. Félix Carvalho and Prof. Eduarda Fernandes received support through Portuguese national funds (UID/MULTI/04378/2019 and UID/QUI/50006/2019 with FCT/MCTES). Abdallah M Samy acknowledges support from a fellowship from the Egyptian Fulbright Mission Program. Prof Tissa Wijeratne acknowledges the Department of Medicine, Faculty of Medicine, University of Rajarata, Saliyapura, Anuradhapura, Sri Lanka.
References
Footnotes
Funding This study was funded by the Bill & Melinda Gates Foundation.
Map disclaimer The depiction of boundaries on the map(s) in this article do not imply the expression of any opinion whatsoever on the part of BMJ (or any member of its group) concerning the legal status of any country, territory, jurisdiction or area or of its authorities. The map(s) are provided without any warranty of any kind, either express or implied.
Competing interests Dr. Spencer James reports grants from Sanofi Pasteur, outside the submitted work. All other authors have nothing to disclose. Dr. Carl Abelardo T Antonio reports grants and personal fees from Johnson & Johnson (Philippines), Inc., outside the submitted work.
Patient consent for publication Not required.
Provenance and peer review Not commissioned; externally peer reviewed.
Data availability statement Data are available in a public, open access repository. Data are available upon reasonable request. Data may be obtained from a third party and are not publicly available.