Article Text

Abstract
Introduction This article proposes a novel method for matching places based on visual similarity, using high-resolution satellite imagery and machine learning. This approach strengthens comparisons when the built environment is a potential confounder, as in many injury research studies.
Methods As an example, I apply this method to study the spatial influence of alcohol outlets (AOs) on firearm violence in Philadelphia, Pennsylvania, specifically beer stores and bar/restaurants. Using a case–control framework, city blocks with shootings in 2017–2018 were matched with similar-looking blocks with no shootings, based on analysis with a pretrained convolutional neural network and t-distributed stochastic neighbour embedding. Logistic regression was used to estimate the OR of a shooting on the same block as an AO and within one-block and two-block distances, conditional on additional factors such as land use, demographic composition and illegal drug activity.
Results The case–control matches were similar in visual appearance, on human inspection, and were well balanced on covariate measures. The fully adjusted model estimated an increased shootings risk for locations with beer stores within one block, OR=1.5, 95% CI 1.1 to 2.1, p=0.02, and locations with bar/restaurants on the same block, OR=1.6, 95% CI 1.1 to 2.4, p=0.02.
Conclusion These findings align with previous study findings while addressing the concern that AOs might systematically be located in certain kinds of environments, providing stronger evidence of a causal effect on nearby firearm violence. Matching on visual similarity can improve observational injury studies involving place-based risks.
- Firearm
- Case-Control Study
- Epidemiology
- Urban
Statistics from Altmetric.com
Introduction
Injury risks vary substantially across places. This principle has been implicit in research designs since the beginning of modern injury epidemiology: in the early 1960s, Haddon and colleagues recruited control participants from the exact sites of recent fatalities in order to eliminate the built environment as a possible confounder of the association between alcohol consumption and traffic injuries.1 2
When built environment features are the exposures of interest, injury researchers must allow variation on those features while controlling for other potential confounders. For instance, in a case–control study of older pedestrian injuries at intersections, Koepsell and colleagues3 selected controls by matching index case locations on attributes of the road network, then adjusted their statistical estimates using pedestrian and vehicle flow counts they collected from in-person observation at hundreds of sites.3 Not only does this approach rely on time-consuming field data collection, it depends on the assumption that no potential confounders have been overlooked.
Computational advances could help address these problems. Machine learning models have proven adept at replacing human observers for simple visual tasks4 and can ‘mine’ large datasets for previously unknown associations, potentially overcoming two important challenges in place-based control selection.
This paper proposes a novel strategy, using high-resolution satellite imagery and machine learning, for selecting place-based controls. It focuses on the small spatial units (‘micro places’) where comparing places is particularly difficult using traditional approaches. As a sample case, I use this micro place matching strategy to analyse the influence of alcohol outlets (AOs) on nearby firearm violence in Philadelphia, Pennsylvania. Blending methods from epidemiology, criminology and computer science, the proposed approach goes further than other recent research on this topic to control for place-based confounding, making inferences about causal associations more persuasive.
Methods
The influence of AOs on interpersonal violence
Numerous cross-sectional studies have found a positive association between the density of AOs and rates of violence at the neighbourhood level, using units such as census tracts, even after controlling for other neighbourhood-level differences.5 6 These results, however, reveal relatively little about how or why AOs increase violence6 and have left persistent questions about whether AOs increase risk independent of other neighbourhood-level factors.7 8 Other study designs, examining the effects of changes in alcohol availability5 and the individual-level risk of violent victimisation from spending time in higher-AO locations,9–11 have yielded mixed results.
Another common approach has been to examine whether violent incidents cluster around AOs. Such an approach has deep roots in spatial epidemiology: Snow found the source of an 1854 London cholera outbreak by mapping the precise locations of cholera cases and showing that they clustered around a particular drinking water source.12 Similarly, a number of criminologists have examined the spatial influence of AOs (see ref 13 for a review.) These studies have typically found that violence is higher in the immediate vicinity of AOs and up to a few blocks away, after which no effect is observed, bolstering the conclusion that AOs play a causal role in nearby violence.6
AOs, however, may be located in places that are systematically different from other nearby places, making place a potential confounder. A few recent crime studies have accounted statistically for differences such as neighbourhood demographics and socioeconomic status13 and for block-level features (eg, street trees, vacant lots and public facilities).14 While adding block-level features aims to account for differences in the built environment, the selection of covariates is limited by data availability and relies on questionable modelling assumptions, discussed further below.
The present study extends this literature by (A) focusing on firearm violence, a form of violence that causes a large proportion of injury-related deaths, particularly among young men and boys of colour,15 and (B) making place-based comparisons more rigorous and less model dependent.
Data used
The dependent variable was fatal and non-fatal shootings in Philadelphia in 2017–2018 that did not involve police officers. For privacy reasons, shooting locations were aggregated to the 100-block level: for example, ‘123 Main Street’ would become ‘100 Block Main Street’. A small proportion (6%) coded to intersections was removed, as prior studies focusing on street segments have done.16 Philadelphia street segments were combined when they shared the same 100-level address, forming a dataset of city blocks (n=24 408). Shootings were joined to city blocks based on addresses, with a match rate of 94%. For this analysis, shooting outcomes on a given block were treated as binary, with 7% of blocks experiencing at least one shooting in 2017–2018. Repeating the analysis with shootings as a count variable did not substantially alter the results.
The analysis tested on-premises AOs (‘bar/restaurants’) (n=1723) and off-premises AOs that sell beer (‘beer stores”) (n=272) based on alcohol licencing data. In Pennsylvania, only state-run outlets may sell hard liquor for off-site consumption. Correspondingly, Philadelphia has many fewer liquor stores than similar-sized cities in other states, and real or perceived increases in guardianship at these outlets due to their official designation may influence nearby violence rates.11 To focus the analysis on locations where results were more readily interpretable, state-run liquor stores were omitted.
To assign each AO to a corresponding city block, Thiessen polygons were calculated using block midpoint locations, following Wheeler.14 For each block midpoint, the corresponding Thiessen polygon delineated the space that was closer to that midpoint than any other. For city blocks that comprised multiple street segments, the corresponding polygon combined multiple Thiessen polygons, generated from the midpoint of each constituent street segment and the midpoint of the combined unit. This approach was intended to prioritise the influence of large blocks over the smaller side streets whose midpoint might have been closer to a shared intersection. Each AO was assigned to the block whose corresponding polygon contained the AO coordinates.
Block-level exposure to nearby AOs was measured as binary variables based on whether one or more AO was located on an adjacent block (‘within one block’) or on a block adjacent to those blocks (‘within two blocks’) based on Thiessen polygon contiguity. This measure was used by Wheeler14 and was more appropriate than a metric based on fixed distance units, since shooting location was only known at the block level. Following Wheeler,14 polynomial splines were used to account for the disproportionately sized polygons assigned to blocks that lacked nearby neighbours. These adjustments for polygon size were included in every regression model; for readability, these terms are not included in the results below.
Four types of covariates were included as potential confounders: sociodemographic characteristics, built environment, drug-related activity and land use. Sociodemographic characteristics were obtained from the 2016 American Community Survey. Following Branas et al,9 these variables were the population per square mile of black, Hispanic and unemployed residents, as well as the total area income in USD, estimated using inverse distance weighting with a maximum bandwidth of 2 miles. Built environment variables were vacant lots and street trees, which multiple studies have found to be independently associated with place-based firearm violence risk, including specifically in Philadelphia.17–20 Drug-related activity, which Lipton et al 8 adopted as a control variable,8 was represented as the density of reported incidents related to illegal drugs, both for distribution and possession, calculated using kernel density estimation (bandwidth=1000 feet) from 2012 to 2016 police data. To separate the effects of AOs from other establishments with high foot traffic, we included commercial land use, that is, the number of parcels zoned for commercial use within the Thiessen polygon, following Morrison et al.11
For each city block, an aerial image was downloaded using the Google Maps Application Programmer Interface (API). Images were centred on the block midpoint and displayed a ground surface area of approximately 886 by 886 feet. This resolution was sufficient to show the full length of almost every block, since 886 feet was approximately the 90th percentile for block length. Typically, a few neighbouring blocks were visible as well. Most images were taken in mid-2017.
Matching cases and controls on visual appearance
Each aerial image was first converted to a simpler numeric representation using a pretrained convolutional neural network (CNN) trained on the ImageNet dataset. This representation, a 256-long vector, was extracted from the third convolutional layer of the VGG16 algorithm.21 Each value in this vector corresponds to an abstract attribute, consisting of colours, edges and textures, that is generically relevant to image interpretation. These values function like latent variables describing the physical environment, effectively distinguishing among scenes, but do not correspond directly to real-world features such as the number of trees or buildings observed in the scene. In prior studies, researchers have used CNN-derived features from high-resolution satellite imagery to model the built environment’s association with wealth22 and obesity.23
Next, these 256 latent variables were reduced to two latent dimensions using t-distributed stochastic neighbour embedding (t-SNE). Like principal component analysis (PCA), t-SNE is used to summarise a complex dataset in lower-dimensional space.24 Whereas PCA transforms observations according to the dimensions of maximum variance, t-SNE uses machine learning techniques to situate similar observations near to each other, making it a more suitable technique for this analysis of visual similarity.
Finally, one matched control location was selected for every case location (n=1409) based on proximity in the t-SNE-generated two-dimensional space. The nearest neighbour was assigned as a match, without replacement, with locations removed from the potential matching pool as soon as they were assigned to a case (‘greedy’ matching). There were two additional conditions imposed on these matches. First, controls were only eligible if they were located at least 0.5 mi away from the case site to avoid potential contamination. Second, controls were required to belong to the same roadway type as the index case block. This step was included because preliminary testing showed that the matching algorithm would sometimes select a control that was a suitable match for a block depicted on the margins of the image, but not the index case block, which was centred in the image.
For this study, no additional covariates were used for matching, making it possible to assess the level of balance on typical control variables that was achieved using imagery alone. Compared with the full pool of potential matches, matching on imagery was expected to improve case–control balance substantially for the visible environmental variables (street trees, vacant lots and commercial land use) and for physical infrastructure characteristics that were not otherwise measured.
Estimating AO effects on shootings
After matching, the study dataset consisted of observations from street segments where a 2017–2018 shooting occurred (n=1609) and from matched street segments where no shooting occurred (n=1609). Following the conventions of case–control analysis, logistic regression was used to estimate the ORs associated with the AO exposures: a bar/restaurant or beer store: (A) on the same block, (B) within one block and (C) within two blocks. For rare outcomes such as shootings, ORs are commonly used to measure relative risk.25
The simplest model contained only the binary shooting outcome (dependent variable) and the AO variables (independent variables). Additional models were specified with different combinations of the potential confounders discussed above. To enable direct comparisons of regression coefficients for both continuous and binary inputs, all continuous inputs were mean centred and scaled by two SD prior to modelling.26
These models all displayed strong spatial dependence in the deviance residuals. In other words, the observations violated the assumption of independence and identical distribution with respect to underlying spatial trends in firearm violence. The next step was to address this problem. A thin-plate spline was fit to each model’s residuals then added back to the original model as a covariate, adapting from Goldstick et al.27 The corrected models, which are reported here, displayed no residual spatial dependence in Moran’s I tests.
The convolutional neural network was implemented in Python using the Keras API. t-SNE was implemented in Python using the scikit-learn package. Sample Python code to conduct the image analysis is included in the online supplementary data. All subsequent analyses were conducted in R. Institutional review board review was waived as non-human subjects research.
Supplemental material
Results
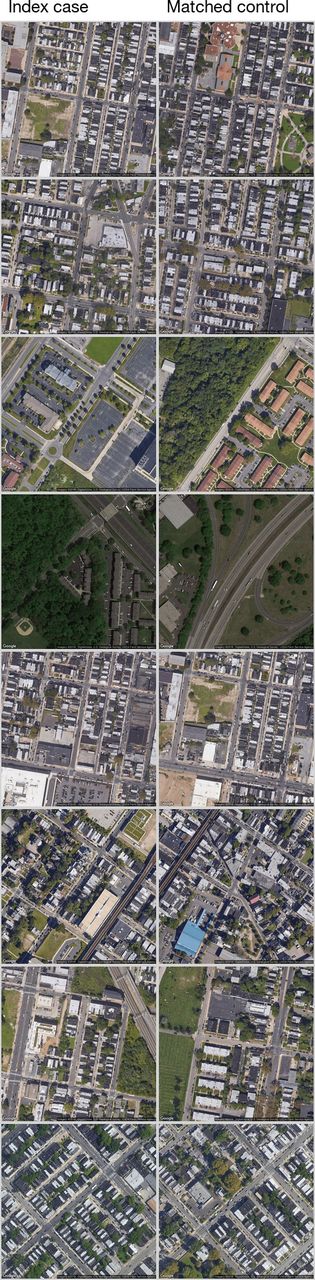
On human inspection, the case–control matches appeared similar in terms of land cover, green space and other aspects of the blocks’ basic physical infrastructure (figure 1). Although there was a minimum geographical distance allowed for each case–control pair, the final case and control groups displayed generally comparable geographic distributions (figure 2).

Sample imagery from case locations and matched control locations. Image credit: Google Maps.

Map of case (n=1609) and control (n=1609) locations.
The case–control matching process substantially improved balance on each of the potential confounders, compared with the full dataset (table 1), even though those covariates were not using for matching. For instance, the nearby black population density (1000 persons/square mile) was much closer at case locations (M=14.9) to matched controls (M=14.2) than to unmatched units (M=9.9).
Characteristics of case locations, matched controls and unmatched locations
In the fully adjusted model (table 2), beer stores within one block, OR=1.5, 95% CI 1.1 to 2.1, p=0.02, and bar/restaurants on the same block, OR=1.6, 95% CI 1.1 to 2.4, p=0.02, were associated with increased shootings risk. Bar/restaurants within one block were associated with increased risk in the three partially adjusted models, but not after controlling for commercial land use. At two blocks away, beer stores and bar/restaurants were not associated with risk in any of the models. In the fully adjusted model, the other covariates associated with risk were black population, OR=1.9 per 2 SD increase, 95% CI 1.4 to 2.6, p<0.001; illegal drug activity, OR=1.6 per 2 SD increase, 95% CI 1.3 to 2.0, p<0.001; and commercial land use on the same block, OR=1.6 per 2 SD increase, 95% CI 1.2 to 2.0, p<0.001.
OR of block-level shootings in relation to alcohol outlet proximity
Discussion
Micro place matching identified control locations with strong similarities to case locations, in terms of physical layout (the intended matching characteristic) as well as additional potential confounders. Using these matches, logistic regression found substantially higher firearm assault risk associated with nearby AO presence, comparable in magnitude with the effects of large increases in nearby drug activity and commercial land use. These findings indicate that the risk of firearm violence incidence is higher in the area around AOs, even after accounting for differences in the physical and social environment surrounding those institutions. In other words, the association between AOs and elevated nearby violence cannot be explained solely by the types of spaces AOs tend to occupy.
The use of micro place matching strengthens the argument for a causal association between AOs and violence, specifically firearm violence. It is clear from prior research that violence rates are higher at locations very close to AOs, compared with locations slightly farther away. As Gmel and colleagues argue, these studies on the spatial influence of AOs provide the strongest available evidence that AOs cause violence, since the handful of available quasiexperiments, a better design for causal inference, have yielded mixed findings.6 However, spatial influence studies have generally done little to account for possible place-based confounders associated with the built environment.
Extracting information from satellite imagery, using machine learning, allowed the present study to impose greater controls on these factors. For example, vacant lots and street trees—variables that have been found to correlate with violence in Philadelphia in prior studies17–20—were not associated with shootings in the study model, indicating that micro place matching had successfully controlled for important environmental covariates. Strikingly, the same was found for income, suggesting that matching absorbed variation in complex phenomena that contribute to neighbourhood effects. (However, the proportion of nearby black residents was positively associated with shootings risk even after matching and other statistical adjustments, demonstrating that the structural drivers of racial disparities in exposure to urban firearm violence extend well beyond neighbourhood environments and household economic circumstances.28) Not only does the built environmental data derived from satellite imagery appear more useful than lists of georeferenced neighbourhood features, it may represent the only option in the majority of settings, since only a small subset of cities collects and publishes such lists, whereas satellite image coverage is ubiquitous.
Another advantage of micro place matching was to reduce model dependence. While one study on the spatial effects of AOs included statistical controls for built environment variables at the block level, these controls were implemented through parametric adjustment in a cohort design.14 Such a strategy requires questionable assumptions about the functional form of the relationship between each potential confounder (eg, the number of streetlights on a given block) and violence outcomes, a problem compounded by the large number of such inputs. While the current study still included linear covariate adjustment, the matching step reduces the impact of modelling assumptions like these.29
Finally, the computational strategies employed here do not require costly resources or extensive computer science expertise. Aerial imagery is widely accessible through providers such as Google Maps and other companies; many local governments regularly collect their own. VGG16, the computer vision algorithm used to obtain deep features here, is available as an ‘off the shelf’, pretrained model and can be implemented in about a dozen lines of code in Python or R. Similarly, t-SNE dimensionality reduction works readily off the shelf. Uploading imagery and conducting these calculations on a graphics processing unit-enabled computer required less than 3 hours of computing time, which could be obtained for a few dollars using a cloud computing service.
Limitations
As a cross-sectional design, the present study is more susceptible to confounding than longitudinal designs, even after micro place matching. For instance, neighbourhood-level demand for AOs is a possible confounder not addressed here. Instead, this analysis was intended to show that micro place matching could produce substantially better comparators than alternative approaches, given the other available data, and while cross-sectional designs have been used extensively in the study of AOs and violence, they are limited in their ability to support causal conclusions.
These findings from Philadelphia may not generalise to jurisdictions where privately owned, off-premises AOs can sell hard liquor. Additionally, the data and methods used here do not allow as precise an estimation of the spatial influence of AOs compared with studies that measured influence in terms of feet or metres. Since shootings were coded to blocks and not intersections, dictating blocks as the unit of analysis, AOs located at intersections were coded only to one block out of the multiple blocks they might have influenced approximately equally. Beer stores are commonly located on street corners, such that the distinction between their effects on ‘the same block’ versus neighbouring blocks is not especially meaningful here.
Moreover, the location of shootings in police data may include measurement error, especially for any shooting that occurred in a different location from where police found the victim. In the current design, random measurement error would tend to bias results towards the null, such that the findings here would underestimate the true effects of AOs. However, if victims tended to be identified at locations closer to AOs, then these findings could overestimate the true effects. Additionally, police incident data provide only a rough approximation of illegal drug activity, although one that has been endorsed elsewhere.8 30 Instead of measuring actual drug activity, the drug-related covariates may instead have measured police enforcement activity.
Using CNN-derived deep features for matching does not raise the same interpretability concerns as using these features as predictors, since their explanatory role is not the topic of study. Nonetheless, matching places on visual similarity might be even more persuasive if the approach allowed a more explicit description of the attributes on which locations were matched. Methodological innovations in computer vision could increase interpretability; in the meantime, researchers might choose to incorporate additional variables in the matching procedure.
Conclusions
Place-based matching is a foundational method in injury epidemiology. Matching places based on visual similarity, an innovation made possible by advances in imagery availability and machine learning, could help injury epidemiologists understand risks that vary across space. This approach demonstrates how ‘big data’ strategies can blend with traditional epidemiological methods to answer injury research questions.
What this study adds
Matching places based on how similar they look, using satellite imagery and machine learning, can be used to test associations that might otherwise be confounded by differences in the built environment.
For example, in Philadelphia, PA, this study found that firearm violence risk was higher in the immediate vicinity of alcohol outlets, even after controlling for possible differences in the built environment surrounding alcohol outlets.
What is already known on the subject
Many studies have found that a greater number of alcohol outlets in a given area is associated with higher rates of violence.
In particular, several studies have reported that violence is more likely to occur in the immediate vicinity of alcohol outlets, compared to locations farther away.
However, these studies have not typically accounted for attributes of the built environment around alcohol outlets that might contribute to elevated violence.
Acknowledgments
The author would like to thank Christopher Morrison, Jason Goldstick, John MacDonald and David Hemenway for their helpful comments on the project concept and manuscript.
References
Footnotes
Contributors JJ conceived the project, conducted the analyses and drafted the manuscript.
Funding This work has been supported by the Firearm-safety Among Children and Teens Consortium (NICHD 1R24HD087149-01A1).
Competing interests None declared.
Patient consent for publication Not required.
Ethics approval This article does not contain any studies with human participants or animals. The Harvard T.H. Chan School of Public Health institutional review board waived review of this study as non-human subjects research.
Provenance and peer review Not commissioned; externally peer reviewed.