Article Text

Abstract
Objective To describe the epidemiology of Guyana's road traffic injuries and perform the first geocoding of road traffic injuries in this setting.
Methods This was a registry-based retrospective cross-sectional study investigating collisions resulting in serious and fatal injuries. Police reports from two police divisions were used to identify victim, second party (ie, non-victim) and collision characteristics of all serious and fatal collisions between January 2012 and June 2015. Collisions with available location data were geocoded using Geographic Information Systems. Distributions of characteristics were compared for urban and rural areas. Multivariable logistic regression was used to assess variables associated with fatal collisions.
Results The study included 751 collisions, resulting in 1002 seriously or fatally injured victims. Fatally injured victims tended to be older, male and either pedestrians or cyclists. Fatal collisions tended to take place in rural areas, occur on weekends and involve speeding. Fifty-three per cent of fatalities occurred due to non-motorised road users being struck by motorised road users, and the most common fatal collision type was between pedestrians and motor vehicles (35%). The distribution of collisions was similar for urban (43.8%) and rural (56.2%) areas. Fatal collisions were more likely to occur in rural settings.
Conclusions Road traffic injuries pose a considerable public health burden in Guyana. These results suggest a pattern of high mortality in rural collisions and a disproportionate burden of injuries on vulnerable road users. The spatial distribution of collisions should be considered in order to target interventions and improve road traffic safety.
Statistics from Altmetric.com
Introduction
More than 1.2 million people die annually from road traffic injuries (RTIs). Low-income and middle-income countries (LMICs), which, despite having 52% of the world's vehicles, experience 90% of all road traffic fatalities.1 Global data suggest that for every fatal RTI at least 20 people suffer non-fatal injuries, many of which are permanently disabling.2 Few LMICs have incorporated pedestrian safety measures into city development, meaning much of the population is increasingly exposed to dangerous traffic situations.3–5 Vulnerable road users, or those who are slow-moving, exposed or unprotected, compose a far greater proportion of fatal RTIs in LMICs than high-income countries. Pedestrians make up 45% of fatal RTIs in the poorest countries compared with 18% in high-income countries,6 and fragile and hazardous modes of motorised transportation, such as motorcycles, are more often used in LMICs.1 Poorly designed roads, limited traffic law enforcement, a high rate of speeding, inadequate vehicle maintenance and alcohol abuse are among other factors thought to contribute to the high RTI burden in LMICs.7–9 Furthermore, the majority of RTI fatalities in low/middle-income countries occur in the prehospital setting, and many of these countries lack functioning prehospital emergency medical services.10
RTIs represent a considerable public health concern for Guyana, an LMIC11 ,12 composed of roughly 750 000 people experiencing rapid motorisation and social migration to urban areas.13 Historically, Guyana has possessed one of the highest road traffic fatality rates in the Americas.14 Estimates accounting for under-reporting set Guyana's 2010 road traffic fatality rate at 27.8 per 100 000 compared with 10.6 per 100 000 for the USA.15
Specific causes and contributing factors to Guyana's disproportionately high road traffic fatality rates have not been identified, and organised RTI data have not previously been collected or evaluated. The visualisation of such RTI data allows for a qualitative assessment of the distribution of collisions. Therefore, the objectives of this observational study were to (1) identify collision-level and victim-level factors associated with fatalities and (2) perform the first geocoding of fatal and serious RTIs in Guyana.
Methods
Study setting and population
This retrospective cross-sectional study was conducted using police report data collected from two police divisions in the Demerara-Mahaica and Mahaica-Berbice regions of Guyana. These regions encompass Georgetown, Guyana's capital city of >250 000 people, and the populous costal region immediately to the east. Our data set included all reported fatal or serious casualties between January 2012 and June 2015. When discussing the results, references to ‘collisions’ imply those collisions in which at least one serious or fatal injury occurred.
A serious injury was defined as any injury that resulted in hospitalisation but not death within 30 days from the incident, while fatality was defined as any injury that resulted in death within 30 days from the incident. Records of hospitalisation and death are routinely obtained by the police for use in court proceedings. We extracted information about the location, type of collision, victim(s) and other involved parties (eg, age, sex), vehicle(s) involved, potential contributing factors (eg, alcohol tests, road conditions, alleged speeding, visibility at the time of the incident) and setting (ie, urban vs rural).
Statistical analysis
Summary statistics for victim-level characteristics were computed as frequencies and percentages, stratified by injury severity. We used a binary logistic regression model with fatal injury as the outcome and age (comparison of a 10-year difference between any two ages), sex, mode of transport (pedestrian, bicycle, motorcycle, large vehicle, small vehicle), setting (urban, rural), reported speeding, reported hit-and-run phenomena, time of day (morning, afternoon, evening, night) and time of week (weekend, weekday) as independent variables. Small vehicles were defined as privately owned two-door and four-door passenger motorcars or motorcars registered as taxis. Large vehicles were defined as minibuses, jeeps, motor lorries, pickups and tractors. Speeding data were recorded according to police evaluation at the scene of the collision.
The margin of error between serious and fatal injuries may be narrow in some instances and may be determined by factors during the actual event. However, there are characteristics about the location, individuals involved and situational circumstances that may be used to identify patterns to assess where and which people are being impacted most severely. We selected model covariates using an a priori approach. There was no effect modification by environment, age or sex using a threshold of p<0.10. Because each collision had multiple victims included in the data, we used a robust cluster sandwich covariance estimator with the collision ID as a cluster in order to adjust the variance in our model to account for these repeated measurements. Analyses were performed in Stata (StataCorp. 2013. Stata Statistical Software: Release 13. College Station, Texas, USA: StataCorp LP) and R (R Core Team. 2013. R: A language and environment for statistical computing. R Foundation for Statistical Computing, Vienna, Austria).
Geocoding
While all urban and rural RTIs were included in the basic descriptive analyses, geocoding necessitated the development of uniform location criteria within each setting. For urban RTIs, all collisions were geocoded to the exact location (ie, intersection or location along a street) described in the police reports when possible. Urban collisions occurring at intersections were geocoded to the centerpoint of the intersection, and reports without crossroads or exact locational data were excluded from geocoding. Because the majority of police reports for rural RTIs included only a single segment of road, the entire road segment was geocoded as the collision location. For the few police reports that provided pinpoint location data for rural RTIs, we converted the pinpoint location into the appropriate road segment location for consistency. Mapping analyses were conducted using ArcGIS V.10.3 (ESRI, Redlands, California, USA).
Results
Between 2012 and 2015, 751 separate collisions resulted in 1002 serious or fatal RTI victims in the two police precincts encompassing Georgetown and the surrounding area. Victims with fatal injuries tended to be older, male, pedestrians or cyclists (table 1). Fatal collisions occurred more frequently in rural settings, involved speeding more frequently and more often occurred on weekends. Fifty-three per cent of fatalities occurred due to non-motorised road users being struck by motorised road users, and the most common fatal collision type was pedestrian versus motor vehicle (35%).
Victim characteristics (N=1002 victims)
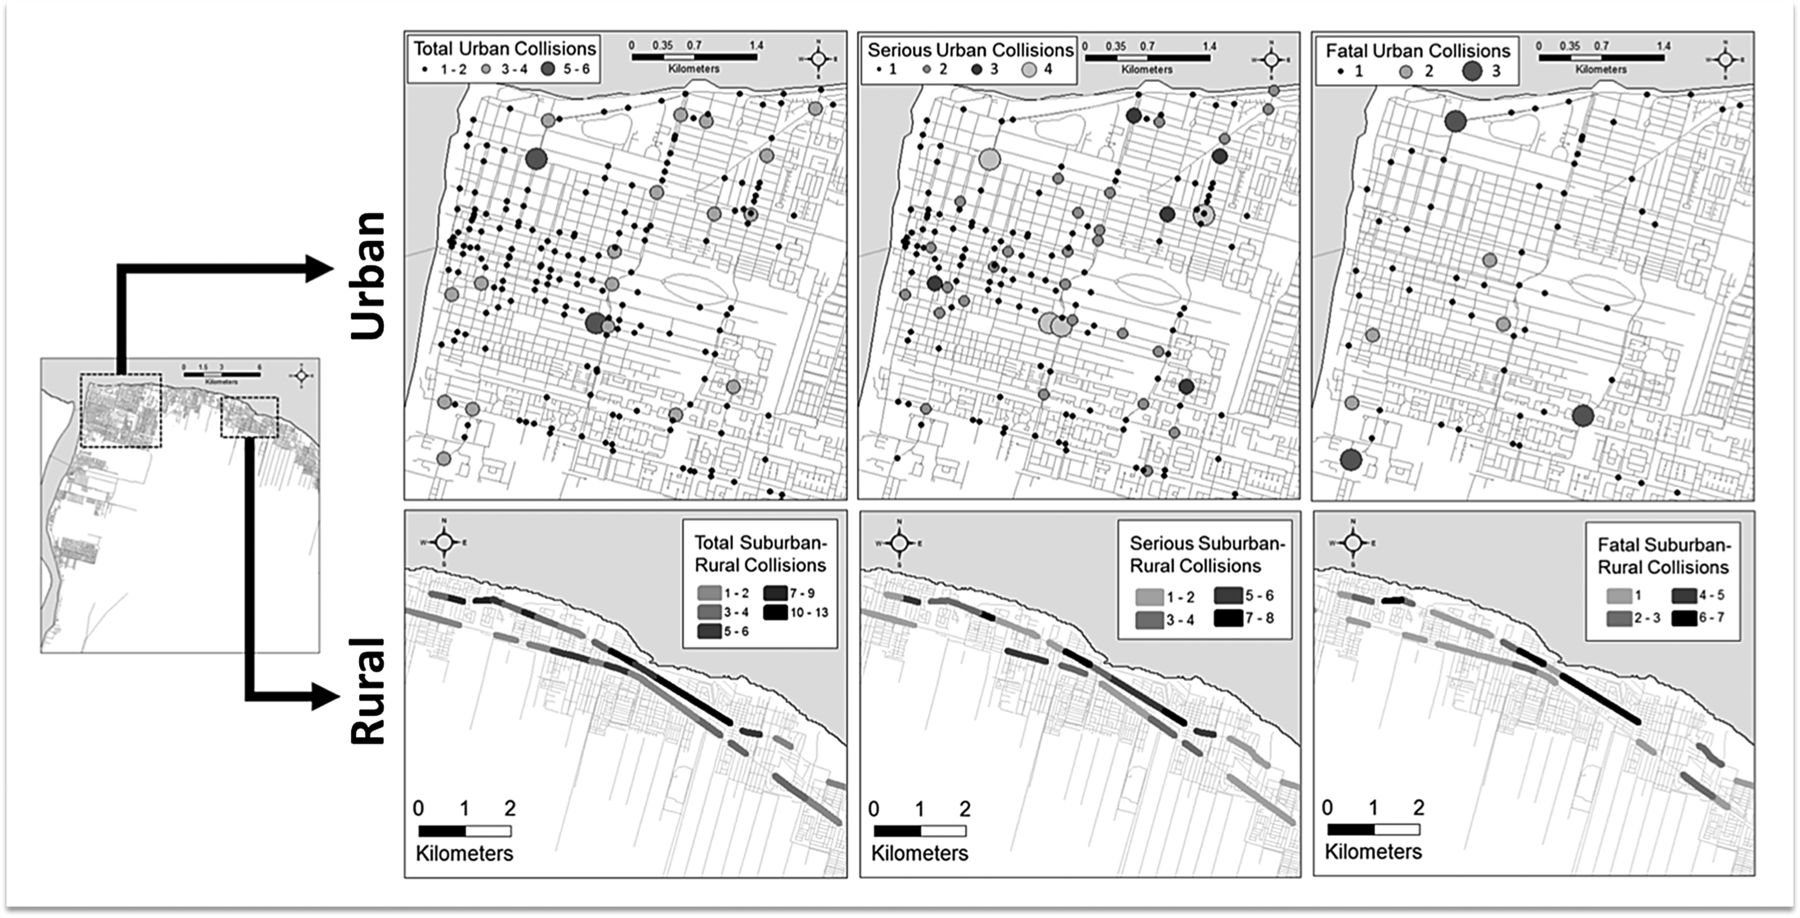
Over the study period, various RTI locations experienced multiple similar collisions. Figure 1 shows the distribution of RTIs separated by setting in Georgetown and its surrounding environs. The distribution of collisions was similar for urban (43.8%) and rural (56.2%) settings, but these distributions do not account for road traffic exposure and should not be interpreted as prevalence measures. Twenty-nine (8%) urban collision reports were excluded from geocoding due to incomplete data failing to provide pinpoint location data. No rural collisions were excluded from geocoding. The lengths of rural road segments are variable based on the geographical size of the village through which the road travels. The majority of villages, and thus the geocoded road segments, were 0.3–0.5 km in length. Hit-and-run phenomena were included as a model variable because these collisions tend to be more fatal and involve the use of alcohol,16 although our study did not support this finding.

Forest plot of ORs (and 95% CIs) for factors associated with collisions with fatality versus collisions with serious injury. An OR >1 indicates a greater risk of fatality.
In multivariable analysis (figure 2), male sex (OR 1.82, 95% CI 1.18 to 2.81) and older age (OR 1.22, 95% CI 1.11 to 1.34) were both significantly associated with fatal injury. Pedestrians were nearly four times more likely to be fatally injured compared with occupants in large vehicles (exact OR 3.61, 95% CI 1.98 to 6.59). Cyclists were also more likely to be fatally injured (OR 2.93, 95% CI 1.50 to 5.73). Occupants in smaller, passenger vehicles were slightly but significantly more likely to be fatally injured than large vehicle occupants (OR 2.15, 95% CI 1.04 to 4.43). Fatal collisions were more likely to occur in rural areas (OR 2.27, 95% CI 1.58 to 3.27). Collisions involving speeding and occurring on weekends were associated with fatal injuries; however, these differences were not statistically significant. The ORs of age distributions varied by mode of transportation (p=0.016; see figure 3) but not by sex (p=0.676).

Plot showing the variation of ORs of age distributions by mode of transportation (p=0.016).

Map showing the location of collisions from a sample region of the study area. Urban collisions are represented by graduated circles, while rural collisions are represented by road segment density.
Discussion
In this observational study of 751 collisions among 1002 victims occurring over a 3-year time period in Guyana, we found that road traffic fatalities were positively associated with the following victim characteristics: male sex, increasing age and the victim being a pedestrian, bicyclist or small vehicle occupant. Fatal RTIs were also positively associated with the collision occurring in a rural setting. Over 48% of Guyana's population claims residence in one of the two precincts represented in the study.13 To our knowledge, this was the first study to geocode RTIs and collisions in Guyana.
Vulnerable road users
Pedestrians and cyclists were at higher risk of sustaining fatal injuries in both urban and rural collisions, and these road users represented 63.5% of the fatally injured victims. This finding is unsurprising considering the vulnerability of these groups to fatal injuries, and the distribution of deaths among road user groups is similar to other countries in the region and other LMICs.6 ,17–23
Much of Guyana's roadway infrastructure fails to segregate road users by speed, especially in rural areas. Pedestrians and cyclists share the same road space as motorised users, often without delineation of where the roadway ends and the paved road shoulder begins. Studies suggest that protecting vulnerable road users cannot be accomplished by the encouragement of safe walking practices alone and may require the physical separation of vulnerable road users from motor vehicles.15 In addition, it is standard practice for public transportation services to drop off passengers directly onto the roadway. Often these passengers cross in front of and behind the bus, where other drivers cannot easily see them preparing to cross. All bus stops in rural settings are located directly on the side of the road as there are no dedicated roadway sections for bus services. It is possible that this may explain why pedestrians are involved in 35% of rural collisions. The vulnerability of pedestrians and cyclists highlights the need for targeted prevention efforts.
Countries like Guyana could consider a handful of vulnerable road user RTI countermeasures, especially for pedestrians. Several European countries have chosen to invest heavily in traffic and pedestrian safety education through longitudinal school programmes for children while other governments have invested in road safety marketing campaigns. Some rapidly developing countries, such as China and India, have devoted resources to roadway design and engineering treatments such as low-speed street design (eg, speed bumps), raised sidewalks and crosswalks, or pedestrian barrier construction.24 Interventions from several LMICs have proven that helmet and seatbelt legislation and enforcement have reduced fatalities among motorcyclists and vehicle occupants.25
The burden within rural settings
During the study period, more collisions in rural areas involved fatalities (41%) compared with urban areas (23%). Fifty-six per cent of all collisions occurred in a rural setting, representing 59% of all RTI victims. Similar data from other countries, such as the USA and India, show that collision fatality rates are higher in rural areas.26 ,27 Reasons for this environmental discrepancy in Guyana may include increased speeds on rural roads, lack of separation of the different modes of traffic and decreased visibility in the dark. Other contributing factors cited in LMICs include the higher risk of head-on collisions due to the absence of separating directions of traffic, livestock on the road, lack of guardrails and roads in disrepair,15 all of which could also apply to Guyana. In addition, as vehicle speed increases, vulnerable road users' risk of death increases, further compounding fatality risk in rural environments. An adult pedestrian struck by a vehicle at <50 km/hour has less than a 20% change of dying but almost a 60% risk of dying if hit at 80 km/hour.27 Postcrash reasons for the increased rural fatality burden may include longer response times from Emergency Medical Services (EMS) and greater distances from healthcare facilities with trauma response capabilities. Cited reasons from other LMICs include intercity bus crashes; however, in Guyana, bus size is generally limited to minibuses.15
The road infrastructure in Guyana, particularly in rural areas, has limited or no facilities available to support pedestrian and cyclist travel and reduced exposure to motor vehicles (eg, sidewalks or safe crossing areas). Guyana has no urban highways, and only two roadways in urban Georgetown have the potential for a maintained speed >50 km/hour. Three major two-lane roadways emanating from urban Georgetown define the rural driving environment: one highway to the south and two parallel highways to the east. These are the only rural roadways in which maintained high-speed traffic can exist in the study area. These infrastructure realities, along with Guyana's disproportionately higher number of rural fatalities, place the sharpest focus for RTI prevention in the rural environment. Focusing intervention efforts here is not without its challenges as the areas are vast, the rural data lack spatial precision and the causes of rural RTIs are multifactorial. An in-depth examination of rural transport in Guyana is needed to better guide potential interventions.
Spatial dimensions
An important message for authorities from this study is that Guyana's RTIs have a spatial dimension. The Geographic Information Systems (GIS) maps created from this study are useful for identifying potential concerning RTI locations, which can aid in the development of spatially targeted prevention initiatives. Future investigation is warranted to better understand the distribution and contributing factors of these collisions and whether the collision distribution differs systematically by various driving environments. While the epidemiology of road injuries in small countries like Guyana has not been studied as frequently as larger LMICs (eg, China, India, Mexico), our findings demonstrate that understanding the spatial distribution of RTIs in smaller countries is both feasible and important, especially considering the patterns of fatal injury to vulnerable road users. These spatial findings have the potential to influence policy while highlighting the need for targeted infrastructure upgrades.
Study limitations
This study has a number of limitations. Police reports are not always ideal sources of retrospective research data due to discrepant data collection priorities and methods.14 Studies have shown that police statistics often under-report RTIs in LMICs.28 In Guyana, the quality and content of the handwritten police reports varied by reporting police officer, police precinct and police station. The sensitivity and specificity of police reports for collision characteristics such as the involvement of alcohol and speeding are not known. This retrospective study was not designed to formally assess for potential gaps in the flow of RTI data within the police or other governmental agencies. At present, police reports are the only available sources of reliable information on RTIs in Guyana; however, the Guyana Police Force is currently developing an electronic data collection system that should lead to more robust data sources. Our analysis did not include environmental features, such as speed limits, signage or lighting.
Another limitation is the likely under-reporting of speeding and alcohol use. According to police reports, only 1% of urban and 11% of rural collisions involved speeding. The presence of speeding was determined by the judgement of the police officer at the scene, and radar speed devices are not widely available for use. The OR for fatality with police-reported speeding was 1.59. Despite being non-significant, this point estimate suggests that there may be an important relationship. Similarly, only 2% of urban and 5% of rural collisions involved alcohol, according to police reports. Police are not routinely equipped with breathalysers, and hospitals do not routinely analyse blood alcohol levels (personal correspondence).
A 3-year period has been suggested as the ideal study period for traffic analysis because it helps ensure circumstances such as road environment and traffic volume are stable.29 ,30 Only serious and fatal RTIs were included in this study. This allowed the mapping of the sites of the collisions with the most severe outcomes, but it did not allow the analysis of non-serious injuries (ie, not requiring hospital admission).
A major limitation of the police reports was the poor spatial precision of location data for rural RTIs. Urban RTI reports consistently included pinpoint location data, while rural RTI reports only provided the name of the village in which the collision occurred, necessitating a village-level road segment geocoding strategy. Future use of police-operated GPS systems would allow for precise rural RTI location data.
Recommendations
Despite the described limitations, the data suggest several areas to focus prevention efforts in Guyana. Though the data lack adequate alcohol use figures, prior government-funded studies show that alcohol use is prevalent, especially among young males. Notably, 21% of rural crashes were single-party, stand-alone crashes by either motorcycles or motor vehicles, and two-thirds of these were after dark. For comparison, single-party, stand-alone crashes accounted for only 7% or urban crashes. Factors known to be associated with single-party crashes include speeding and alcohol use.31 Guyana's police regularly organise alcohol checkpoints on urban roadways; however, this practice is less used on roadways in the rural setting. Liquor store and rum shop owners may need to be enlisted as advocates for safer driving practices. Increased fines and harsher consequences may also deter individuals from drinking and driving. Speed reduction measures such as speed bumps near villages and straightaways are interventions shown to have a strong protective effect on pedestrian safety.32 ,33 Because pedestrians experience such high risk of injury in Guyana, previously mentioned measures aimed at reducing risk to pedestrians are warranted.
A Guyanese EMS system is nascent but has plans to be national in the next few years. Newly developed physician residency programmes in both Emergency Medicine and General Surgery are improving medical care access, and these services are progressively expanding to regional centres.34 Still, improved EMS coordination and trauma care are needed in rural settings.
Improved data collection and reporting methods would lead to more robust sources of RTI data needed for research. Information that is feasible to collect and report includes helmet use, road conditions (eg, lighting, paved vs unpaved), weather conditions (eg, active rain), presence of a tyre blowout, whether EMS was called, whether EMS arrived, alcohol involvement and whether the victim arrived at the hospital alive. Correlating police data with hospital-level data, vital registration records and insurance data would allow superior injury-specific analyses.35
Conclusions
This study suggests a pattern of high mortality in rural collisions and a disproportionate burden of injury on vulnerable road users in Guyana. These findings are consistent with published data from other LMICs. However, Guyana presents unique challenges and opportunities for injury prevention, and more precise data should be collected to support prevention and mitigation efforts.
What is already known on the subject?
Road traffic injuries (RTIs) are a significant cause of death and disability in Guyana.
Vulnerable road users (ie, pedestrians, cyclists and motorcyclists) are at highest risk of sustaining injuries in road traffic collisions.
What this study adds?
Guyana's RTI profile shows high mortality in rural collisions and a disproportionate burden on vulnerable road users.
The first study to geocode RTIs and collisions in Guyana.
Acknowledgments
We thank Edgar Thomas and the entire Guyana Police Force for allowing and facilitating this study. Dr Tracey Bovel, GPHC A&E faculty, helped connect this study with the work of the Guyana National Road Safety Council. Dr Carlos Grijalva provided helpful insight on road traffic incidents in Latin America and assistance contacting key individuals.
References
Footnotes
Contributors All authors contributed to manuscript writing and gave final approval for publication. CMM, DAQ, NPF and ZB: conception and design. CMM, MAM and ZB: acquisition of data. LW, CDM, DAQ, CMM and NPF: analysis and interpretation. MAM: GIS spatial analysis and visualisation.
Funding The project described was supported by the National Center for Research Resources, Grant UL1 RR024975-01, and is now at the National Center for Advancing Translational Sciences, Grant 2 UL1 TR000445-06. The work was also supported in part by CTSA award No. UL1TR000445 from the National Center for Advancing Translational Sciences and by K23HL125670 from the National Heart, Lung, and Blood Institute. The travel expenses for this project were supported by the Nichols Humanitarian Fund of Vanderbilt University and scholarships from the Vanderbilt Institute for Global Health.
Disclaimer The content is solely the responsibility of the authors and does not necessarily represent the official views of the NIH or National Center for Advancing Translational Sciences.
Competing interests None declared.
Ethics approval : The study was approved by both the Vanderbilt University IRB (#150588) and the Guyanese Ministry of Health Ethics Review Committee.
Provenance and peer review Not commissioned; externally peer reviewed.
Data sharing statement Raw data are securely kept with the first author of the study.