Article Text

Abstract
Background This study examined the impact of transportation infrastructure at intersection and non-intersection locations on bicycling injury risk.
Methods In Vancouver and Toronto, we studied adult cyclists who were injured and treated at a hospital emergency department. A case–crossover design compared the infrastructure of injury and control sites within each injured bicyclist's route. Intersection injury sites (N=210) were compared to randomly selected intersection control sites (N=272). Non-intersection injury sites (N=478) were compared to randomly selected non-intersection control sites (N=801).
Results At intersections, the types of routes meeting and the intersection design influenced safety. Intersections of two local streets (no demarcated traffic lanes) had approximately one-fifth the risk (adjusted OR 0.19, 95% CI 0.05 to 0.66) of intersections of two major streets (more than two traffic lanes). Motor vehicle speeds less than 30 km/h also reduced risk (adjusted OR 0.52, 95% CI 0.29 to 0.92). Traffic circles (small roundabouts) on local streets increased the risk of these otherwise safe intersections (adjusted OR 7.98, 95% CI 1.79 to 35.6). At non-intersection locations, very low risks were found for cycle tracks (bike lanes physically separated from motor vehicle traffic; adjusted OR 0.05, 95% CI 0.01 to 0.59) and local streets with diverters that reduce motor vehicle traffic (adjusted OR 0.04, 95% CI 0.003 to 0.60). Downhill grades increased risks at both intersections and non-intersections.
Conclusions These results provide guidance for transportation planners and engineers: at local street intersections, traditional stops are safer than traffic circles, and at non-intersections, cycle tracks alongside major streets and traffic diversion from local streets are safer than no bicycle infrastructure.
This is an open-access article distributed under the terms of the Creative Commons Attribution Non-commercial License, which permits use, distribution, and reproduction in any medium, provided the original work is properly cited, the use is non commercial and is otherwise in compliance with the license. See: http://creativecommons.org/licenses/by-nc/3.0/ and http://creativecommons.org/licenses/by-nc/3.0/legalcode
Statistics from Altmetric.com
Introduction
Despite many potential health benefits of cycling1–4 as an active transportation mode, safety concerns deter people from cycling in North America.5 Injury data from the USA suggest these concerns are valid: Beck et al6 found that cyclists there were at greater risk of both fatal and non-fatal injuries than motor vehicle occupants. However, cycling injury risk could be much lower, as shown by continental differences in cycling safety. Canadian and American cyclists are two to six times more likely to be killed while cycling than Danish or Dutch cyclists7 ,8 and American cyclists are eight to 30 times more likely to be seriously injured than cyclists in Germany, Denmark and The Netherlands.9
Road infrastructure that separates motor vehicles from bicycles is prevalent in the cycling countries of northern Europe but not in North America, which could explain some of the observed difference in cycling safety.4 ,5 We reviewed the evidence on route infrastructure and injury risk,6 and found evidence that bicycle-specific infrastructure (eg, bike routes, painted bike lanes and off-road bike paths) was associated with the lowest injury risks, that sidewalks and multi-use trails were associated with higher risks, and that major roads had higher risks than minor or local roads. At intersections, roundabouts, higher vehicle volumes and multiple vehicle and turning lanes were associated with higher risks. However, the evidence on infrastructure and injuries remains sparse and faces challenges that have rendered conclusions difficult and often controversial. Many studies have unclear route definitions, broad route groupings and insufficient adjustment for exposure to risk and confounders.
We conducted a case–crossover study in the Canadian cities of Vancouver and Toronto10 to examine the influence of infrastructure on injury risk, while ensuring strict control for denominators (ie, exposure to risk, cyclist traffic volume) and for personal and trip characteristics (eg, propensity for risk-taking, time of day). The study design included two main sets of analyses. The first set, reported elsewhere,11 compared injury sites to randomly selected control sites of any type, and showed that bicycle-specific route infrastructure was associated with decreased injury risk, providing more detailed support to previous findings.12 ,13
This paper presents the second set of analyses. It examines intersections and non-intersections separately to assess the distinct features of each, and to determine if the impact of infrastructure differed at these two location types.14 To do this, we used control sites matched to injury sites based on intersection status.
Methods
The study was conducted in the cities of Toronto and Vancouver, Canada, where the proportions of trips to work by bicycle were 1.7% and 3.7% in 2006, respectively, according the 2006 Canadian Census. Toronto has a population of approximately 2.5 million, an area of 630 km2, snowy winter weather and warm summer weather, and Vancouver has a population of approximately 0.6 million, an area of 115 km2, rainy winter weather and mild summer weather. At the time of the study, both cities had the cycling infrastructure most common in North American cities, mainly local street bikeways, off-street paths and painted bike lanes (∼400–500 km in each city). The following were differences in cycling-related circumstances between the cities: Toronto had streetcar tracks on many major streets and Vancouver was subject to a helmet law for adults, had traffic circles at some local street intersections, and had cycle tracks alongside a few major or minor streets (see route infrastructure definitions, table 1).
Definitions of route types and bicycling infrastructure, and selected characteristics as observed at the randomly selected study control sites
We conducted a case–crossover study,10 ,15 a design that uses injured participants as their own controls, well suited to studies of the effects of transient exposures (eg, varying infrastructure along a cycling trip) on acute events (eg, injury). Comparisons within individuals and trips are fully controlled for personal factors (eg, age, sex, cycling experience) and trip characteristics (eg, weather, bike type, safety equipment use).10 ,15 Our overall design is described in detail elsewhere.10 ,11
The study population included injured cyclists aged 19 years and over who were treated at emergency departments at study hospitals in Vancouver (St Paul's, Vancouver General) or Toronto (St Michael's, Toronto General, Toronto Western) between 18 May 2008 and 30 November 2009. Canadian hospitals are publicly funded so those injured and seeking emergency treatment in the catchment areas (the cities’ urban cores) are likely to present to one of the study hospitals. All study hospitals were university affiliated, and one regional tertiary trauma centre was included in each city. Injured cyclists were identified on intake as having been injured in a cycling crash. Hospital research staff reviewed intake records at least weekly, then relayed contact information to the study coordinators in their respective city. Introductory letters were sent to all potential participants, followed by a phone call from the study coordinator to invite participation and screen for eligibility. Up to 10 contact attempts per injured bicyclist were made over 3 months following the injuries. We excluded cyclists who were:
-
Injured outside of Toronto or Vancouver or did not reside in the study cities (the geographical areas were the postal definition of the cities themselves, and did not include the surrounding metropolitan municipalities).
-
Unable to participate in an interview (fatally injured, injured too seriously to communicate, could not speak English, or unable to remember the trip).
-
Injured while trick riding, racing, mountain biking, participating in a critical mass ride, or while on private property.
-
Injured while riding a motorised bike (eg, electric scooter or pedal-assisted e-bike), unicycle or tandem bike.
-
Already enrolled in the study due to a previous injury.
The study design and recruitment protocol were evaluated and approved by research ethics boards at the universities of British Columbia and Toronto and each participating hospital.
Eligible participants were interviewed in person as soon after the injury as possible to maximise recall. The structured questionnaire16 took 25–45 min to complete. The interviewers collected data on characteristics of the trip (eg, weather conditions, time of day, clothing worn, helmet use, etc) and of the cyclist (age, sex, education, income, cycling experience), although these were not required as adjustment factors in the analysis due to the crossover design. Characteristics of the injury and control sites, described below, were also documented (eg, presence of construction, where the cyclist was riding at the time—eg, on the sidewalk or the street, which lane or side of street).
Participants traced their trip route on a city map (scale 1 : 31 250) and indicated the injury site. The interviewer used a map wheel (Calculated Industries ScaleMaster 6020 Classic, Carson City, Nevada, USA) to determine the trip distance. Control sites on the same route were identified by multiplying a randomly generated proportion (MS Excel, Microsoft, Redmond, Washington, USA) by the trip distance, then tracing the resulting distance along the route using the map wheel. One control site was deliberately matched to the intersection status of the injury site, by adjusting it forward or back (even or odd random number, respectively) along the route until it matched. The other control site was selected in the same way, except without matching on intersection status. These unmatched sites were used in the first set of study analyses, reported earlier,11 but as some of them did match the injury site on intersection status by chance alone, we were able to include them as additional controls in this analysis to augment statistical power.
Trained observers completed a site observation form17 developed for the study in consultation with transportation engineering personnel. The form was pretested for feasibility, detail and clarity at 16 sites, revised, then tested for intra-observer reliability at 25 sites, reported elsewhere.11 The observers were blinded to the injury or control status of the sites. Observations were timed to match the time of day of the injury trip (weekday vs weekend; morning rush, mid-day, afternoon rush, evening, night). The observation form recorded information at the location of the cyclist at each site and considered the cyclist's direction of travel. Observations included the characteristics of the routes and intersecting streets, the presence of cycling infrastructure (eg, bike lanes, cycle tracks, signage), presence and type of intersection (eg, two-way stop, four-way stop, stoplight, traffic circle), streetcar tracks and street lighting. Measurements included surface grade (measured using a Suunto PM-5 clinometer, Vantaa, Finland), distance visible along the direction of travel (measured using a Rolatape Measure Master MM-12 trundle wheel, Watseka, Illinois, USA), counts of motor vehicle, cyclist and/or pedestrian traffic volume in 5 min in both directions and average motor vehicle traffic speed (five vehicles measured at normal traffic speeds, ie, not as they were accelerating from or decelerating to a stop, using a Bushnell Velocity Speed Gun, Overland Park, Kansas, USA).
Separate analyses were performed to evaluate the effects of infrastructure (table 1) in crashes occurring at intersections and non-intersections. Conditional logistic regression with one or two control sites per injury site was used to estimate associations between injury and infrastructural characteristics. The dependent variable was binary (1=injury site or 0=control site), and OR were calculated using the following model: 1where πij is the probability of injury for the ith subject and jth site, given the covariates xij1, xij2, …, xijp. i=1, …, N; j=1, …, ni. N is the number of subjects; ni=2 if there was one injury site and one control site and ni=3 if there was one injury site and two control sites; and p is the number of covariates.
Independent variables including route types and bicycling infrastructure were defined (table 1) with the help of city transportation engineering personnel. Most infrastructure variables offered in the models were the same for intersection and non-intersection analyses. For intersections, two additional design variables were offered: the route types meeting at the intersections and the type of intersection control. Initial analyses tested the effects of each variable in simple bivariate models. Two final multiple logistic regression models (one for intersections and one for non-intersections) were constructed using backwards selection, starting by offering all variables of interest. The variable with the highest p value (Wald test) was removed and the model refit with the remaining variables until all variables were statistically significant (p<0.05). Analyses were performed with SAS V.9.2.
Results
Participants and trips
Of 2335 injured cyclists who were treated at a study emergency department during the study period, 927 were ineligible, 741 were eligible and 690 agreed to participate (414 from Vancouver and 276 from Toronto). There were 667 with unknown eligibility, including 124 refusals and 543 not contacted (because of incorrect phone numbers or addresses, or no response with repeated phone calls within 3 months). Participants represented 93.1% of those confirmed to be eligible and 66.5% of those estimated to be eligible (based on the proportion eligible among those contacted).11 Common reasons for ineligibility were not being a resident of the study city or being injured outside the city. A complete accounting of participation is included as a supplemental figure in an earlier paper.11
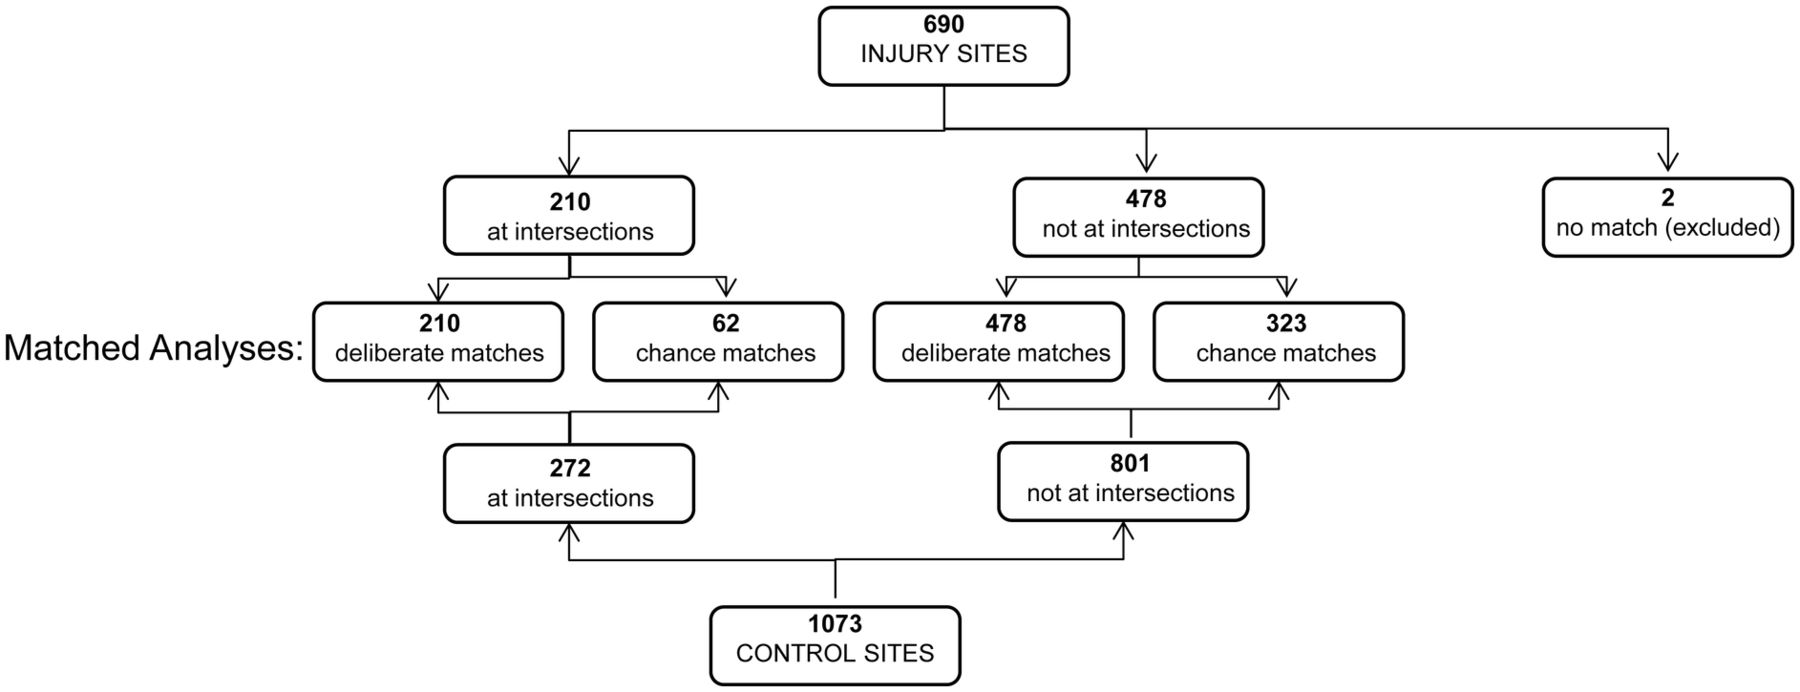
Of the 690 participants, 211 were injured at intersections and 479 at non-intersection sites. No matched control site was selected for one person injured at an intersection and one injured at a non-intersection, so these cases were excluded from the analyses. The 210 intersection injury sites were matched to 272 control sites (210 matched deliberately and 62 matched by chance). The 478 non-intersection injury sites were matched to 801 control sites (478 deliberately and 323 by chance). This matching process is illustrated in figure 1.

Process by which injury and control sites were matched based on whether injuries occurred at intersections or not in a case–crossover study conducted in Vancouver and Toronto (Canada).
Injuries at intersections
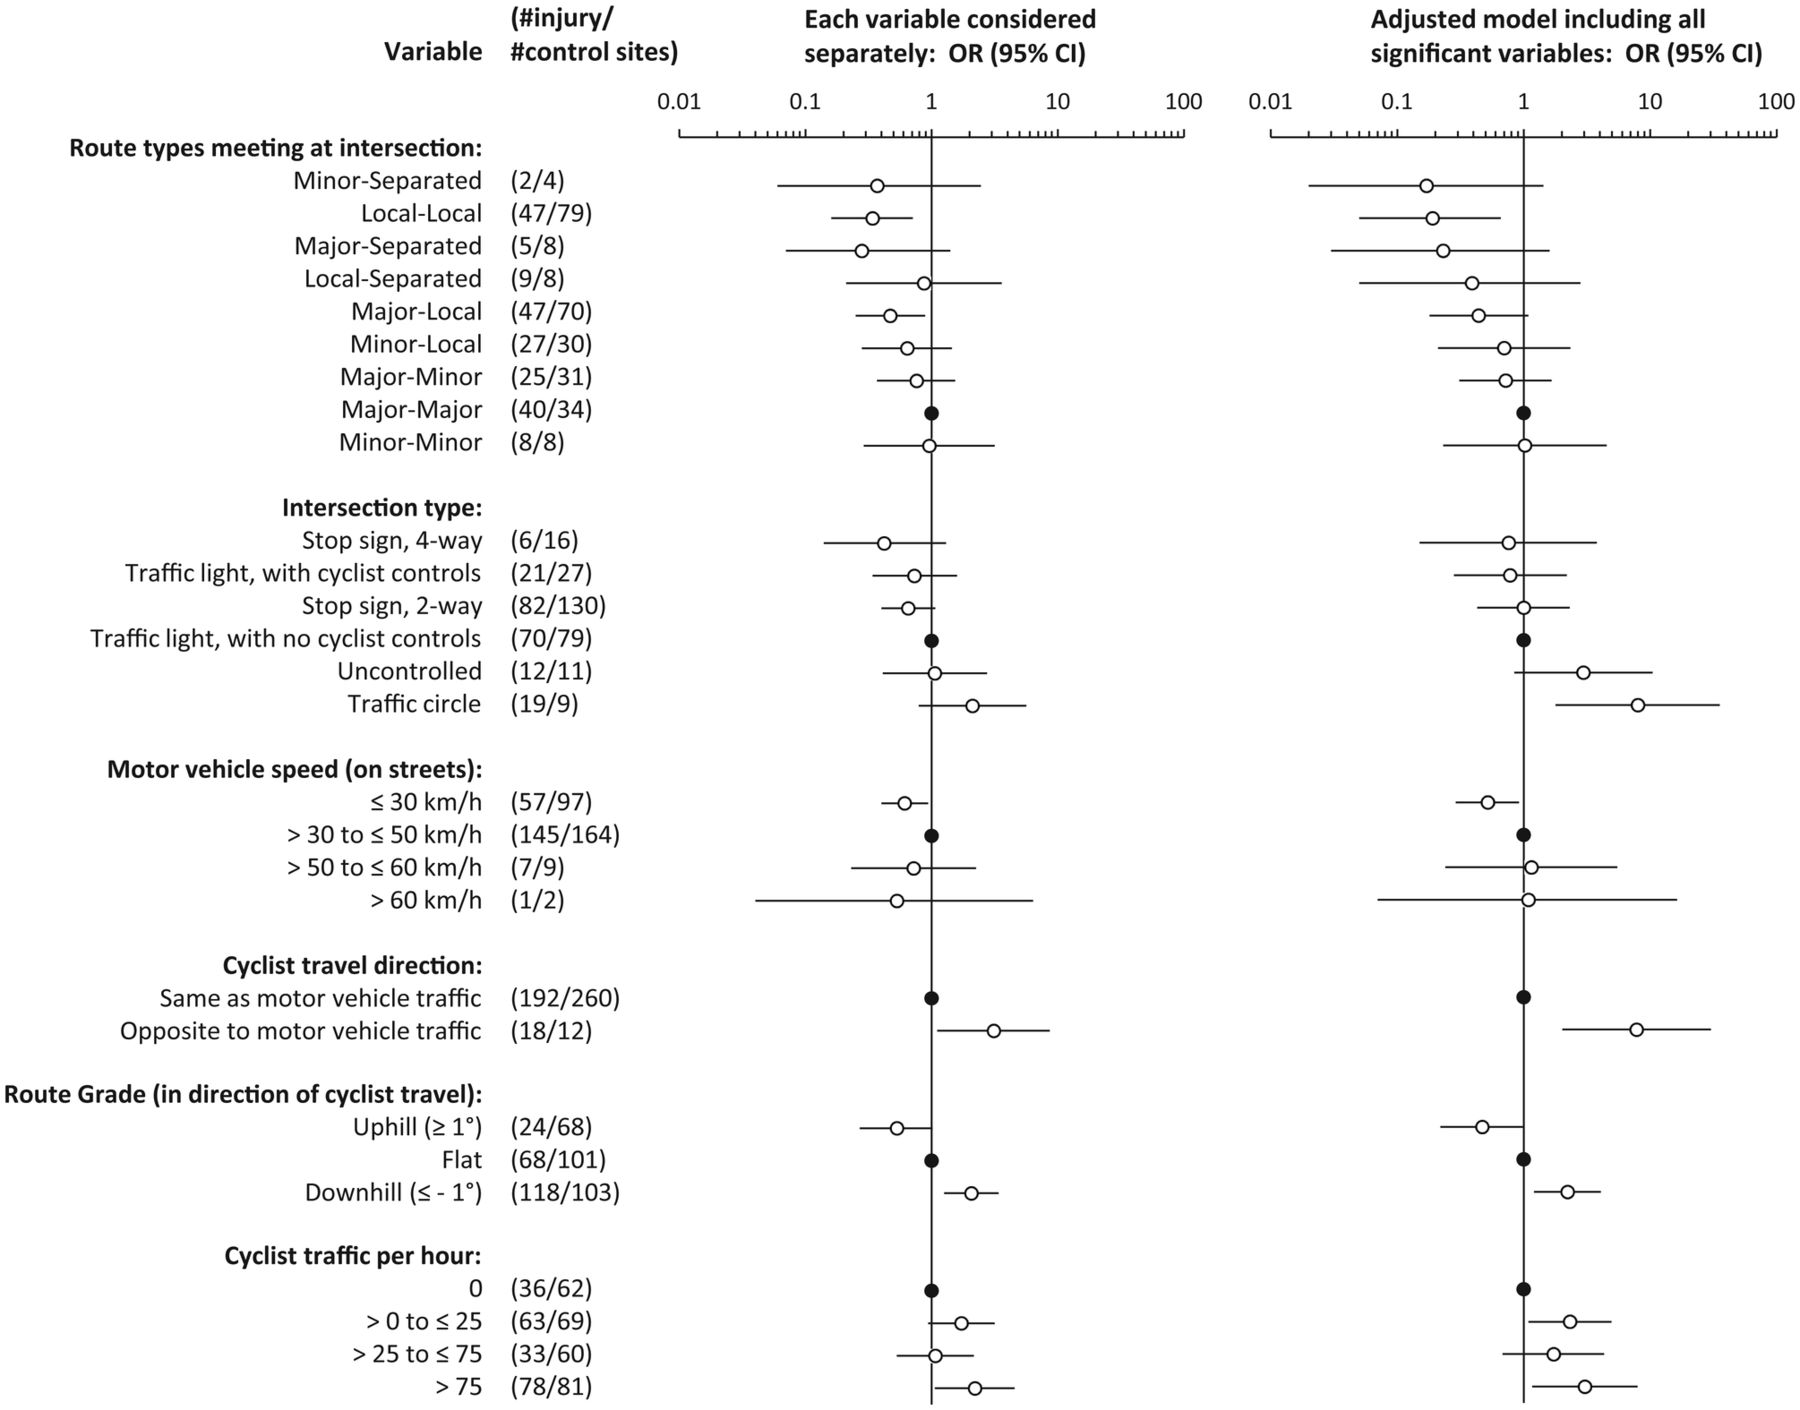
The unadjusted and adjusted associations of all variables that were included in the final model of intersection characteristics and bicycling injury are shown in figure 2. Compared to intersections of two major streets, intersections of two local streets were associated with significantly lower odds of injury (adjusted OR 0.19, 95% CI 0.05 to 0.66). Intersection type was associated with injury, with the highest risk noted for traffic circles, a relationship that was strengthened and became significant after adjustment for other variables (adjusted OR 7.98, 95% CI 1.79 to 35.6). Compared to motor vehicle speeds of 31–50 km/h, speeds below 30 km/h were associated with lower cycling injury risk (adjusted OR 0.52, 95% CI 0.29 to 0.92). Cycling in the direction opposite to motor vehicle travel was associated with increased injury risk (adjusted OR 7.8, 95% CI2.02 to 30.3), as were downhill grade (adjusted OR 2.22, 95% CI 1.21 to 4.08) and high cycling traffic (more than 75 cyclists/h, adjusted OR 3.04, 95% CI 1.17 to 7.93). The variable ‘bike or pedestrian infrastructure’ (table 1) was not associated with an increased or decreased injury risk at intersections and was therefore not included in this model. The unadjusted and adjusted effects of all variables considered in intersection risk modelling are available in supplementary table S1 (available online only).

Intersections: results of conditional logistic regression analyses of associations between infrastructural characteristics and bicycling injury in a case–crossover study conducted in Vancouver and Toronto (Canada). Shown are the effects for single variables (left) and for all these variables together in the final multiple regression model (right), with final variables selected via a backward selection (comparison of N=210 injury sites and N=272 control sites, all at intersections). Closed circles represent the reference category for each variable.
Injuries at non-intersection locations
The unadjusted and adjusted associations of all variables that were retained in the final model of non-intersection characteristics and bicycling injury are shown in figure 3. Bicycle-specific infrastructure was associated with reduced injury risk in non-intersection locations. Cycle tracks (physically separated lanes alongside major streets) (adjusted OR 0.05, 95% CI 0.01 to 0.59) and local streets with diverters at the nearest intersection to reduce motor vehicle traffic (adjusted OR 0.04, 95% CI 0.003 to 0.60) were especially protective. The presence of streetcar or train tracks within a 5 m diameter of the site was associated with increased injury risk (adjusted OR 4.15, 95% CI 2.31 to 7.45) as was downhill grade (adjusted OR 2.05, 95% CI 1.48 to 2.85) and the presence of construction at the site during the injury trip (adjusted OR 2.67, 95% CI 1.70 to 4.19). Although it was not statistically significant, we also found a suggestion of increased risk with shared lanes or sharrows (adjusted OR 1.99, 95% CI 0.76 to 5.20). Results for all variables considered are available in supplementary table S2 (available online only).

Non-intersections: results of conditional logistic regression analyses of associations between infrastructural characteristics and bicycling injury in a case–crossover study conducted in Vancouver and Toronto (Canada). Shown are the effects for single variables (left) and for all these variables together in the final multiple regression model (right), with final variables selected via a backward selection (comparison of N=478 injury sites and N=801 control sites, all at non-intersection locations). Closed circles represent the reference category for each variable.
Discussion
In this study, the types of routes meeting, the intersection configuration, the speed of vehicles, the amount of cycling traffic and the direction of cyclist travel were all related to injury risk at intersections.
Intersections involving local streets or separated routes tended to have the lowest risks, with local–local street intersections having about one-fifth the risk of major–major street intersections. Low motor vehicle speeds were also protective. Average observed speeds less than 30 km/h had about one-half the risk of higher speeds at intersections. Speed limits of 30 km/h are mandated on residential streets in northern European countries where cycling is safer.9
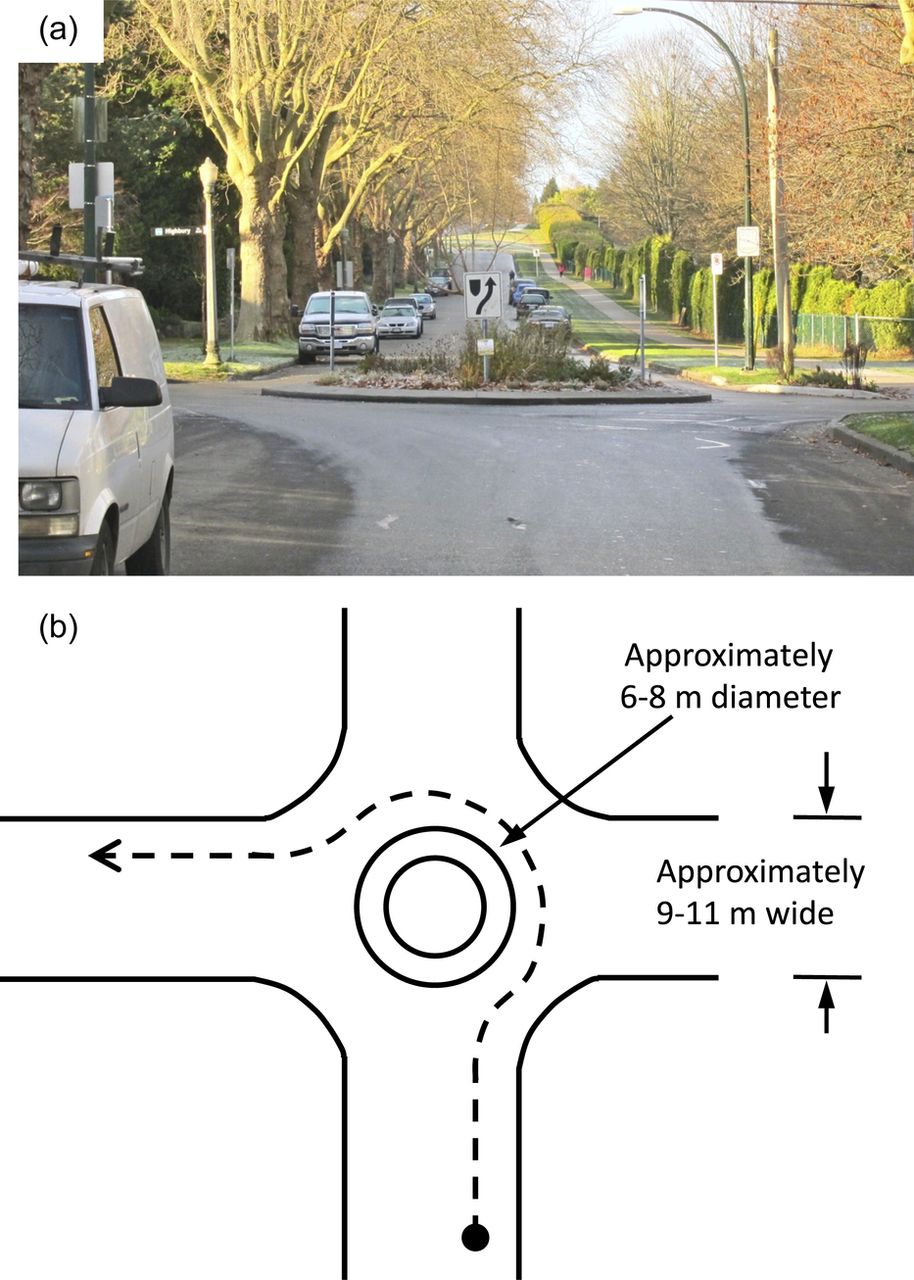
Traffic circles were more hazardous than all other intersection types (traffic lights, two-way stops, four-way stops and uncontrolled intersections). All traffic circles were in Vancouver, at intersections of two local streets (intersections that were otherwise found to be very safe). In Vancouver, local street traffic circles are small (approximately 6–8 m in diameter; figure 4) unlike major street roundabouts common in Europe. Comparisons are difficult because of the size difference, but other studies have shown that large roundabouts (∼30 m in diameter) reduce injury risk for motor vehicle occupants and this has fostered interest in this intersection design.18 ,19 Despite the reduced risk for motor vehicles at roundabouts, studies of cyclists have found increased risks.20–22 Brüde and Larsson23 showed that roundabouts with radii greater than 10 m were safer than smaller circles. Daniels et al21 and Schoon and Van Minnen19 showed reductions in roundabout risks for cyclists when there were lanes physically separated from motor vehicles. The increased risk to cyclists associated with traffic circles and roundabouts could relate to the large number of associated ‘conflict points’.24 In our study, the two main types of crashes at traffic circles were with motor vehicles (n=8), because the cyclist was not seen, or were single cyclist crashes (n=9), resulting from interactions with the infrastructure (eg, hitting the curb, sliding on the sharp turn).

A typical traffic circle found in residential areas of Vancouver, designed to calm motor vehicle traffic, but found to increase risk at intersections of local streets in this study. (A) Photograph as viewed from the perspective of an approaching cyclist. (B) Design dimensions of traffic circle (derived from measurements taken throughout the city). The dashed arrow shows the route a cyclist is required to take when turning left.
We included a variable indicating whether the cyclist was travelling in the opposite direction to motor vehicles and found it to increase risk at intersections significantly. While not an infrastructural variable, it can be related to infrastructure (eg, sidewalk riding) or forced by infrastructure (two-way cycle lanes at one side of the street). At the time of the study, none of the route infrastructure in Vancouver or Toronto mandated cycling in the direction opposite to traffic. The wrong-way crashes in this study were among cyclists entering the intersection from sidewalks (n=10) or local streets (n=8; traffic lanes are not demarcated and cyclists rode on the left instead of the right side of the street). One other study found an increased risk of a crash for cyclists riding on sidewalks when entering an intersection in the direction opposite to traffic flow.25
Intersections with high cycling traffic counts (more than 75/h) were associated with increased injury risk. Most of these crashes were with motor vehicles (n=51), not with other cyclists (n=1). Many studies have found increased safety with increased trips by bicycle.26 ,27 Most data about ‘safety in numbers’ is at the macro level (ie, city or country level), whereas our analysis examined the micro level (intersections). Two other recent studies examined the impact of increased cyclist volume at intersections: one in Finland showed lower crash risk with increased cyclist volume at a newly installed raised bicycle crossing;28 and one in Montréal found injury risk increased at a lower rate than cyclist volumes at signalised intersections.29 Our results may thus not be generalisable.
At intersection locations, we found that any bike or pedestrian infrastructure that the cyclist was riding on before entering the intersection (eg, cycle tracks, bike lanes, sidewalks) was not significantly associated with injury risk. This is probably because, in Vancouver and Toronto at the time of the study, this type of infrastructure was implemented along streets between intersections, not through intersections themselves. Although many northern European countries implement special features for cyclists at intersections, these were almost never observed in our study cities. We could only measure the effects of infrastructure implemented at the time of the study.
The benefits of cycling-specific infrastructure were apparent at non-intersection locations. Our consistent finding11 that cycle tracks decrease risk are similar to findings by Lusk et al12 in Montréal. Other studies have also found decreased risks for bicycle lanes30–34 or cycle tracks.19 Because previous research has shown increased risks for separated facilities such as off-street paths and sidewalks,31–33 ,35 ,36 some North American transportation safety advocates argue against cycle tracks and other bicycle-specific infrastructure.37 However, our results support separation from motor vehicles for injury prevention. Conversely, infrastructure that pairs cyclists with either motor vehicles (shared lanes and sharrows) or pedestrians (multi-use paths, sidewalks) offered no such protection. Shared lanes and sidewalks were associated with increased odds of injury, albeit not statistically significantly. Our findings highlight the importance of distinguishing bicycle-specific from mixed-use infrastructure in analyses of risk.
Similar to cycle tracks, local streets with diverters to reduce motor vehicle traffic were found to have very low risk, probably because they reduce motor vehicle volumes. Traffic slowing devices (eg, traffic circles, curb extensions and speed bumps or humps) are also considered ‘traffic calming’ measures and were implemented to slow traffic on local streets, but were not found to have a significant benefit. One study found that motor vehicles may speed up immediately after a traffic-slowing device.38
We found that streetcar tracks and construction were associated with increased risk of cycling injury, consistent with our previous analysis.11 The construction finding suggests the need for demarcated route detours to allow cyclists to avoid construction zones. Our finding that streetcar tracks are associated with injury appears to be new to the empirical literature, although these have long been thought hazardous by Toronto cyclists.36
Downhill grade was associated with increased risk at both intersections and non-intersections, similar to findings elsewhere,11 ,39 ,40 probably affecting risk due to speed of travel and resulting force of impact. While the overall topography of a city is not modifiable, routes targeted for bicycle-specific infrastructure can be selected to minimise elevation changes to improve safety and simultaneously reduce exertion from uphill travel. Level surfaces and gentle slopes have been shown to be preferred by potential riders.5 The importance of grade to both cycling safety and attractiveness highlights the opportunity to foster cycling in naturally flat cities.
The current study used a case–crossover design10 that addresses many of the challenges of observational studies of bicycle safety,13 including effective control for both exposure to risk and personal factors that may affect both risk and environmental exposure such as experience and risk aversion. The blinded observations and lack of reliance on self-report of site characteristics offer advantages over previously used methods.11 ,13 Cycling conditions were observed after the injury event, so we cannot be sure they were exactly as occurred on the injury trip. This should not affect stable infrastructure such as route type, but may affect more transient conditions, such as traffic counts. Because observations were made in the identical way for injury and control sites, misclassification is likely to be non-differential and to bias risk estimates to the null.
The most significant limitation of the current analysis was that we could only examine the effects of infrastructure that was present in the study cities, and not the full range of infrastructure that could be used to mitigate cyclist risk. This calls for replication of our study in other cities with different types of infrastructure, and for further studies as new infrastructure is built.
The analyses reported here do not take the severity of the injuries into account. A severity analysis is planned for the study data, but the main focus of the study was the initial risk of being involved in an injury crash, rather than the injury consequences. The study was restricted to cyclists whose injuries were serious enough to result in a visit to a hospital emergency department. By using hospital records, injuries caused by all kinds of crashes were included (eg, with a motor vehicle or not). We could not include individuals who were so severely injured that that they could not recall their trip route; however, few were excluded by this eligibility criterion (two fatally injured and 26 who could not remember their route). The results of this study therefore may not apply to those with minor injuries not requiring emergency treatment or with the most serious injuries.
We offered multiple variables to the models and some were likely to be significant by chance alone. We have attempted to be cautious in our interpretations, by looking for consistency with other studies, and recommending verification in future studies in which a result is novel. In addition, we have presented complete tables showing all variables in the unadjusted and adjusted models in supplementary tables (available online only) for examination by interested readers.
Conclusions
Different infrastructure characteristics influenced risk at intersections and non-intersections. At intersections, significant variables were route types meeting at the intersection, intersection type, cyclist travel direction, motor vehicle speed, cyclist traffic count and route grade. At non-intersection locations, significant variables were bike or pedestrian infrastructure, streetcar or train tracks, construction and route grade. Only route grade was significant in both analyses.
Despite the differing variables important in the two analyses, there are consistent patterns: features that separate cyclists from motor vehicles and pedestrians (cycle tracks, local streets, traffic diverters) and lower speeds (motor vehicle speeds less than 30 km/h, level grades) were associated with significantly lower injury risk to cyclists. These features are incorporated into transportation design in northern European countries with high cycling modal shares and low injury risk, and have been shown to encourage cycling in North America.5 ,7–9 Important additional evidence from this study includes the importance of obstacles in reducing safety (traffic circles, streetcar or train tracks, construction). Transportation planners and engineers in many North American cities are interested in promoting cycling and will benefit from the accumulating evidence about the value of building environments sensitive to cyclists.
What is already known on the subject
-
The risk of injury associated with bicycling is higher in North America than in northern European countries where cycling infrastructure is common.
-
Evidence is accumulating that routes with low motor vehicle traffic and bicycle-specific infrastructure improve cycling safety.
-
This evidence has been considered inconclusive because previous studies have had unclear route definitions, grouped routes with potentially different injury risks, and had poor control for traffic volume and personal characteristics.
What this study adds
-
This study examined the injury risk associated with multiple carefully defined and measured route infrastructure characteristics. It analysed intersection and non-intersection locations separately, to examine the special characteristics of each. The case–crossover design effectively controlled for personal, trip and exposure factors, allowing the focus to be on route infrastructure.
-
Intersections of two local streets had much lower risks than intersections of two major streets, but traffic circles increased the risk of these otherwise safe intersections. Entering intersections in the direction opposite to traffic increased injury risk, and motor vehicle speeds below 30 km/h reduced risk.
-
At non-intersection locations, cycle tracks alongside major streets but physically separated from traffic and local streets with diverters that reduced motor vehicle traffic had much lower injury risk than routes with no bike infrastructure.
Acknowledgments
The authors would like to thank all the study participants for generously contributing their time. They appreciate the work of study staff, hospital personnel and their city and community collaborators. This study evolved from work conducted in the University of British Columbia's Bridge Program Grant Development course (2005–6) and benefited from input from the participants of that class.
References
Supplementary materials
Supplementary Data
This web only file has been produced by the BMJ Publishing Group from an electronic file supplied by the author(s) and has not been edited for content.
Files in this Data Supplement:
- Data supplement 1 - Online tables
Footnotes
-
Contributors KT, MAH, CCOR and PAC were responsible for initial conception and design of the study. KT, MAH, CCOR, PAC, MW, SB, MLC, MDC, JRB, GH, SMF and Kishore Mulpuri were responsible for the funding proposal. CCOR, MAH, MW, MM, LV, MDC and KT designed and tested data collection instruments. MW, HS and KT developed algorithms for defining route infrastructure. HS was responsible for data analyses. All authors had full access to the results of all analyses. MAH, CCOR and KT drafted the article. All authors contributed to study design and implementation, analysis decisions, interpretation of results and critical revision of the article. Evan Beaupré, Niki Blakely, Jill Dalton, Martin Kang, Kevin McCurley and Andrew Thomas were responsible for interviews or site observations. Vartouji Jazmaji, MM and LV were responsible for supervision and training of study staff, and recruitment of participants. Barb Boychuk, Jan Buchanan, Doug Chisholm, Nada Elfeki, JRB, GH, SMF and MDC contributed to the identification of injured cyclists at the study hospitals. Jack Becker, Bonnie Fenton, David Hay, Nancy Smith Lea, Peter Stary, Fred Sztabinski, David Tomlinson and Barbara Wentworth reviewed the study protocol, data collection forms, infrastructure definitions and interpretation of results from the perspective of professionals or advocates involved in cycling transportation. Data were double entered by Express Data Ltd.
-
Funding This work was supported by a grant from the Heart and Stroke Foundation of Canada and the Canadian Institutes of Health Research (Institute of Musculoskeletal Health and Arthritis and Institute of Nutrition, Metabolism and Diabetes) (grant no BEO-85863). JRB, MAH and MW were supported by salary awards from the Michael Smith Foundation for Health Research. MAH, CCOR and MW were supported by salary awards from the Canadian Institutes of Health Research.
-
Competing interests None.
-
Ethics approval A total of seven research ethics boards approved this protocol: universities of Toronto and British Columbia and these hospitals: St Paul's, Vancouver General (Vancouver) and St Michael's, Toronto General, Toronto Western (Toronto).
-
Provenance and peer review Not commissioned; externally peer reviewed.
-
Data sharing statement The study database was compiled from interviews with study participants and site observations by study personnel. It cannot be shared by the authors with anyone without approval from the university and hospital human subjects review boards.
-
Open Access This is an Open Access article distributed in accordance with the Creative Commons Attribution Non Commercial (CC BY-NC 3.0) license, which permits others to distribute, remix, adapt, build upon this work non-commercially, and license their derivative works on different terms, provided the original work is properly cited and the use is non-commercial. See: http://creativecommons.org/licenses/by-nc/3.0/