Article Text

Abstract
Objective Our objective was to describe the development of the New Jersey Safety and Health Outcomes (NJ-SHO) data warehouse—a unique and comprehensive data source that integrates state-wide administrative databases in NJ to enable the field of injury prevention to address critical, high-priority research questions.
Methods We undertook an iterative process to link data from six state-wide administrative databases from NJ for the period of 2004 through 2018: (1) driver licensing histories, (2) traffic-related citations and suspensions, (3) police-reported crashes, (4) birth certificates, (5) death certificates and (6) hospital discharges (emergency department, inpatient and outpatient). We also linked to electronic health records of all NJ patients of the Children’s Hospital of Philadelphia network, census tract-level indicators (using geocoded residential addresses) and state-wide Medicaid/Medicare data. We used several metrics to evaluate the quality of the linkage process.
Results After the linkage process was complete, the NJ-SHO data warehouse included linked records for 22.3 million distinct individuals. Our evaluation of this linkage suggests that the linkage was of high quality: (1) the median match probability—or likelihood of a match being true—among all accepted pairs was 0.9999 (IQR: 0.9999–1.0000); and (2) the false match rate—or proportion of accepted pairs that were false matches—was 0.0063.
Conclusions The resulting NJ-SHO warehouse is one of the most comprehensive and rich longitudinal sources of injury data to date. The warehouse has already been used to support numerous studies and is primed to support a host of rigorous studies in the field of injury prevention.
- motor vehicle occupant
- epidemiology
- risk factor research
Data availability statement
Data are available upon request.
Statistics from Altmetric.com
Introduction
There have been recent calls for public health researchers to adopt more holistic life-course approaches that consider health as part of an ‘integrated lifespan continuum’ and as being influenced by a complex web of inter-relationships between contributing factors, interventions and individuals.1–3 However, there is a dearth of injury studies—and in particular studies of motor vehicle crashes (MVCs)—that effectively adopt this approach. In the USA, the National Highway Traffic Safety Administration (NHTSA) and some state jurisdictions provide de-identified crash data sets to researchers for analyses; however, these data are substantially limited in a number of ways. First, crash events can only be studied in isolation. Therefore, multiple events experienced by an individual driver cannot be connected, limiting our ability to understand context and characteristics of our most frequently crash-involved drivers. Second, crash reports contain data only on the events occurring just prior to the crash, the crash event itself and the conditions of involved individuals in the moments just after the crash. This essentially limits the study period to just a few minutes. Third, the vast majority of pedestrians and pedalcyclists injured in a crash (as identified via hospital records) are not found on crash reports,4 limiting the capability of crash report data to support studies of these vulnerable road users. Although there are several linkages of crash data to either pre-crash data or to immediate crash-related injury data in the USA and internationally,4–7 few if any existing traffic safety data sources span the continuum from underlying contributing factors to short-term and long-term outcomes. Thus, we are severely limited in our ability to conduct in-depth, holistic studies to identify targets for intervention or evaluate the effect of interventions on long-term outcomes.
Similarly, the injury prevention field lacks rich data sources to support studies that examine contributing pre-injury factors or post-injury health outcomes. Several existing data sources enable researchers to estimate the incidence or prevalence of injuries—for example, the CDC’s Web-based Injury Statistics Query and Reporting System,8 the National Electronic Injury Surveillance System,9 the National Vital Statistics System10 and the National Poison Data System.11 However, these sources are less suitable for conducting longitudinal studies, identifying underlying risk factors, or evaluating local public health programmes and interventions.
The scientific premise of our research programme is that by linking crash data to other large, administrative data sources—in particular those preceding and subsequent to a crash event—we can essentially extend the study time period of a crash event from a few minutes to decades, while also characterising important factors among different subgroups and within populations over time. To this end, we began to develop the New Jersey Safety and Health Outcomes (NJ-SHO) data warehouse in 2011 with the goal of catalysing our ability to address critical, high-priority research questions in traffic safety. As we expanded the warehouse, we intentionally designed it to support novel research on other injury mechanisms. In this paper, we describe the data sources included in the NJ-SHO warehouse; detail our process of linking and evaluating the quality of the warehouse; and comment on its previous and future uses.
Methods
Data sources
As shown in table 1, we obtained in-depth data from numerous state-wide administrative databases. (1) NJ’s driver licensing database contains full licensing records for all individuals licensed in NJ at any point from January 2004 through December 2018. It includes full names, 15-digit driver licence numbers, residential addresses, and dates of birth, death, and issuance of a learner’s permit and/or driver’s licence. (2) NJ’s traffic-related citation database includes dates and types of all moving violations, traffic citations and licence suspensions/restorations. (3) NJ’s crash database includes detailed crash-level, vehicle-level, driver-level, passenger-level and pedestrian/pedalcyclist-level data collected on the NJ Police Crash Investigation Report for all police-reported crashes from 2004 to 2017. A crash is reportable in NJ if it results in an injury or >$500 in property damage.12 The NJ Department of Transportation geocoded crash locations, with completeness by year ranging from 78% through 86%. (4) NJ’s birth certificate and (5) death certificate databases include data collected on vital statistics collection forms. (6) NJ’s Hospital Discharge Data Collection System contains data from all hospital inpatient, outpatient and emergency department (ED) visits in the state, including ICD-9/10-CM diagnosis codes and procedure codes. For each data source, we obtain raw files from the relevant organisation listed in table 1 through secure File Transfer Protocols on an annual basis.
Description of data sources that have been integrated into (1) or linked with (2) the New Jersey Safety and Health Outcomes (NJ-SHO) warehouse
In addition to these databases, we incorporated several other data sources into the NJ-SHO warehouse. (7) We included the full electronic health records (EHRs) for all NJ patients of the Children’s Hospital of Philadelphia (CHOP) network—which encompasses >50 locations in southeastern Pennsylvania and southern New Jersey. (8) We obtained census tract-level indicators (eg, median household income, population counts, availability of healthcare providers, employment accessibility, walkability) from a variety of geographical-based data sources (eg, US Census, American Community Survey, EPA Smart Location database). (9) Using NHTSA’s Catalog and Vehicle Listing platform, we decoded the vehicle information number (VIN) of each crash-involved vehicle and obtain detailed vehicle information, including model year, vehicle type, and the presence of safety features such as front and side air bags. Data from each source were imported into a common structure, and we identified and standardised data elements in each source that could be included in a probabilistic linkage (table 2). Although not described in this paper, as noted in table 1, we also recently linked licence and crash-involved driver records with (10) Medicaid healthcare claims data and (11) Medicare health claims data (parts A and D) for NJ beneficiaries in collaboration with Brown University and Centers for Medicare and Medicaid Services.
List of data elements used in linkage process, by data source
Data governance and security
All NJ-SHO activities are bound by legal agreements (eg, Data Use Agreement, Memorandum of Agreement) between CHOP and data owners, which establish approved uses of these data as well as stringent security measures, including data transfer, storage, sharing and release; interested parties should contact the corresponding author. Within the USA, release of traffic safety data is supported by the 1994 federal Driver’s Privacy Protection Act, which exempts restrictions on release of data when used for research purposes; as we discuss in a previous paper, data accessibility varies by state.13 Further, linkage and research activities have been reviewed and approved by the Institutional Review Boards at CHOP and the NJ Department of Health. Immediately upon receipt of data, we separate data elements that are considered protected health identifiers (eg, name, residential address, Social Security Number, driver licence number) and used for linkage purposes; these data are stored on a secure drive separate from other data and accessible only to research staff who were integral to the linkage process.
Linkage process
This section describes the linkage process we undertook to construct the NJ-SHO warehouse; online supplemental table 1 includes definitions of italicised linkage-related terms. We first conducted a probabilistic linkage in LinkSolv V.9.0 (2015 Strategic Matching) to link sources 1–7 above. (As described below, crash-involved vehicle passengers were not included in the probabilistic linkage.) Briefly, LinkSolv uses Bayes’ rule to calculate posterior probabilities of a true match between two records based on agreements (within a specified tolerance) and disagreements (outside the specified tolerance) between examined data elements.14 15 Comparisons across multiple data elements result in the generation of a match probability, or the likelihood that the pair is a true match. Match probabilities incorporate both the discriminating power of data elements (agreement on common values has less impact than agreement on rare values) and their reliability (disagreement on data elements thought to be less error-prone provides more evidence against a match than disagreement on data elements thought to be more error-prone). A full linkage process involves several passes, each of which brings together pairs of records with exactly the same values on selected criteria (join criteria, also commonly called block criteria) and subsequently evaluates those pairs based on additional criteria (match criteria). Match criteria are the same for each pass, but join criteria differ, thereby ensuring that disagreement on a single data element will not prevent the identification of a true match.
Supplemental material
To prepare data for the probabilistic linkage, we reduced the number of records by de-duplicating hospital records based on exact agreement for all data elements (table 2) and combined records from all of the sources into one file so that we could execute a single file match. Then, using an iterative process, we developed and executed a linkage algorithm that ultimately consisted of two passes (table 3). We used two criteria to control the quality of our process: (1) we rejected any pair of records with a match probability <0.60 and (2) selected 0.01 as the highest acceptable threshold for the false match rate. To determine the false match rate, we first calculated the false match probability for each pair as 1 minus the match probability. Then we ranked all matched pairs from the lowest to highest false match probability. The false match rate was then calculated iteratively as the sum of the false match probabilities for the ranked pairs divided by the number of pairs. Matched pairs were included in the calculation, one at a time in ranked order, until either all pairs were added or the false match rate was 0.01, whichever occurred first. The linkage algorithm identified all records that pertained to a single individual and combined them into a set. Importantly, records in each data source were linked independently of all other data sources (eg, birth records were linked to EHRs regardless of driver licence status, crash-involved driver records were linked to other crash-involved drivers even if the individual did not appear in any other source). Additionally, using a single file match method allowed us to maximise all information and connections. For instance, an individual may have had sufficient matching information to connect record A to B and record B to C, but not record A to C; because of the single file methodology, records A, B and C were identified as a single individual or set.
Details of probabilistic linkage process in LinkSolv V.9.0
We evaluated this probabilistic linkage in three primary ways. First, we determined the median and interquartile range (IQR) of the match probabilities for all accepted pairs, as well as the lowest match probability among all of the pairs in each set. Second, we estimated the false match rate, as described above. Third, we determined the proportion of records from each data source that matched with a record from one of the other sources (eg, licence record with a birth record) or the same source (eg, two birth records).
Identifiable data elements for crash-involved vehicle passengers began being collected in 2009 but fewer elements are complete or collected (eg, street name without city or ZIP code). Consequently, including passengers in the above-described linkage created too many false matches. Thus, we conducted a subsequent hierarchical deterministic linkage using SAS software, V.9.4 (SAS Institute) to link crash-involved passenger records to records from all other data sources. As shown in table 4, this linkage included 16 passes with varying match criteria. Passenger records had to include first and last name and either age (or date of birth) or street address to be included in the process. To evaluate the deterministic linkage process, we estimated the true match proportion—the proportion of matches that are indeed true matches—by hand reviewing 505 passenger records (a random sample of at least 5 records from each of 16 passes) that matched with a record from one of the other sources. To estimate the false non-match proportion—the proportion of unmatched passengers who should have been matched to another record—we randomly sampled 350 unmatched passengers and, for each, hand reviewed the five most likely matches.
Results of linkage process of crash-involved passengers (total number of records included in linkage process=1 050 182)
Geocoding residential addresses
Residential addresses are available in most state-wide data sources (table 2). In this paper we present our initial effort to geocode the residential addresses of all licensed NJ drivers and all crash-involved drivers. Records were prepared for geocoding if at least one address component (ie, street, city, state, ZIP) was populated and the state was NJ or unknown. Crash-involved driver records that did not meet this threshold generally belonged to parked/driverless or hit-and-run vehicles. We conducted the geocoding process within the automated geocoding engine in ArcGIS V.10.5 (Esri, Redlands, California, USA). The default geocoding options were used and include spelling sensitivity (80), minimum candidate score (75) and minimum match score (85). Geocoding results were compared against Google Maps and included coordinate values (latitude and longitude). Linkage quality was assessed via a hand review of 500 randomly sampled records. Once each driver’s address was geocoded, we obtained and incorporated census tract-level data from numerous publicly available sources (table 1). We subsequently geocoded each individual’s most recent NJ residential address from other sources (when there was one).
Injury classification
We used ICD-9/10-CM diagnostic codes, including external cause of injury codes, in hospital data to identify injury-related hospital inpatient, outpatient and ED visits.16 We mapped each injury-related ICD-9/10-CM diagnosis code to a corresponding Abbreviated Injury Scale (AIS) score and Injury Severity Score (ISS).17–19 We identified injury deaths using specific cause of death ICD-10 codes established by the National Center for Health Statistics.20
Results
Linkage results and validation
The final data warehouse includes de-identified records for a total of 22.3 million distinct individuals; 48.3% had more than one record brought together during the linkage process (ie, were included in a set). Each person and event was assigned a new randomly generated identification number in order to disconnect warehouse data from the original data containing protected health identifiers. Table 1 shows the number of records from each data source included in the final data warehouse.
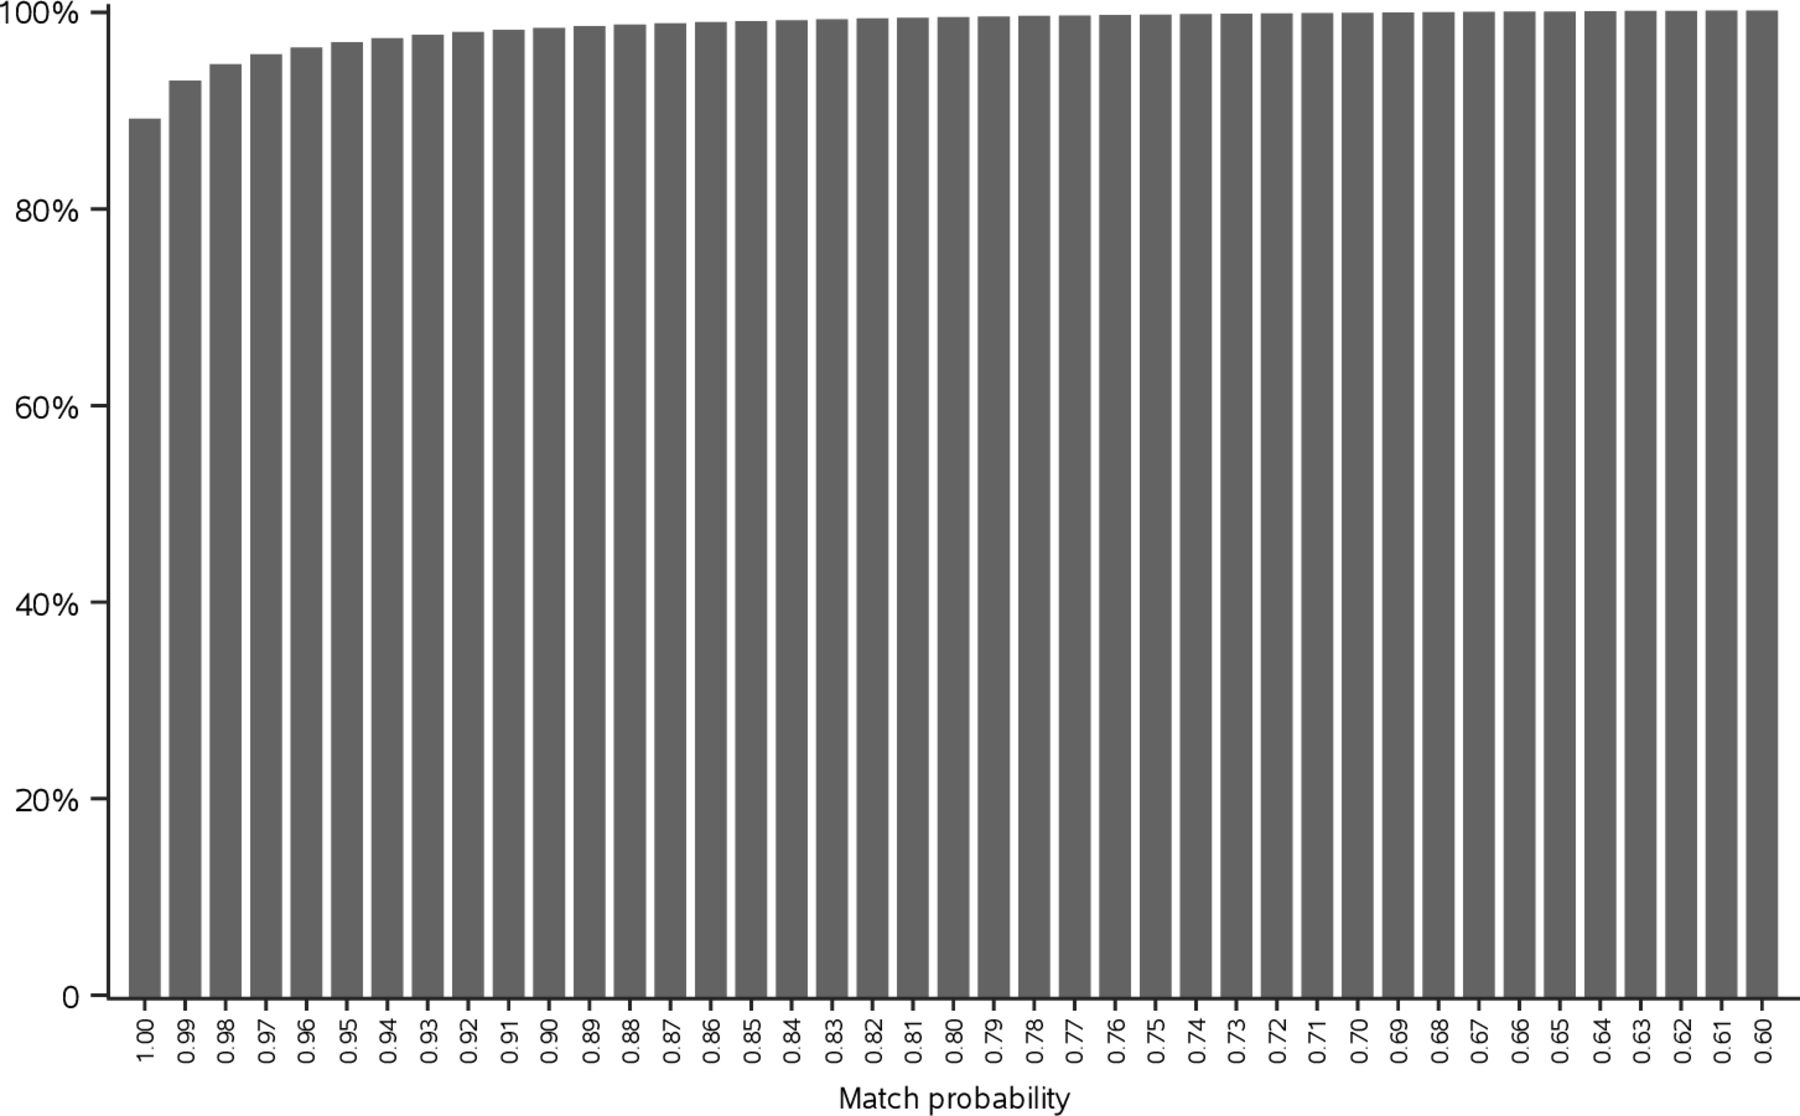
We undertook several steps to evaluate the quality of the probabilistic linkage. First, we assessed the match probability for each pair of records accepted into a set. Overall, the median match probability was 0.9999991 (IQR: 0.9998636–1.0000000); figure 1 displays the cumulative distribution of match probabilities among all accepted pairs. Second, the lowest match probability for any two records within a set was 0.99 or higher for 83.7% of all sets and 0.90 or higher for 95.1% of sets. Third, our final estimated false match rate was 0.0063, well below the established threshold of 0.01. Finally, we examined the number of individuals post-linkage who had more than one record from a source expected to have only one record per individual (ie, birth, licence, EHR and death data sets). As we had anticipated, the proportions of individuals with >1 such record were very low (0.06% with >1 birth record; 0.1% with >1 licence record; <0.01% with >1 EHR; 0.01% with >1 death record). In all, 0.2% (n=36 277) of individuals had more than one record that should be unique.

Cumulative distribution of match probabilities among all accepted pairs.
A total of 1 050 182 records were processed during the hierarchical deterministic linkage of crash-involved passengers. After matching passenger records with all other non-passenger records, 67.2% of passenger records were successfully linked to one and only one individual (table 4). Based on our hand review, we estimated the true match proportion to be 93.4% and the false non-match proportion to be 6.0%.
Geocoding activities
Over 16 million addresses were processed; 94.5% were successfully geocoded to an address point or street address. When including those records that were geocoded to the ZIP code level (or a more precise unit), 98.3% of addresses were geocoded. Weighted results of the hand review estimated the true match rate to be 99.7%. For 83.3% of the 5.3 million crash-involved drivers whose residential address was geocoded, we were able to calculate distance to crash location (Euclidean distance and driving distance in miles and time).
Final warehouse structure
The warehouse is organised as more than 30 relational tables that can be connected with key variables. For example, an individual-level identifier (PersonID) can connect an individual’s driver licence record to their hospital records or two hospital records to each other, while a crash-level identifier (CrashID) connects all individuals (drivers, passengers, bicyclists/pedestrians) involved in a particular crash. Data can be further linked to publicly available geographical-level data via individual-level data elements (eg, census tract of residence). To illustrate the volume of injury-related records included in the warehouse, we used CDC’s external cause-of-injury framework to categorise ICD-10-CM codes for injury-related hospital visits (inpatient, outpatient, ED) in 2017, the most recent year available for these data (table 5).16 With 15 years of available data, the warehouse can easily support longitudinal analyses on a variety of injury-related topics. For example, of the 375 966 NJ drivers involved in a crash in 2017 (1) 43 936 (12%) had a hospital visit within 2 days, enabling analyses of crash-related injuries; (2) 295 108 (78%) had data on a prior hospital visit, enabling analyses of crash outcomes among drivers with specific medical conditions; and (3) 337 529 (90%) had licensing data, enabling incorporation of previous crash, citation and licence suspensions in assessment of crash risk.
Select injury intent and mechanism categories for all 2017 hospital visits (ED, inpatient and outpatient), by age group16
Discussion
The NJ-SHO data warehouse is one of the most comprehensive and rich traffic safety data sources in the USA to date; thus far, 30 scientific papers have been published using NJ-SHO data.21 The warehouse has a longitudinal structure spanning 15 years (with additional years to be added); includes drivers of all ages, as well as vehicle passengers, pedestrians and bicyclists; and has several unique aspects, including geocoded residential addresses for all drivers and linkage to vehicle safety features via VIN. These features ensure it can support rigorous and innovative studies in a wide array of traffic safety topics, including impaired driving, older driver crashes, pedestrian and bicyclist injuries, and child passenger safety. The NJ-SHO is also designed to support studies on a wide variety of injury-related topics. Each data source is linked independent of all other data sources; this enables studies, for example, of injury risk among individuals with specific medical conditions, identification of subgroups and communities at higher risk for specific injuries, and examination of repeated injuries over time. Further, given strong identifiers and geocoded residential addresses, the warehouse is primed to be further linked to geographical-level data sources as well as additional individual-level databases, including emergency medical service and trauma registry data, rehabilitation data and prescription monitoring data.
A major strength of this study is that our evaluation indicates that NJ-SHO linkages were conducted with high quality, with high true match and low false non-match proportions. These rates are comparable with those reported in prior linkage studies of traffic or hospital data, which either directly reported these metrics or provided enough data to enable us to derive them.22–25 An important primary limitation is that we cannot reliably identify individuals who have moved out of state; however, we are able to identify when drivers’ licences expire and are not renewed. Second, identifiable information for vehicle passengers was not available prior to 2009 and is weaker than for other sources; thus, the extent of undermatching is likely to be higher relative to other data sources.
Conclusion
The NJ-SHO is a rich and growing source of injury-related data that can be used to address in-depth questions that span the pre-injury to post-injury period. By doing so, it can support studies that look to adopt a lifespan approach to gain a broader and more comprehensive understanding of the underlying contributors to and burden of injury events.
What this study adds
Presents a decade-long program to integrate multiple data sources to enable novel longitudinal studies in injury prevention.
Provides in-depth description of data preparation and integration as well as methods to evaluate linkage results to provide guidance for future data integration efforts
What is already known on this subject
Integrating multiple data sources can exponentially increase the value of injury data
Few studies have linked data that span the pre- to post-injury continuum
Data availability statement
Data are available upon request.
Ethics statements
Patient consent for publication
Ethics approval
Children's Hospital of Philadelphia (IRB 11-008136).
Supplementary materials
Supplementary Data
This web only file has been produced by the BMJ Publishing Group from an electronic file supplied by the author(s) and has not been edited for content.
Footnotes
Contributors AEC secured funding for the study, planned the study, interpreted results and led the development of the manuscript. MRP designed the study, conducted the data linkage and drafted the manuscript. KBM planned the study, contributed to interpretation of results and critically revised the manuscript. MEC contributed to the planning of the study, contributed to interpretation of results and critically revised the manuscript. LJC designed the study, conducted the data linkage and critically revised the manuscript. All authors approved the final version of the manuscript.
Funding This work was supported by the Eunice Kennedy Shriver National Institute of Child Health and Human Development at the National Institutes of Health Awards R21HD092850 (PI: AEC) and R21HD098276 (PI: AEC).
Disclaimer The content is solely the responsibility of the authors and does not necessarily represent the official views of the National Institutes of Health. The sponsor had no role in the design and conduct of the study; collection, management, analysis and interpretation of the data; preparation, review or approval of the manuscript; or decision to submit the manuscript for publication.
Competing interests None declared.
Provenance and peer review Not commissioned; externally peer reviewed.
Supplemental material This content has been supplied by the author(s). It has not been vetted by BMJ Publishing Group Limited (BMJ) and may not have been peer-reviewed. Any opinions or recommendations discussed are solely those of the author(s) and are not endorsed by BMJ. BMJ disclaims all liability and responsibility arising from any reliance placed on the content. Where the content includes any translated material, BMJ does not warrant the accuracy and reliability of the translations (including but not limited to local regulations, clinical guidelines, terminology, drug names and drug dosages), and is not responsible for any error and/or omissions arising from translation and adaptation or otherwise.