Article Text

Abstract
Objective Childhood burns represent a burden on health services, yet the full extent of the problem is difficult to quantify. We estimated the annual UK incidence from primary care (PC), emergency attendances (EA), hospital admissions (HA) and deaths.
Methods The population was children (0–15 years), across England, Wales, Scotland and Northern Ireland (NI), with medically attended burns 2013–2015. Routinely collected data sources included PC attendances from Clinical Practice Research Datalink 2013–2015), EAs from Paediatric Emergency Research in the United Kingdom and Ireland (PERUKI, 2014) and National Health Services Wales Informatics Services, HAs from Hospital Episode Statistics, National Services Scotland and Social Services and Public Safety (2014), and mortality from the Office for National Statistics, National Records of Scotland and NI Statistics and Research Agency 2013–2015. The population denominators were based on Office for National Statistics mid-year population estimates.
Results The annual PC burns attendance was 16.1/10 000 persons at risk (95% CI 15.6 to 16.6); EAs were 35.1/10 000 persons at risk (95% CI 34.7 to 35.5) in England and 28.9 (95% CI 27.5 to 30.3) in Wales. HAs ranged from 6.0/10 000 person at risk (95% CI 5.9 to 6.2) in England to 3.1 in Wales and Scotland (95% CI 2.7 to 3.8 and 2.7 to 3.5, respectively) and 2.8 (95% CI 2.4 to 3.4) in NI. In England, Wales and Scotland, 75% of HAs were aged <5 years. Mortality was low with 0.1/1 000 000 persons at risk (95% CI 0.06 to 0.2).
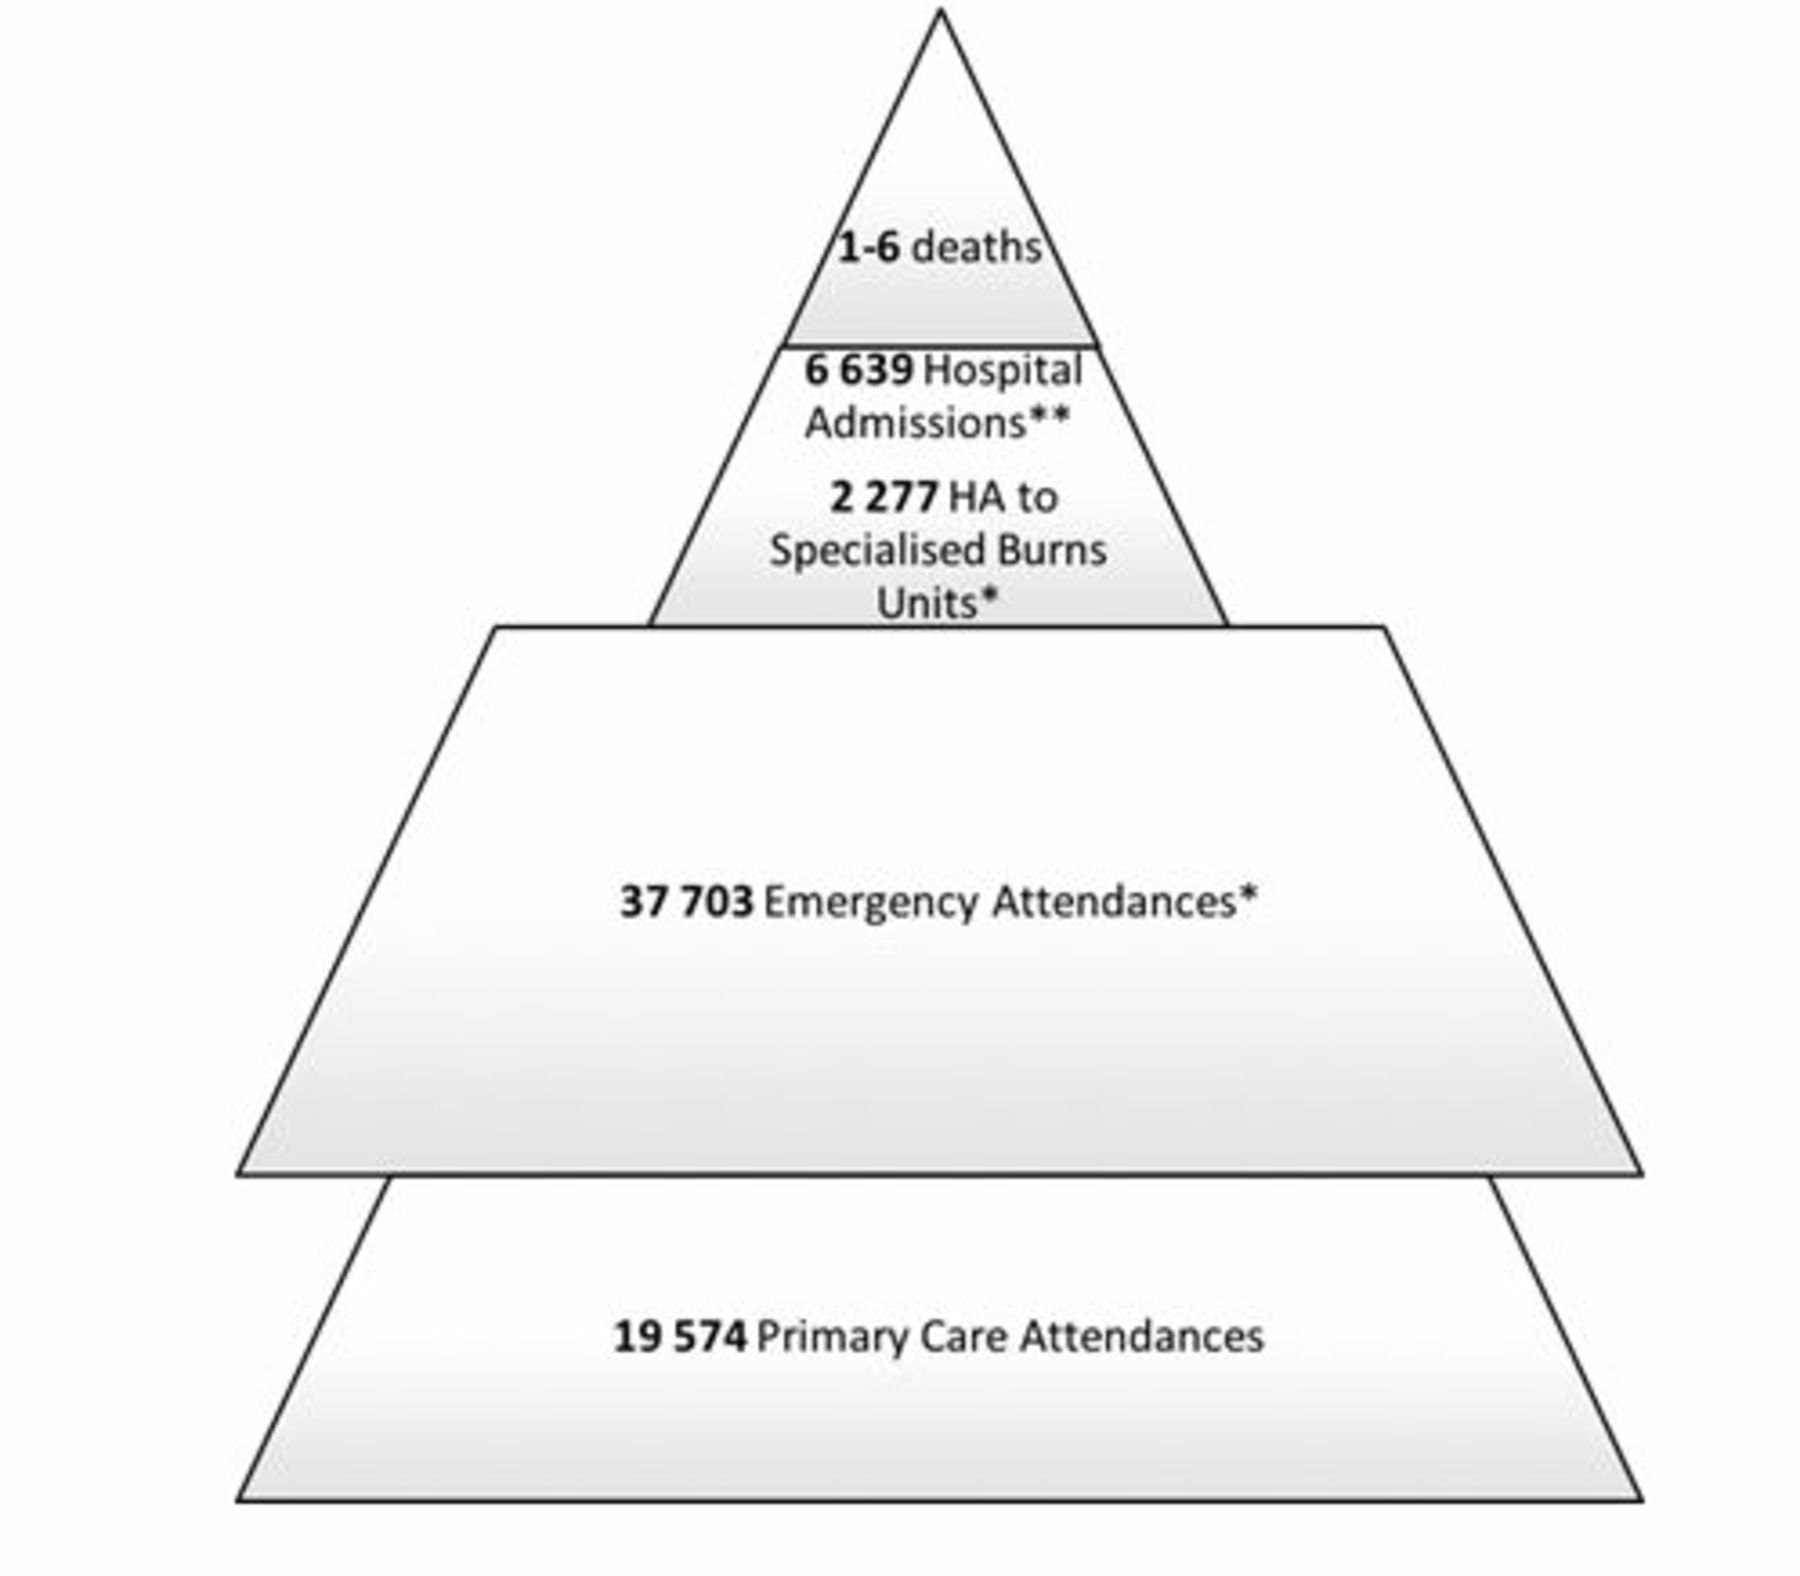
Conclusions With an estimated 19 574 PC attendances, 37 703 EAs (England and Wales only), 6639 HAs and 1–6 childhood deaths annually, there is an urgent need to improve UK childhood burns prevention.
- burn
- child
- epidemiology
This is an open access article distributed in accordance with the Creative Commons Attribution Non Commercial (CC BY-NC 4.0) license, which permits others to distribute, remix, adapt, build upon this work non-commercially, and license their derivative works on different terms, provided the original work is properly cited, appropriate credit is given, any changes made indicated, and the use is non-commercial. See: http://creativecommons.org/licenses/by-nc/4.0/.
Statistics from Altmetric.com
Introduction
Burns are the fourth most common injury after road traffic incidents, falls and interpersonal violence,1 and are among the most expensive injuries, owing to acute and long-term costs of medical care in the community and hospital and consequent education or work time lost.2 Childhood burns account for over half of burns seen in European hospitals.3 Burns are painful, often resulting in psychological complications, disfigurement and disability.4 5
In the UK, care of childhood burns occurs in several settings. Burns may be treated at home or by pharmacists, primary care (PC) teams, in minor injury units or emergency departments (EDs). Some require hospital admission (HA), and complex burns are referred to specialist paediatric burn services within the National Network for Burn Care.6
There is a lack of published literature regarding the incidence of childhood burns in the UK across the full spectrum of medically attended burns. Since 2005, the International Burn Injury Database (iBID) has improved surveillance of admissions to specialised Burns Units or Centres in England and Wales.7 8 However, this represents only the most serious burns. Baker et al estimated overall annual burn incidence from linked national data sets of PC attendances, HAs and deaths in England from 1998 to 2011, for those aged 0–24 years as 35.5 per 10 000 persons at risk,9 identifying falling rates of annual incidence. This group also estimated an overall crude annual incidence rate for thermal events among 0–4 years.10 Other studies have reported solely ED data.11–13
The prevalence and severity of childhood burns are affected by changing population demographics and burn hazards.3 14 As burns in children are largely preventable,5 it is important to have accurate estimates of childhood burns across different healthcare settings in order to target and evaluate prevention strategies, and tailor healthcare provision.14–16
This study aims to estimate the annual incidence of childhood burns treated across the National Health Service (NHS) in the UK.
Methods
We used routinely collected national morbidity and mortality data, and research data sets for children aged 0–15 years presenting to health services with a burn, across the four UK countries for 2013–2015. Data sources are described in table 1. The annual incidence figures were estimated using episodes of care in each healthcare setting. Data were grouped into age bands 0–4, 5–9 and 10–15 years where possible. The estimated UK population represented is based on Office for National Statistics mid-year data that were available in December 2015 and detailed in table 2.17
Sources used for data collection of childhood burns incidence across the UK for the period 2013–2015
Total hospital admissions (HA) including those to burn services, emergency attendances (EA) and primary care attendances for burns in the UK from 2013 to 2015.
Estimated annual incidence of childhood deaths from burns in the UK from 2013 to 2015
Primary care attendances
PC first attendances due to burns were estimated using the Clinical Practice Research Datalink (CPRD), a longitudinal database of PC records that is representative of 6.9% of the UK population.18
All children aged 0–15 years registered with a PC practice contributing data to CPRD during 2013–2015 calendar years were identified. Data were extracted for all Read Codes associated with burns (online supplementary appendix 1) and verified by two authors. Consultation codes related to patient administration referrals or treatment were excluded. To differentiate new cases from repeat consultations for the same burn, we used an algorithm that excluded consultations for a burn within a 3-week time window. We counted presentation events to determine when they levelled out, varying the time window to 30 days. The number of children of the appropriate age at risk at mid-year was used to calculate persons’ risk figures using the number of UK CPRD registered patients from practices with acceptable data quality.
Emergency attendances
We defined EA as attendance to any of the three tiers of UK-provided service; consultant-led 24 hours service with full resuscitation facilities, consultant-led single specialty service and doctor-led/nurse-led service.
National English EA data did not detail the reason for attendance at the time of the study. To obtain representative figures, EDs that were members of the Paediatric Emergency Research in the United Kingdom & Ireland (PERUKI) (online supplementary appendix 2), were invited to contribute data during calendar year 2014 (2013 and 2015 data unavailable).19 Coding systems varied between EDs: International Classification of Disease (ICD-10), NHS data manual and local systems, however PERUKI supplied the total number of EA and the number of burn EAs for each ED. Although Welsh, Scottish and NI PERUKI data were available, insufficient units in each of these countries contributed to enable representative national estimates. Irish PERUKI data were beyond the study remit. We therefore provide a national estimate from PERUKI data for England only. For all 24 Welsh EDs, we used the Wales Emergency Department Data Set (EDDS) (online supplementary appendices 1 and 2) to produce a national estimate.
Hospital admissions
Data on admitted patients (including admission to hospitals with specialised burns services) from Hospital Episode Statistics, for whom a burn was the primary diagnosis, related to the financial year 2014, and used ICD-10 codes T20-32 (online supplementary appendix 1). NI data were not included in the total UK estimate because data were only available for different age groups.
Hospital admissions to specialised burns services
HA data does not detail the type of HA. iBID data for 2014 provided data on admissions to Specialised Burns Services in England and Wales. There were no equivalent data for Scotland and NI.
Mortality
Data sets related to calendar years 2013–2015 used coroner reports and Medical Certificate of Cause of Death according to ICD-10 codes T20-32 (online supplementary 1). Data detailed the number and age of children who experienced a burn contributing to, or causing, death.
Permission was granted from each source providing data to present this analysis. ISAC approval was received September 2016 for CPRD data (protocol number 16_199).
Data analysis
Data were analysed using Microsoft Excel, Stata V.14 and R V.3.3.2 (PC data).20 The number of burns, age group and the population at risk were identified from each source. Since we only had population data and no detailed information on exact time contribution of each individual, for HA, HA to burns services, EA and mortality, we calculated average number of persons at risk using the formula:
Average number of persons at risk = (N population baseline +N end) / 2 where N end=N population baseline - N burns
Population figures used in this calculation are detailed in table 2 and are based on figures available when the webpage was accessed on 1 December 2015 (17). Annual incidence figures for each healthcare setting were then estimated per 10 000 persons at risk with 95% CIs. PC annual incidence rates were estimated using the number of PC attendances and persons at risk at mid-year (table 2). A person’s time at risk began at the latest of the study start date (1 January 2013), their registration date with a practice and the date CPRD considered the practice data to be ‘up to standard’, and ended at the earliest of the study end date (31 December 2015), their 5th/10th/16th birthday (depending on age group under consideration), death, date of transfer out of the practice and last data collection date from the practice.
For England, the percentage of total EAs to PERUKI sites that were burns was calculated. This proportion was multiplied by the total number of paediatric EAs to the EDs in England for 2014 (n=3 877 983) to estimate the number of burns seen in EDs annually in England (table 2).
We also performed a subanalysis, where the proportion of burns for children attending ED were compared across PERUKI sites according to burn service provision at the hospital attended. An ED was defined to have ‘burn facilities’ where there was an onsite accredited Burns Unit or previous one in the process of centralisation, plastic surgery, accredited Burn Centre and Burn Unit. To compare incidence rates in different ED settings and countries, we used IRRs and associated p values calculated in Stata (table 3).
IRR for burn incidence in the UK between countries for emergency attendance, hospital admission and mortality.
Results
Estimated annual incidence rates and the frequency of burns for all settings are described in figure 1, tables 2 and 4.

Estimated annual number of childhood burns in the UK from 2013 to 2015. All sources used age range 0–15 years apart from mortality data where children were 0–14 years. estimates for hospital admissions (HAs), HAs to specialised burns units and emergency attendances are based on data from 2014. *HAs to specialised burns unit and emergency attendance estimates relate to England and Wales only. †HAs relate to England, Wales and Scotland only.
Primary care
The overall annual incidence of PC burn attendances across the UK, from 2013 to 2015, was 16.1/10 000 persons at risk (95% CI 15.6 to 16.6). Incidence decreased annually: for 2013 it was 17.3/10 000 persons at risk (95% CI 16.5 to 18.2), 16.1/10 000 persons at risk (95% CI 15.2 to 17.0) in 2014 and 14.6/10 000 persons at risk (95% CI 13.7 to 15.5) in 2015. The majority of burns attendances (50.5%) involved children aged <5 years (table 2). Approximately 19 572 children visit PC with a burn annually in the UK.
Emergency attendances
The 38 English PERUKI EDs, representing 15.6% of 244 English EDs. Burns accounted for 0.9% of child EAs, estimated incidence of 35.1 per 10 000 persons at risk (95% CI 34.7 to 35.5) (table 2). In England and Wales, 66.7% (7318/10 956) of EAs for burns were in children <5 years of age. The rate of EA attendance was significantly greater in England than in Wales (IRR 1.22 (95% CI 1.16 to 1.28)) (table 3). Across Wales burns accounted for 0.8% (1600/203 144) of all child EAs, an estimated incidence of 28.9 per 10 000 persons at risk (95% CI 27.5 to 30.3) (table 2).
PERUKI figures from England and Wales identified a total number of EA for burns of 37 703 for burns/year. This equates to an estimated incidence rate of 34.8/10 000 persons at risk (95% CI 34.4 to 35.1). The proportion of children who attended ED with a burn, in 18 units with an on-site burns facility, was significantly greater (0.93% (95% CI 0.91 to 0.95)) than in the 25 EDs without such facilities (0.87% (95% CI 0.85 to 0.89); p<0.001) (two-sample proportion test)).
Hospital admissions
The estimated incidence of HA was 6.0 per 10 000 persons at risk (95% CI 5.9 to 6.2) in England, 3.1 (95% CI 2.7 to 3.8) in Wales, 3.1 (95% CI 2.7 to 3.5) in Scotland and 2.8 (95% CI 2.4 to 3.4) in NI (0–19 years). There was a significant difference between the English and Welsh/Scottish/NI incidence (IRR 1.95 (95% CI 1.67 to 2.28), IRR 1.94 (95% CI% 1.72 to 2.19), IRR 2.11 (95% CI 1.78 to 2.52), respectively) (table 3). Combining population data from England, Wales and Scotland, where data for the same age range were available, there was an overall rate of 5.6/10 000 persons at risk (95% CI 5.5 to 5.8), and >75% of these children were <5 years of age (table 2).
The rate of admission to Burns Units in Wales was 1.2/10 000 persons at risk (95% CI 1.0 to 1.6) admissions which was significantly lower than England at 2.1 (95% CI 2.1 to 2.2; IRR 0.58 (0.45 to 0.74)) (online supplementary appendix 2), with 77.7% aged <5 years of age (online supplementary appendix 1).
Overall there were an estimated 6 639 HAs annually in the England, Wales and Scotland, of which 2 277 in England and Wales were admitted to Specialist Burns Units (table 2).
Mortality
Between 2013 and 2015, there were 12 childhood burn fatalities in the UK, half involving children <5 years. Overall mortality rate was 0.1/1 0 00 000 persons (95% CI 0.06 to 0.2). There were no significant differences in annual mortality rates between England and Wales compared with Scotland (IRR 0.42 (95% CI 0.09 to 3.93)) (table 4). In the UK overall, there were 1–6 deaths per year.
Discussion
This is the first comprehensive description of the annual incidence of childhood burns in the four UK countries across the spectrum of healthcare provision and mortality. Childhood burns result in an estimated 1–6 UK deaths, 6639 HAs (excluding NI), 2277 of which were Specialist Burns Units in England and Wales, 37 703 EAs in England and Wales and 19 574 UK PC attendances annually (figure 1). Children <5 years of age represent the majority across all settings, the proportion of which increased with an increased level of specialised healthcare setting. In 2014, children <5 years of age represented 48.3% (589/1219) of PC attendances (UK), 66.7% of EAs (England and Wales only), 75.1% (4992/6639) of HA (excluding NI) and 77.5% (1764/2277) of HAs to Burn Services (England and Wales only) (table 2).
This study identified low estimates of burn mortality, consistent with other regional and English publications.9 21 There has been a downward trend in burn mortality across Europe,3 which could be attributed to progress in treatment strategies, first aid initiatives and building regulations (which have reduced the number of house fires and regulated water temperatures to reduce scalds).22 23 Similarly, there appears to be a reduction in EAs over recent years, as seen when comparing our 2014 estimate for EA in England and Wales of 37 703 children aged 0–15 years, with 2002 incident surveillance data (a broad UK estimate of EAs for burns in children) of 50 000 children aged 0–14 years.24 However, a direct comparison cannot be made due to differing age ranges and countries included.
There are no published studies that we are aware of assessing HAs due to burns in children within the same age range of 0–15 years. However, our findings for children aged 0–4 are consistent with Baker et al, who estimated a rate of 12.7/10 000 person-years in 2012/2013 in England.10 In our data set, rates for England for HA in children aged 0–15 years (including to Specialist Burns Units) are almost double the rate for other UK countries. Reasons for this are unclear, but, as much of the service provision for severe paediatric burns from North and Southeast Wales is within England, this may explain lower rates within Wales. England has higher rates of ethnic minorities25–27 which could be a contributing factor as previous studies have found children from ethnic minorities have a higher risk of burns.12 28 29 There was also a higher incidence of burn EAs in England compared with Wales, which may be due to more PC attendances, fewer burns or a higher threshold for seeking medical attention. Our extrapolation of national English EA data from a sample of EDs may be an overestimation.
A previous study using CPRD data estimated the incidence of PC events to be approximately twice as high as those in our study at 34.1/10 000 persons at risk. This is likely to be because CPRD uses a range of sources within PC records, including information from secondary and tertiary care such as clinic letters. In an attempt to ensure that our CPRD figures represented solely PC attendances for burns, we excluded patient administration, referrals and treatments. The higher figures may also be due to a wider age group (0–24 years) and data dating back to 1997.30 Similarly, the same group found a higher incidence among those aged 0–4 years at 50 per 10 000 person-years for 2012–2013.10 As in our study, the latter identified a decreasing annual incidence figure for burns attending PC. There were higher rates of EAs compared with PC. This could be explained by increased incidence of burns at weekends and in the evenings.31 It could also be hypothesised that parents require immediate attention and EDs are seen as more easily accessible and appropriate.
Despite the apparent improvements in the trends of burn incidence across all healthcare settings, burn injuries still present a significant health burden. This study combined with other literature begins to identify the key target groups for prevention strategies. As identified within the Public Health England strategy for injury prevention,32 we also reiterate that prevention efforts must focus on young children (<5 years), who have approximately six times the rate of HAs, and 1.5 of PC consultations for burns compared with the oldest age group (10–15 years). Previous studies have attributed this to increasing independent mobility, curiosity and lack of danger awareness.29 33 34 Future prevention strategies should include parental education including awareness of changing hazards around the house and improved household product design. Further studies could provide evidence about the efficacy of different prevention strategies in reducing the incidence of burns in children under 5 years.
Using a range of data sources allowed us to estimate the full spectrum of burns treated across the UK. Previous data-linkage studies between PC and HAs may underestimate EAs.9 10 35 Data from PERUKI (England) and EDDS (Wales) offered an opportunity to estimate EA incidence, but these PERUKI figures may be biased towards specialist paediatric units and we did not have sufficient data to include Scotland and NI.
Study limitations include restricted information available. We were unable to separate English and Welsh mortality data, or separate data by age groups of interest. Age bands, time periods, definitions of burns and coding systems varied between sources. CPRD data may under-represent practices in Northeast England, East midlands, Yorkshire and The Humber.36 37 In order to calculate incidence within CPRD a time window was used. However, our analysis of PC attendance showed that extending it would make little difference.9
Burn identification is reliant on accurate documentation by the clinical doctor seeing the patient and completing the records and such completeness of incidence produced by data sets is dependent on this documentation. There is a possibility that cases of burns may have been missed due to failure to document or code burns; however, we assume that this happens uncommonly. There is the possibility that a child has attended the ED or been admitted with the same burn on more than one occasion, potentially inflating incidence figures. Furthermore, many of the burns will be counted in more than one data set, for example, most HAs will also be seen in ED or at the general practice. However, data are representative of the burden of burns in each setting, each attendance will require resources, thus capturing every burn episode is important. Pellatt et al have shown that the cost of burn care is considerable.38
In the absence of UK or European-linked burn surveillance systems,39 multiple sources must be used to form a complete picture for surveillance. There remains a need for the NHS, across all settings, to use standardised burn classifications, and record burn incidence and mortality. National EA data were particularly challenging to collect but a new national data set of EAs, the Emergency Care Dataset and the widespread introduction of electronic records has the potential to improve the national picture.40 A comprehensive analysis of childhood burns would include those treated at home. A recent study of historical data 1991–2002 estimated annual incidence of parental-reported burns among those aged 0–2 years as 71.9/1000/year, and estimated that of those 11% sought medical advice.41
In conclusion, while the incidence of fatal burns is low, an excess of children sustain burns annually. EDs see the majority of children with burns, with nearly twice as many children attending compared with PC, and nearly a sixth of those attending the ED requiring hospital admission. Childhood burns are largely preventable, thus future policy interventions need to be aimed at reducing this burden. This unique data set provides a baseline against which public health prevention measures can be evaluated. Nonetheless, a national burn surveillance system across all healthcare settings would set a gold standard in continuing epidemiological research on burns and the evaluation of prevention strategies.
What is already known on the subject
Some estimates of childhood burn incidence within the UK have been made, although the majority of studies focus on those attending emergency departments.
Previous studies have found higher rates of childhood burns in children under 5 years.
What this study adds
Approximately 64 000 medical attendances are for childhood burns every year, of which 1–6 are fatally injured, and the majority attend emergency departments.
There appeared to be a significantly greater rate of emergency and hospital attendances for burns in England than in any of the remaining UK countries.
Seventy-five per cent of those attending hospital are aged <5 years, where the proportion increased with the level of specialised healthcare setting.
References
Footnotes
Collaborators The following actied as PERUKI site lead investigators and were responsible for co-ordinating local processes and submission of data: R Alcock (Forth Valley Royal Hospital, Larbert); M Anderson (Great North Children’s Hospital, Newcastle); Y Baki (University College Hospital, London); M Barrett (Our Lady’s Children’s Hospital, Crumlin); J Bayreuther (University Hospital Southampton); C Bevan (Royal Alexandra Children’s Hospital, Brighton); T Bolger (Tallaght Children’s Hospital, Tallaght); A Brown (Southmead Hospital, Bristol); J Browning (Royal Hospital for Sick Children, Edinburgh); M Buchanan (Arowe Park Hospital, Liverpool); D Burke (Sheffield Children’s Hospital); F Cantle (King’s College Hospital, London); M Clark (The Royal London Hospital); J Criddle (The Evelina Hospital, London); K Dickson-Jardine (Morriston Hospital, Swansea); A Downes (Leeds General Infirmary); S Floyd (Western Sussex Hospitals NHS Foundation Trust); J Foot (Musgrove Park Hospital, Taunton); S Foster (Royal Hospital for Children, Glasgow); J Furness (County Durham and Darlington NHS Foundation Trust); E Gilby (Royal United Hospital, Bath); C Gough (Nottingham Children’s Hospital); S Gupta (North Manchester General Hospital); J Hacking (Chelsea and Westminster Hospital, London); S Hartshorn (Birmingham Children’s Hospital); Y Iqbal (St George’s Hospital, London); M Jacobs (Watford General Hospital); K Lenton (Salford Royal Hospital); I Maconochie (St Mary’s Hospital, London); JA Maney (Royal Belfast Hospital for Sick Children); R McNamara (Temple Street Children’s University Hospital, Dublin); S Messahel (Alder Hey Children’s Hospital); J Mulligan (Crosshouse Hospital, Kilmarnock); N Mullen (Sunderland Royal Hospital); S Owens (Northumbria Healthcare NHS Foundation Trust); G Patton (Royal Aberdeen Children’s Hospital); K Potier (Royal Manchester Children’s Hospital); D Rea (Bristol Royal Hospital for Children); A Reuben (Royal Devon and Exeter Hospital); Z Roberts (Children’s Hospital for Wales); G Robinson (Royal Derby Hospital); D Roland (Leicester Royal Infirmary); T Sajjanhar (University Hospital Lewisham); A Scott (James Cook University Hospital, Middlesbrough); J Smith (Derriford Hospital, Plymouth); C Vorwerk (Queen Alexandra Hospital, Portsmouth); S Wong (Royal Free Hospital, London).
Contributors None.
Funding This work was not directly funded but supported by researchers from The Centre for Children’s Burns Research is part of the Burns Collective, a Scar Free Foundation initiative with additional funding from Health and Care Research Wales. HJ is supported by The Farr Institute CIPHER, funded by Arthritis Research UK, the British Heart Foundation, Cancer Research UK, the Economic and Social Research Council, the Engineering and Physical Sciences Research Council, the Medical Research Council, the National Institute of Health Research, the National Institute for Social Care and Health Research (Welsh Assembly Government), the Chief Scientist Office (Scottish Government Health Directorates), and the Wellcome Trust (MRC Grant No: MR/K006525/1).
Competing interest No authors have conflicts of interest relevant to this article to disclose. The corresponding author has the right to grant on behalf of all authors and does grant on behalf of all authors, an exclusive licence (or non-exclusive for government employees) on a worldwide basis to the BMJ Group and co-owners or contracting owning societies (where published by the BMJ Group on their behalf), and its Licensees to permit this article (if accepted) to be published in Injury Prevention and any other BMJ Group products and to exploit all subsidiary rights, as set out in our licence.
Patient consent for publication Not required.
Ethics approval ISAC approval was received September 2016 for CPRD data (protocol number 16_199).
Provenance and peer review Not commissioned; externally peer reviewed.
Data sharing statement PERUKI data from Wales, Scotland and Northern Ireland, not included in the manuscript, can be available on request through the corresponding author.