Article Text

Abstract
Background The WHO advocates a 7-step process to enable countries to develop and implement drowning prevention strategies. We sought to assess, using existing data sources, the drowning situation in Tanzania as a first step in this process.
Methods We searched for data on causes of death in Tanzania by reviewing existing literature and global datasets and by in-country networking. Authors and institutions were then contacted to request aggregate data on drowning mortality. Site-specific drowning estimates were combined using a random effects meta-analytic approach. We also tested for evidence of variations in drowning estimates by sex and by age group.
Results We acquired partial or complete information on drowning deaths for 13 data sources. We found strong evidence for substantial variations between study sites (p<0.001). Combining population-based data, we estimated an average of 5.1 drowning deaths per 100 000 persons per year (95% CI 3.8 to 6.3). The proportions of deaths due to drowning were 0.72% (95% CI 0.55 to 0.88) and 0.94% (95% CI 0.09 to 1.78) combining population-based data and hospital-based data, respectively. Males were at greater risk than females, while both under-five children and adults aged 45 years or more were at greater risk than those aged 5–44 years.
Conclusion Our estimates of drowning burden are broadly in line with the 2016 Global Burden of Disease and the 2015 WHO Global Health Estimates. While this exercise was useful in raising the burden of drowning in Tanzania with policy makers, planning drowning prevention strategies in this country will require a better understanding of which subpopulations are at high risk.
- drowning
- metanalysis
- mortality
- systematic review
- community
This is an open access article distributed in accordance with the Creative Commons Attribution Non Commercial (CC BY-NC 4.0) license, which permits others to distribute, remix, adapt, build upon this work non-commercially, and license their derivative works on different terms, provided the original work is properly cited, appropriate credit is given, any changes made indicated, and the use is non-commercial. See: http://creativecommons.org/licenses/by-nc/4.0/
Statistics from Altmetric.com
Background
In 2002, a consensus was reached among attendees of the first World Congress on Drowning to define drowning as ‘the process of experiencing respiratory impairment from submersion/immersion in liquids’.1 According to the Global Burden of Disease (GBD), worldwide in 2016, 4.1 drowning deaths occurred per 100 000 persons accounting for an estimated 302 932 deaths, of which 90% occurred in low-income and middle-income countries (LMIC).2 Among children aged 1 –4 years and 5–14 years, the GBD ranked drowning as the fifth and sixth leading cause of death with 3% and 6%, respectively, of all deaths due to drowning in each age group, respectively.
In 2014, the WHO, recognising drowning as a serious and neglected public health problem, recommended that ‘all countries should implement proven drowning prevention strategies, tailored to their specific circumstances and risk groups’.3 To develop such a strategy, the WHO advocates a 7-step process with step one being ‘Assess the drowning situation and raise awareness. If needed, establish data collection systems ensuring data on drowning is accurate, timely and inclusive’.
In Tanzania, the 2015 WHO Global Health Estimates (GHE) and 2016 GBD estimated annual average drowning mortality rates of 6.5 and 4.6 drowning deaths per 100 000 persons, respectively, which equate to 3454 and 2486 deaths annually. Both WHO GHE and GBD models estimated a higher risk of drowning death in males than females (8.9 and 6.1 drowning deaths per 100 000 persons, respectively, in males vs 4.0 and 3.0 drowning deaths per 100 000 persons, respectively, in females). According to the 2016 GBD, the highest risks of drowning death are experienced by children aged less than 1 year, 1–4 years, and adults aged 55 years or more (7.2, 6.5 and 12.5 drowning deaths per 100 000 persons, respectively). However, there is no national drowning prevention strategy in place. In Zanzibar, since 2014, the Royal National Lifeboat Institution (RNLI) has collaborated with local institutions to provide swimming and rescue skills teaching programmes as well as water safety education programmes for children aged 7–14 years old. The RNLI has also provided training in maritime search and rescue to the Tanzanian Sea Rescue and staff of the Zanzibar Maritime Authority. In support of the WHO recommendation, the RNLI also aims to provide practical guidance on the development of drowning prevention strategies. To support RNLI’s programmes in Tanzania, the London School of Hygiene and Tropical Medicine (LSHTM) and the Ifakara Health Institute (IHI) sought to assess, using existing data sources, the burden of fatal drowning in the country.
Methods
Setting
In 2015, the population of Tanzania was estimated at 53 880 000 inhabitants (https://esa.un.org/unpd/wpp), and Tanzania ranked 151 out of 188 countries on the United Nations Development Programme’s Human Development Index.4
In 2000, the Tanzanian health system adopted the DHIS-2 (District Health Information System) as a Health Management Information System (HMIS). At the community level, the Ward Executive Officer (WEO) is responsible for notifying deaths and their cause which occur under their jurisdiction and outside health facilities (http://www.aho.afro.who.int/profiles_information/index.php/Tanzania: Civil_registration_and_vital_statistics_systems). However, the latter is currently poorly implemented, and the Civil Registration and Vital Statistics (CRVS) system in Tanzania only captures a small proportion of all deaths in the country, mainly those reported by the HMIS at facility level (10% of deaths were registered with cause of death recorded for only 5% of deaths in 2014) (https://crvsgateway.info/file/5151/146). According to GBD estimates, the annual mortality rate declined from an estimated 1283 deaths per 100 000 inhabitants in 1990 to 713 deaths per 100 000 inhabitants in 2016 (http://ghdx.healthdata.org/gbd-results-tool).
The Indian Ocean coastline of the mainland is approximately 1420 km long, and Tanzania also has an abundance of inland water covering about 60 000 square kilometres or about 6% of the national surface area (https://en.wikipedia.org/wiki/List_of_lakes_of_Tanzania). Lake Tanganyika, Africa’s deepest and longest lake, lies along the western border, and Lake Victoria, the world’s second largest lake, runs along the northern border. Although there are many rivers, only the Rufiji River and the Kagera River are navigable by anything larger than a canoe. Tanzania has two major rainfall patterns and floods, as a result of heavy rains, are common across the country.
Data identification and acquisition
Between January and July 2017, we searched for data on causes of death in Tanzania by reviewing the existing literature and global datasets and by in-country networking. The literature review was developed in line with the Preferred Reporting Items for Systematic reviews and Meta-Analyses for Protocols 2015 (PRISMA-P 2015).5 We searched 13 bibliographic databases (Embase, Medline, Global Health, Web of Science, Scopus, Africa Wide Information, Pubmed, Popline, Desasters, Base, Open Grey, Eldis and New York Academy of Medicine Grey Literature Report) using the following combination of concepts: (‘cause of death’ OR ‘drowning death’) AND Tanzania using both text words and subject headings when applicable. Peer-reviewed journal articles and grey literature were included. Since our objective was to assess the current situation of fatal drowning, rather than historical trends, our search was restricted to literature published since 2000. No restrictions were applied regarding specific groups or ages or language. The search output from the Medline database is provided in the supplementary material (figure 1).

Literature search flow diagram.
Duplicate search results were deleted, and titles and abstracts were then reviewed by SS. When it was unclear whether the search output should be included, titles and abstracts were reviewed by SC too. Full texts were retrieved when the abstracts indicated data collection on causes of death or drowning deaths, regardless of the methods used to ascertain the causes. Articles reporting only all-cause mortality or causes of death in special subgroups (eg, perinatal causes of death) were excluded. Reference lists were also checked for missed eligible literature. Where the same data source was reported in multiple publications, the publication with the most detailed information was selected.
To complement these searches, we also searched online, open-access global databases providing information on causes of death, and we used in-country networking to identify data sources held by local institutions. A ‘brain storming’ meeting identified institutions of possible relevance which were then visited to confirm whether they held data on drowning deaths and to identify any other institutions using a ‘snowballing’ approach. The inclusion criteria for an institution to be considered were: (1) involvement in policy making, research, implementation or advocacy on matters related to public health and (2) potentially holding data on drowning deaths or causes of death.
Data sources were classified as: Relevant when recording causes of deaths, including drowning deaths; Potentially relevant when recording some causes of death but inclusion of drowning deaths was uncertain; Not relevant when not recording drowning deaths. Relevant and potentially relevant data sources were further classified as either population-based data, hospital-based data, report-based data from Tanzanian institutions or global databases.
The data acquisition stage lasted from June to December 2017. When the data of interest were not directly available (online or published), a data acquisition form was sent to all authors or institutions holding relevant or potentially relevant data sources, and a data sharing agreement was signed when necessary. Up to three follow-up requests were sent if no response was received. The data acquisition form was designed to compile the total numbers of all-cause deaths and drowning deaths by study site, year, sex and age group. We also requested the distribution of International Classification of Diseases 10th revision (ICD-10) codes to which drowning deaths were allocated, the total population studied and its age and sex distribution (population-based data sources only). We considered the full range of ICD-10 codes related to drowning deaths as recommended elsewhere6 (table 1).
ICD-10 classifications related to drowning deaths6
Analysis
Analyses were performed using Stata V.14. Population-based data, hospital-based data and report-based data were analysed separately since they were derived using different methodologies. For each individual study site, we calculated the proportion of deaths due to drowning (population-based and hospital-based data) and the average annual drowning mortality rate (population-based data only). Site-specific estimates were then combined using a random effects meta-analytic approach to obtain summary estimates, together with their 95% CIs. The I2 statistic and the p value for between-site heterogeneity were examined for evidence of variation across study sites.
When examining drowning patterns by age and sex, the absence of any drowning deaths in a number of age or sex subgroups in some sites prevented us using a similar approach to obtain summary estimates in these subgroups. We therefore used random effects logistic and Poisson regression to obtain summary estimates, by sex and age group, of the proportion of deaths due to drowning and of the annual drowning mortality rate, respectively. Likelihood ratio tests provided evidence for variation in summary estimates by sex and age group. We also grouped study sites into those located on the mainland (away from coast and major lakes), sites located on the Indian Ocean coastline and sites located near a major lake, and we tested for evidence of differences by type of geographical location. When available, the proportional distribution of ICD-10 codes allocated to drowning deaths was also calculated.
Results
Data identification and acquisition
Across the 13 bibliographic databases, 1412 unique hits were identified after removing duplicates. Screening of abstracts identified 66 publications worthy of full text review. From this review, 43 relevant publications and 14 potentially relevant publications were identified. From these publications, 9 relevant data sources and 13 potentially relevant data sources were identified, with the difference between the number of publications and the number of data sources attributable to multiple publications from a given data source (figure 1,online supplementary material — tables 1 and 2). Note that because of poor implementation of the CRVS system at community level, we focused on drowning deaths reported at facility level through the electronic DHIS-2 HMIS. To these data sources, the in-country networking added two relevant data sources and six potentially relevant data sources which were not identified by the literature search online supplementary material — table 3. In addition, three online, open-access global databases were identified as relevant data sources: The Emergency Events Database (EM-DAT) (http://www.emdat.be/), the 2016 GBD database (http://ghdx.healthdata.org/gbd-results-tool) and the 2015 WHO GHE database (http://www.who.int/healthinfo/global_burden_disease/estimates/en/index1.html). Overall, we therefore identified 14 relevant data sources and 19 potentially relevant data sources.
Supplemental material
Of the 14 relevant data sources, 4 were directly available online and 10 requests were sent to authors or institutions, from whom we received 4 replies with partial or complete information on drowning deaths (figure 2). For three data sources for which no reply was received, the publications reported some information on drowning death.

Flow diagram for data acquisition of relevant data sources. AMMP, Adult Mortality and Morbidity Project; EM-DAT, Emergency Events Database; GBD, Global Burden of Disease; HDSS, Health and Demographic Surveillance Systems; SAVVY, Sample Vital registration with Verbal autopsy; SUMATRA, Ministry of Transport Surface and Marine Regulatory Authority; WHO GHE, WHO Global Health Estimates.
A request for data acquisition was sent to all authors or institutions holding potentially relevant data sources. Eleven out of 19 authors or institutions replied: 2 provided incomplete drowning data and 9 data sources were reclassified as not relevant (figure 3). Among the latter, the electronic DHIS-2 HMIS, although capturing causes of deaths reported in health facilities, was reclassified as not relevant because drowning deaths were grouped in injury deaths and could not be disaggregated. Other reasons why potentially relevant data sources were reclassified as not relevant included: data collection in specific population subgroups or no formal registers or statistics on mortality data.

Flow diagram for data acquisition of potentially relevant data sources. FBIS/DHIS-2 HMIS, Facility-Based Information System/District Health Information System-2 Health Management Information System.
Other relevant and potentially relevant data sources for which no reply was received and the publication, if any, did not report any information on drowning deaths were excluded.
By the end of the data acquisition stage, we acquired partial or complete information on drowning deaths for 13 relevant data sources: 6 population-based,7–12 3 hospital-based,13–15 1 report-based and 3 global databases (table 2). Complete, aggregate-level data were acquired for three population-based data sources7–9 and one hospital-based data source13 with only a few missing values recorded for sex (2.8% or less) and age group (4.2% or less).
Relevant data sources acquired and completeness of drowning mortality
Drowning mortality estimates
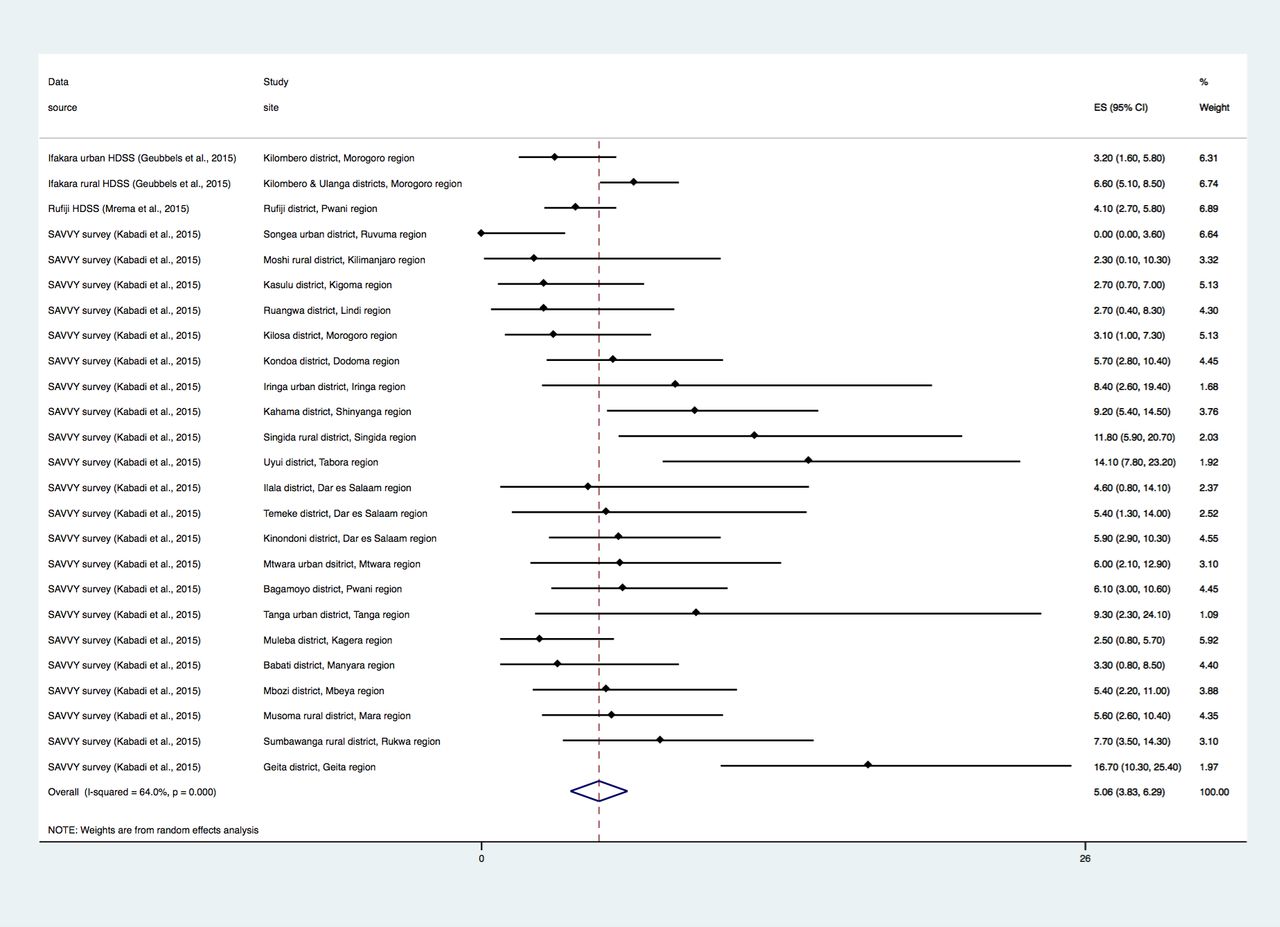
Across the population-based data, we found strong evidence for substantial geographical variation between study sites, from 0 to 16.7 drowning deaths per 100 000 persons-year on average in Songea urban and Geita districts, respectively (p<0.001) (figure 4). The proportion of deaths due to drowning ranged from 0% to 1.84% in Songea urban and Geita districts, respectively (p=0.003), figure 5, online supplementary material — figure 2a. There was also strong evidence of variation in the proportion of deaths attributed to drowning across hospital based data: from 0% in Bugando Medical Centre to 4.16% on Pemba island (p<0.001) (figure 6, online supplementary material — figure 2b). We observed no evidence of variation in the annual average drowning mortality rate (p=0.822) or in the proportion of deaths due to drowning (p=0.807) between sites located on the mainland (away from coast and major lakes), sites on the Indian Ocean coastline or sites near a major lake.
Supplemental material

Annual average drowning mortality rates by study site; ICD-10 codes V90–Y21 included (population-based data). ES, estimate; HDSS, Health and Demographic Surveillance Systems; ICD-10, International Classification of Diseases 10th revision; SAVVY, Sample Vital registration with Verbal autopsy.
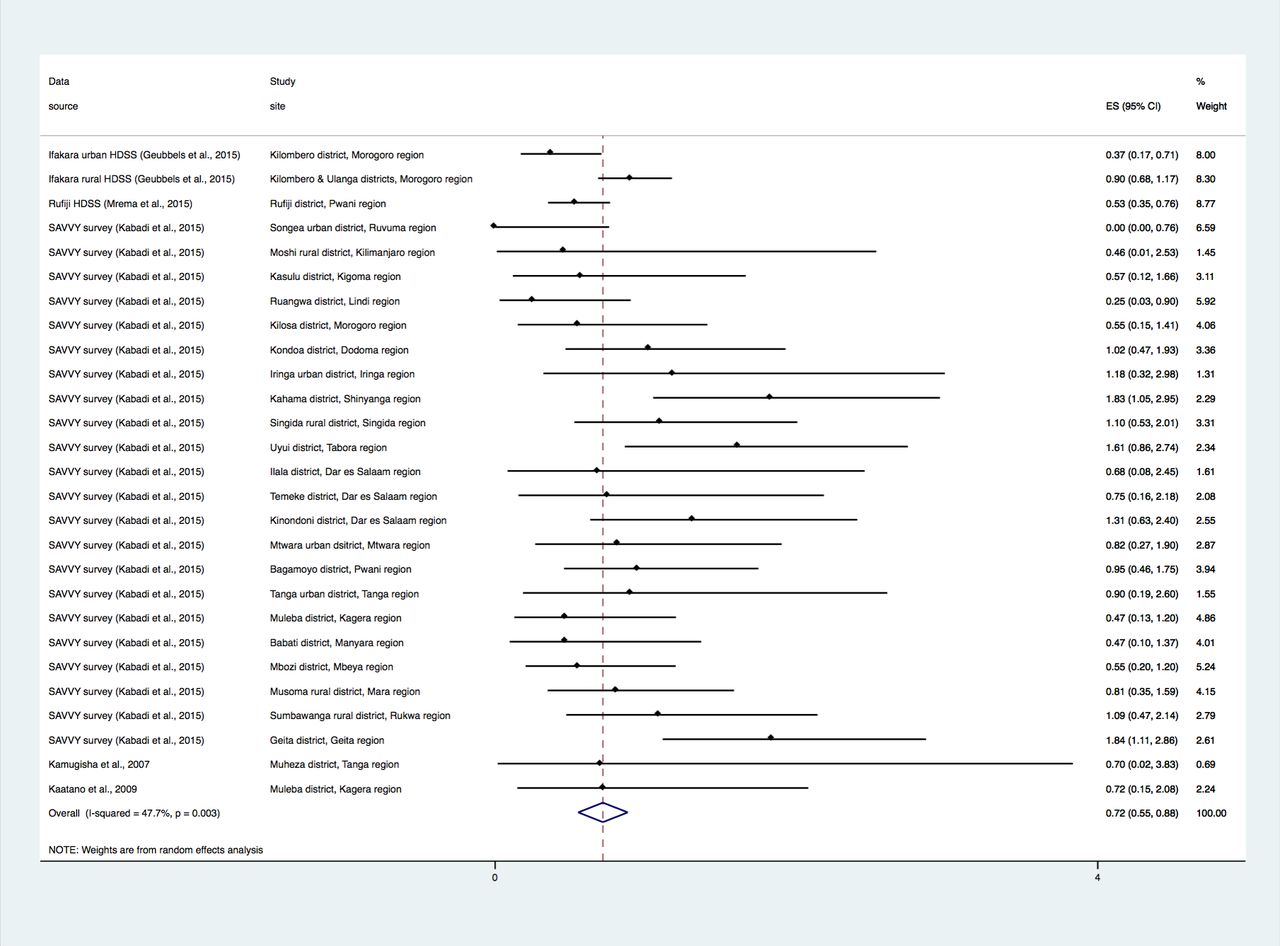
Proportion of all-cause deaths due to drowning by study site; ICD-10 codes V90–Y21 included (population-based data). ES, estimate; HDSS, Health and Demographic Surveillance Systems; ICD-10, International Classification of Diseases 10th revision; SAVVY, Sample Vital registration with Verbal autopsy.
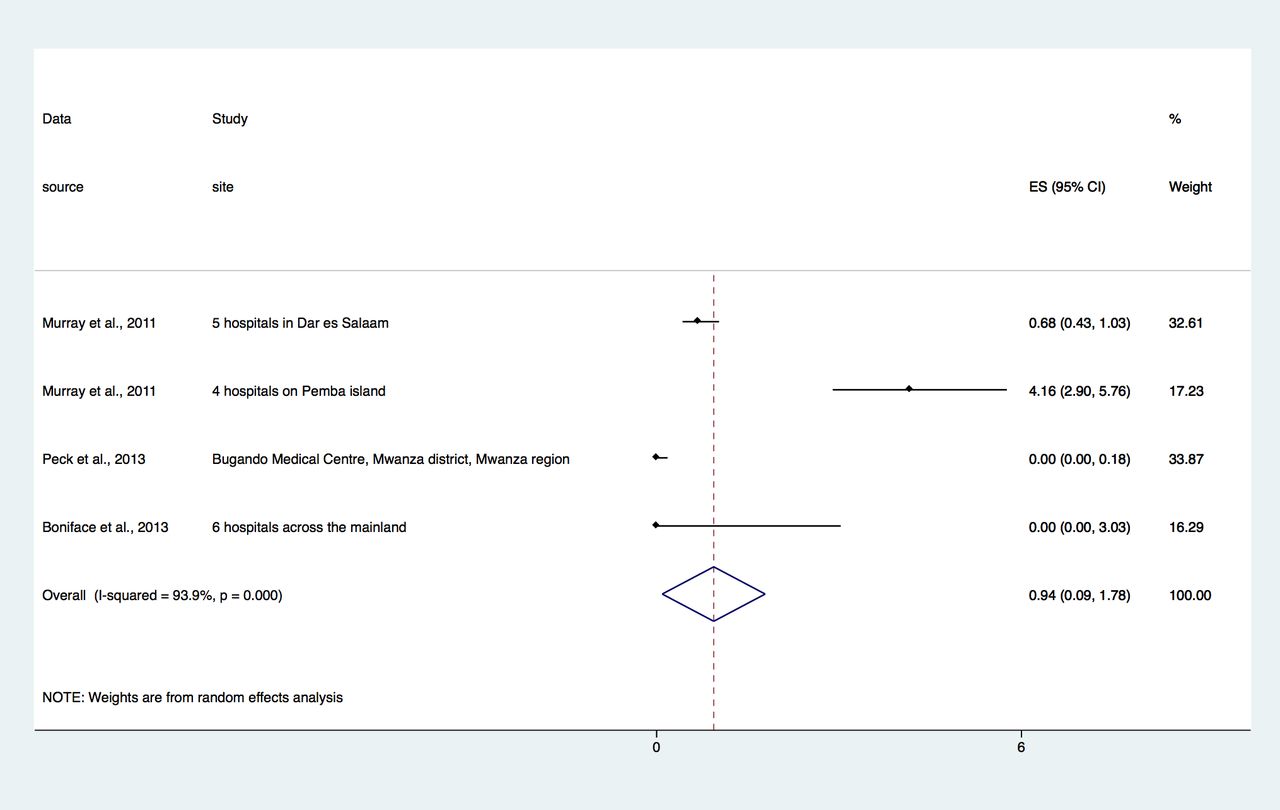
Proportion of all-cause deaths due to drowning by study site (hospital-based data). ES, estimate.
Combining population-based data and including the full range of drowning related ICD-10 codes results in an estimated average annual drowning mortality rate of 5.1 per 100 000 inhabitants (95% CI 3.8 to 6.3; figure 4, table 3). When restricting analyses to the range of ICD-10 codes allocated to drowning deaths as included in the WHO GHE and 2016 GBD estimates (codes W65–W70 and W73–W74), the annual average rate was reduced by 16% to 4.3 per 100 000 persons (95% CI 3.3 to 5.4) (table 3). Taking the 2015 UN population estimate, these figures translate into 2317 and 2748 drowning deaths per year, respectively. Combining population-based data, the proportion of deaths due to drowning was 0.72% (95% CI 0.55 to 0.88) and 0.60% (95% CI 0.46 to 0.73) when using the full and restricted range of ICD-10 codes, respectively (figure 5). Combining hospital-based data, this proportion was 0.94% (95% CI 0.09 to 1.78), figure 6. At the national level, the 2016 GBD and the 2015 WHO GHE models estimated 4.6 (95% CI 3.7 to 5.6) and 6.5 drowning deaths per 100 000 persons-year on average, respectively (equating to 3454 and 2486 deaths annually) and 0.64% (95% CI 0.55 to 0.76) and 0.83% of all-cause deaths due to drowning, respectively.
Overall drowning mortality estimates
In addition, the report-based data from the Ministry of Transport Surface and Marine Regulatory Authority (SUMATRA) recorded 797 deaths in Tanzanian territorial waters over a 11-year period (72 deaths on average per year) and the EM-DAT global database recorded 911 deaths due to 32 water-related disasters over a 17-year period across Tanzania (54 deaths on average per year), of which 56% were floods (n=18) and 38% were water-transport accidents (n=12) (table 3).
Both population-based and hospital-based data provided evidence for a difference by sex and age group with patterns consistent with those reported in the 2016 GBD and 2015 WHO GHE. Combining population-based data, we found annual average rates of 8.3 per 100 000 males (95% CI 6.6 to 10.6) vs 3.9 per 100 000 females (95% CI 2.9 to 5.2) (p<0.001) (table 4, online supplementary material — table 4). In males and females, 1.00% (95% CI 0.79 to 1.26) and 0.55% (95% CI 0.41 to 0.72) of deaths respectively were due to drowning in population-based data (p<0.001), and 2.62% (95% CI 0.75 to 8.74) and 0.73% (95% CI 0.19 to 2.77), respectively, in hospital-based data (p<0.001).
Drowning mortality estimates by sex
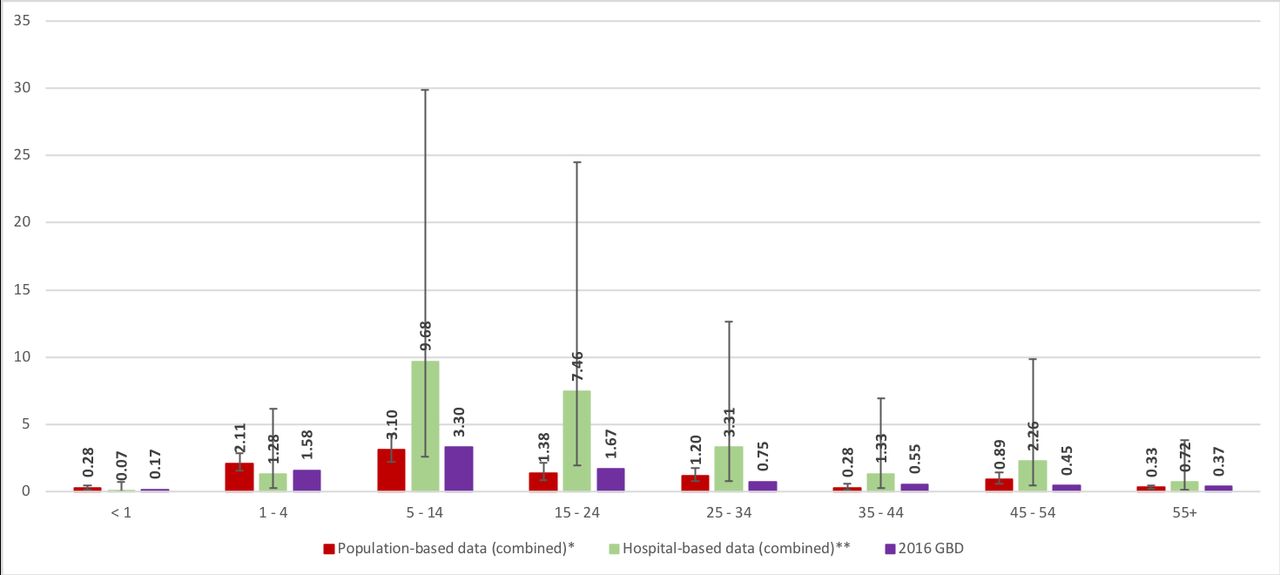
By age group, the annual average drowning mortality rate ranged from 2.1 per 100 000 persons (95% CI 1.0 to 4.3) in adults aged 35–44 years old to 14.6 per 100 000 persons (95% CI 10.7 to 19.8) in children 1–4 years old (p<0.001), (figure 7, online supplementary material — figure 3a). The proportions of deaths due to drowning ranged from less than 1% to 3.10% (95% CI 2.23 to 4.30) in children 5–14 years old in population-based data (p<0.001) and from less than 1% to 9.68% (95% CI 2.63 to 29.86) in children 5–14 years old in hospital-based data (p<0.001), (figure 8, online supplementary material — figure 3b).

Annual average drowning mortality rate per 100 000 persons by age group. *Ifakara HDSS, Rufiji HDSS, SAVVY survey. GBD, Global Burden of Disease; HDSS, Health and Demographic Surveillance Systems; SAVVY, Sample Vital registration with Verbal autopsy.

Proportion of deaths due to drowning (%) by age group. *Ifakara HDSS, Rufiji HDSS, SAVVY survey; **Murray et al, 201113. GBD, Global Burden of Disease; HDSS, Health and Demographic Surveillance Systems; SAVVY, Sample Vital registration with Verbal autopsy.
Almost a third of drowning deaths were allocated to each of the codes W74 ‘unspecified drowning and submersion’ (31.8%) and W69 ‘drowning and submersion while in natural water (lake, open sea, river and stream)’ (29.7%) (table 5, online supplementary material — figures 4a–c. It is noteworthy, however, that across sites located on the Indian Ocean coastline, only 12.1% of drowning deaths were allocated the code W74 ‘unspecified drowning and submersion’, while, concurrently, 54.5% of drowning deaths were allocated the code W69 ‘drowning and submersion while in natural water’. Data from the four sites located on the Indian Ocean coastline were all collected through the Sample Vital registration with Verbal autopsy (SAVVY) survey. The latter allocated only 25.9% of drowning deaths to the code W74 (across the 22 districts) compared with 39.3% and 43.1% in Rufiji and Ifakara Health and Demographic Surveillance Systems (HDSS) on the mainland, respectively.
Proportional distribution of ICD-10 codes allocated to drowning deaths
With respect to other ICD-10 codes, around 10% of drowning deaths were allocated to each of the codes W73 ‘other specified drowning and submersion (quenching tank, reservoir)’ (11.3%), W70 ‘drowning and submersion following fall into natural water’ (9.6%) or X36 ‘victim of avalanche, landslide and other earth movements’ (8.8%), the latter having been exclusively reported in the Ifakara rural HDSS. Overall, 84% of drowning deaths were allocated one of the ICD-10 codes from W65–W70 and W73–W74 (as included in WHO and GBD estimates). With the exception of the code X36 related to victims of earth movements, other codes related to intentional drowning deaths (X71, X92 or Y21), water-transport (V90 or V92) or victims of cataclysmic storm, flood or other and unspecified forces of nature (X37–X39) were rarely allocated (2% or less).
Discussion
Our findings revealed large variations in drowning mortality across study sites within Tanzania: from 0 to an average of 16.7 drowning deaths per 100 000 persons-year in Geita district bordered by the Lake Victoria. The highest proportion of deaths due to drowning was observed on Pemba island, where 4.2% of all recorded deaths at four hospitals were attributed to drowning (rising to 20.8% in young people aged 15–24 years). National 2016 GBD and 2015 WHO GHE estimates place drowning mortality in Tanzania around or below the average for sub-Saharan Africa estimated at 4.9 and 8.8 drowning deaths per 100 000 persons, respectively. Nevertheless, estimates such as the one observed in Geita district are comparable to the 2016 GBD and 2015 WHO GHE estimates in Bangladesh (9.1 and 11.9 drowning deaths per 100 000 persons-year with 1.7% and 2.2% of deaths due to drowning respectively) where the burden of drowning is known to be high.
In addition, the SUMATRA data and the EM-DAT global database recorded, respectively, an annual average of 72 deaths related to maritime water-transport accidents in the Tanzanian territorial waters (around 3% of the estimated total drowning deaths per year) and an annual average of 54 deaths due to water-related disasters (around 2% of the estimated total drowning deaths per year), mainly floods and water-transport accidents. However, these data likely understate the number of deaths. The SUMATRA data only captured deaths related to large (>4 m) sunken vessels, excluding all smaller vessels, for instance, those used by some fishing communities. It is also likely that deaths as a consequence of illegal practices (eg, overloading, illegal fishing or carriage of passengers) were not reported due to the fear of sanctions. With respect to the EM-DAT database, water-related disasters were recorded only when 10 or more individuals died or 100 or more individuals were affected or a state of emergency was declared or international assistance called for.
Combining population-based data, we estimated that, on average and across study sites, 4.3 drowning deaths occurred per 100 000 persons-year when restricting drowning deaths allocated the ICD-10 codes W65–W70 and W73–W74 (as in the WHO GHE and GBD), compared with 5.1 drowning deaths per 100 000 persons-year when considering the full range of ICD-10 codes related to drowning deaths. Taking the 2015 UN population estimate, these figures translate into 2317 and 2748 drowning deaths per year, respectively. A 16% relative difference between drowning mortality rate estimates is not negligible and the full range of ICD-10 codes should therefore be included when estimating the burden of fatal drowning. The proportion of all-cause deaths due to drowning was 0.6% combining population-based data and 0.9% combining hospital-based data. It is noteworthy, however, that out of the three hospital-based data sources, two relied on medical records of outpatient attendances or inpatient admissions and revealed no drowning deaths,14 15 which is unsurprising given that very few victims of drowning are likely to reach hospital while still alive. By contrast, the third data source13 included data from mortuary record and revealed some drowning deaths.
Our estimates, although based on data collected from a few sites across Tanzania only and at different time points between 2008 and 2014, are broadly in line with the 2015 WHO GHE and 2016 GBD national estimates of 6.5 and 4.6 drowning deaths per 100 000 persons, respectively (0.8% and 0.6% of deaths due to drowning). This is perhaps not surprising as both modelling exercises likely use the HDSS data as input data and raises questions about the added value of our approach. Nevertheless, we were able to highlight substantial geographical variation in the burden of fatal drowning across Tanzania which both WHO GHE and GBD fail to reveal. In addition, such variation together with the lack of a nationally representative sample highlight the challenge of coming up with a reliable national estimate.
We found a higher mortality rate from drowning in males than females, and a pattern of higher mortality in under-five children and adults aged 45 years or more, fairly consistent across population-based data sources and with the 2016 GBD and 2015 WHO GHE estimates. According to the 2016 GBD in Tanzania, drowning ranked as the 8th and 10th leading cause of death in children aged 5–14 years and in children aged 1–4 years, respectively (with 1.6% and 3.3% of total deaths due to drowning, respectively). While malaria, lower respiratory infections, diarrhoeal diseases, malnutrition or HIV/AIDS remain among the leading causes of deaths in these age groups, it is noteworthy that drowning ranks before or just after road injuries (15th and 7th in children 1–4 and 5–14 years, respectively) and contributes also substantially to child mortality in Tanzania. Higher proportions were observed across hospital-based data, particularly in children 5–14 years old (9.7%) and adolescents 1524 years old (7.5%). A literature review of data from LMICs16 and surveillance data from China17 also identified young males as the population at highest risk of drowning. Males are more frequently employed on boats and in water-centric jobs and often have riskier behaviour than females. Young children can drown very quickly, in very little water, and in water containers that may not be perceived as hazards (eg, a bucket). In the Indian state of Bihar, a population-based survey among children aged 1–14 years also found that boys had a higher risk of drowning than girls overall, but that among children aged 1–4 years girls were at higher risk than boys.18
We, however, did not identify specific communities at higher risk, such as fishermen or other people involved in water centric jobs. Although some of the highest drowning mortality rates were observed in districts located near a major lake or on the Indian Ocean coastline, we did not observe clear evidence for a systematic difference by type of geographical location. Iringa urban, Kahama, Singida rural and Uyui districts, all located on the mainland, away from coast and major lakes, had high drowning mortality rates, between 8.4 and 14.1 drowning deaths per 100 000 persons per year. These findings reflect the fact that small water bodies such as wells, ponds or streams pose a drowning risk. On the other hand, not all districts on the Indian Ocean coastline or near a major lake had a high drowning mortality rate. Individual-level data could facilitate the detection of communities particularly at risk by using a finer categorisation of proximity to water and by investigating individual risk factors, such as employment, socioeconomic status, place of residence or seasonality. Two surveys conducted in Ugandan districts bordered by Lake Victoria among fishing communities19 or people disembarking from boats20 reported high drowning mortality rates, at 24 and 502 drowning deaths per 100 000 persons per year, respectively. In the latter study, the majority of drowning events were reported to have occurred during transportation (52%) or fishing activities (39%). Among interviewed people, only 26% wore life jackets, only 49% could swim and 73% did not know how to call for rescue.
Another limitation includes the lack of information obtained on the circumstances surrounding drowning deaths. The distribution of ICD-10 codes allocated to drowning deaths revealed little about this. About a third of drowning deaths were allocated the code W74 ‘unspecified drowning and submersion’, nearly 40% of drowning deaths occurred in natural water (code W69 or W70), such as lake, open sea, river and stream. About 1 drowning death in 10 occurred in other specified water bodies, such as quenching tank or reservoir (code W73). HDSS collected verbal autopsy data which, with some investment, could be reviewed to gain a better understanding of the circumstances of drowning deaths. One contacted author provided a useful narrative on the three drowning deaths recorded in his study:12 ‘The first two drowning victims were males in their twenties, both of them with drowning accident caused by overturning fishing boat. The third victim was a 2 years old boy who drowned by accidentally falling in a big bucket’ . In LMICs, a literature review identified small bodies of water, rural areas, proximity to home and daytime as the most common circumstances of drowning deaths.16 In rural communities of LMICs, streams and ponds are often used for bathing, washing or children’s play. Cisterns and wells are also common source of water, generally close to the home and frequently uncovered. In the Indian state of Bihar, nearly half of drowning deaths among children aged 1–14 years occurred in a river, a third or more while playing or bathing.18
Using the proposed approach to assess the drowning situation in Tanzania faced a number of challenges. Only 15 out of 29 authors or institutions (52%) responded to our requests for information. The biggest challenge was, however, the scarcity of data on drowning deaths. In Tanzania, drowning mortality is not among the national health priorities and consequently, drowning tends to be overlooked and in-country data sources were scarce. We, nevertheless, identified opportunities for future assessments of drowning mortality. Since July 2017, the HMIS has started to disaggregate injuries and could be a useful data source in future, even though this will not capture victims or bodies not brought to a facility. At the community level, the WEO is responsible for notifying deaths and their cause occurring under their jurisdiction and outside health facilities. Currently poorly implemented, strengthening this system would complement the HMIS. Beach Management Units also offer an opportunity for recording drowning deaths among fishermen. Meanwhile, four HDSS are operating in Tanzania and offer platforms for conducting research on drowning in the country.
It is likely that in most LMICs, where drowning is not among the national health priorities, existing data on drowning mortality will also be scarce and that similar challenges will be faced in their acquisition. This, together with the fact that our estimates lie somewhere in between the GBD and WHO GHE estimates, raises questions about the added value of our approach to assess the burden of drowning. Nevertheless, the large geographical variation and the lack of a nationally representative sample highlight the challenge of coming up with a reliable national estimate, and there was a strong perception among local partners that reporting figures clearly based on local data sources carries greater weight with in-country stakeholders than global modelled estimates.
While this exercise was useful in highlighting substantial geographical variation in drowning mortality across Tanzania, with a particularly high burden observed on Pemba island and in some districts, planning drowning prevention strategies in this country will require a better understanding of specific communities at high risk and the circumstances in which most drowning deaths occur. In 2014 and in line with two sustainable development goals (SDG), the WHO and World Bank set an agenda for a global CRVS systems scaling plan with the goal of universal civil registration of births and deaths (SDG target 17.19), including reporting the causes of death and access to legal proof of registration for all individuals by 2030 (SDG target 16.9).21 22 Although a fully functional CRVS system with national coverage would provide timely data on the burden of drowning, by age and sex, at national or subnational levels, such a system will take time and resources to develop. In the meantime, strengthening of other existing systems or establishing new ones in a number of sentinel sites would improve our understanding of the full extent of drowning.
What is already known on the subject
In Tanzania, the 2015 WHO Global Health Estimates (GHE) and the 2016 Global Burden of Disease (GBD) estimated, using statistical models, annual average drowning mortality rates of 6.5 and 4.6 drowning deaths per 100 000 persons, respectively, which equates to 3454 or 2486 deaths annually.
Both WHO GHE and GBD models estimated a higher risk of drowning death in males than females (8.9 and 6.1 drowning deaths per 100 000 persons, respectively, in males versus 4.0 and 3.0 drowning deaths per 100 000 persons, respectively, in females). According to the 2016 GBD, the highest risks of drowning death are experienced by children aged less than 1 year, 1–4 years, and adults aged 55 years or more (7.2, 6.5 and 12.5 drowning deaths per 100 000 persons, respectively).
What this study adds
There is substantial geographical variation in drowning mortality within Tanzania: From 0 to 16.7 drowning deaths per 100 000 persons-year on average in Songea urban district and Geita district bordered by the Lake Victoria, respectively (p<0.001). The highest proportion of deaths due to drowning was observed on Pemba island, where 4.2% of all recorded deaths at four hospitals were attributed to drowning (rising to 20.8% in young people aged 15–24 years).
Averaging across the available data suggests nearly 3000 drowning deaths per year in Tanzania: Combining populationbased data from within Tanzania and restricting analyses to the range of ICD-10 codes allocated to drowning deaths as included in the WHO GHE and 2016 GBD estimates (codes W65–W70 and W73–W74), we estimated an annual average drowning mortality rate of 4.3 per 100 000 inhabitants (95% CI 3.8 to 6.3). Taking the 2015 UN population estimate, this figure translates into 2317 drowning deaths per year. This is broadly consistent with 2015 WHO GHE and 2016 GBD estimates.
There is a 16% increase in drowning mortality rate when including the full range of ICD-10 codes related to drowning deaths: Including the full range of ICD-10 codes related to drowning deaths as recommended by Passmore et al (2007) increases by 16% the annual average drowning rate to 5.1 per 100 000 inhabitants (95% CI 3.8 to 6.3). Taking the 2015 UN population estimate, this figure translates into 2748 drowning deaths per year.
Lack of information on the circumstances surrounding drowning deaths: Almost a third of drowning deaths were allocated to each of the codes W74 ‘unspecified drowning and submersion’ (31.8%) and W69 ‘drowning and submersion while in natural water (lake, open sea, river and stream)’ (29.7%). Around 10% of drowning deaths were allocated to each of the codes W73 ‘other specified drowning and submersion (quenching tank, reservoir)’ (11.3%), W70 ‘drowning and submersion following fall into natural water’ (9.6%) or X36 ‘victim of avalanche, landslide and other earth movements’ (8.8%). Narrative of verbal autopsy data from operating Health and Demographic Surveillance Systems in Tanzania could provide a better understanding of thecircumstances of drowning deaths.
Acknowledgments
We gratefully acknowledge all authors or institutions who responded to our requests. We also gratefully acknowledge all local stakeholders who attended our final dissemination workshop in Dar es Salaam for their participation and insights: Nahson Sigala and Musa MR Habili (Surface and Marine Transport Regulatory Authority), Abdi Ismael (Zanzibar Maritime Authority), Hujeje Mamboleo (Msasani Beach Management Unit), Pamela Levira (Tanzania Meteorological Agency), Dr Ndeniria Swai and Dr Christopher Mzava (Dar es Salaam Regional Commissioners Office), Ndali Lulu (Local Government Authorities), Dr Abel Makube (Bugando Medical Centre), Leonard Mwakalebela (Daily News), Shuwari Abdallah, Bakhtim Marshed and Abas R Makame (Panje Project), Toni Ongala (Tanzania Lifesaving Society), Shukuru Lugawa (Tanzania Sea Rescue), Vivaoliva Shoo (Tanzania Red Cross).We gratefully acknowledge all authors or institutions who responded to our requests. We also gratefully acknowledge all local stakeholders who attended our final dissemination workshop in Dar es Salaam for their participation and insights: Nahson Sigala and Musa MR Habili (Surface and Marine Transport Regulatory Authority), Abdi Ismael (Zanzibar Maritime Authority), Hujeje Mamboleo (Msasani Beach Management Unit), Pamela Levira (Tanzania Meteorological Agency), Dr Ndeniria Swai and Dr Christopher Mzava (Dar es Salaam Regional Commissioners Office), Ndali Lulu (Local Government Authorities), Dr Abel Makube (Bugando Medical Centre), Leonard Mwakalebela (Daily News), Shuwari Abdallah, Bakhtim Marshed and Abas R Makame (Panje Project), Toni Ongala (Tanzania Lifesaving Society), Shukuru Lugawa (Tanzania Sea Rescue), Vivaoliva Shoo (Tanzania Red Cross).
Footnotes
Contributors SS, SM, KT, TM, DR and SC developed the framework for data identification and acquisition. SS and SC conducted the literature search. SM, KT and TM conducted the in-country networking for identification of other possible data sources and organised workshops with relevant stakeholders. SS and SC analysed the data and wrote the initial draft of the manuscript. All authors reviewed, made inputs to and approved the final paper. SC is the overall guarantor and SS is the corresponding author.
Funding This work was supported by the Royal National Lifeboat Institution.
Competing interests None declared.
Patient consent Not required.
Ethics approval Ethical approval was obtained from the LSHTM ethics committee for the acquisition of unpublished data (reference 13845). In Tanzania, ethical approval was obtained from both the IHI (reference IHI/IRB/No:005-2017) and the national (reference NIMR/HQ/R.8a/Vol.IX/2508) ethics committees.
Provenance and peer review Not commissioned; externally peer reviewed.