Article Text

Abstract
Objective This study proposes and evaluates the theory that people who are susceptible to injury in residential fires are not susceptible to death in residential fires and vice versa. It is proposed that the population vulnerable to death in residential fires can be proxied by ‘frailty’, which is measured as age–gender adjusted fatality rates due to natural causes.
Methods This study uses an ecological approach and controls for exposure to estimate the vulnerability of different population groups to death and injury in residential fires. It allows fatalities and injuries to be estimated by different models.
Results Frailty explains fire-related death in adults while not explaining injuries, which is consistent with the idea that deaths and injuries affect disjoint populations.
Conclusions Deaths and injuries in fire are drawn from different populations. People who are susceptible to dying in fires are unlikely to be injured in fires, and the people who are susceptible to injury are unlikely to die in fires.
- residential fires
- deaths
- injuries
- frailty
Statistics from Altmetric.com
Introduction
The purpose of this paper is to better understand the dynamic of age and gender on deaths and injuries resulting from residential fires. While there are exceptions, nearly all studies find that the oldest and the youngest groups are more likely to be killed in fire, while those in the middle-age group are more likely to be injured in fire. Most studies find that males are more likely to be injured and killed from fires than females. However, the literature does not decouple an individual’s vulnerability from their fire exposure in explaining death and injury rates.
This paper proposes and tests two hypotheses. First, it tests the idea that deaths and injuries are drawn from different populations. That is, it evaluates whether the people who are susceptible to dying in fires are unlikely to be injured in fires, and the people who are susceptible to injury are unlikely to die in fires. Second, it tests the idea that the people who are susceptible to death in fires can be identified using a measure of ‘frailty,’ where frailty is based on age–gender adjusted death rates from natural causes. Therefore, frailty, as a measure of vulnerability, should completely explain the effects of age on the likelihood of death in fire for adults. The two hypotheses taken together imply that if you are frail, then you are more likely to die in a fire than be injured regardless of age, and if you are not frail, then you are more likely to be injured than die in a fire regardless of age. This is not intuitive because age groups that are associated with risk-taking behaviour—higher rates of binge drinking for example—would be expected to have disproportionally high death rates reflecting their degree of risk-taking behaviour, but do not, even after accounting for their inherently low vulnerability.
Numerous studies have evaluated the factors that influence casualty rates from fire.1 2 In particular, the age structure of deaths and injuries as determined by this previous work provides insight that went into formulating the hypotheses of this paper. Among the factors found to be important were the incidence of smoking and alcohol use.3 It was precisely the absence of a ‘binge-drinking bump’ in the age and sex structure of deaths that pointed the authors in the direction of this paper’s hypotheses.
Between 2009 and 2013, 2470 people per year lost their lives in home structure fires (‘home fires’), and an additional 13 300 were injured, on average.4 Home fires represented 27% of all reported fires, yet constituted 84% and 77% of all fire fatalities and injuries, respectively. In an analysis of home fires (2009–2013) based on national fire statistics, cooking equipment is cited as the most common cause of home fires (45%), followed by heating equipment (16%), intentional (8%), electrical distribution or lighting equipment (8%) and smoking materials (5%).5 Causes of deaths from residential fires follow a different pattern. Smoking materials are shown to be the leading cause of civilian fire deaths (23%), followed by heating equipment (19%), cooking equipment (17%), electrical distribution or lighting equipment (15%) and intentional (14%). The leading area of fire origin that resulted in an injury is shown to also be the most common area of fire origin (kitchen or cooking area), but the leading area of fire origin that resulted in a death differed (living room, family room or den). On a per fire basis, primary death and injury causes are shown to be different. Smoking materials were still the leading cause of deaths (30.9 deaths per 1000 fires), but cooking equipment became less prominent (2.6 deaths per 1000 fires). For injuries, playing with a heat source (106.5 injuries per 1000 fires) and candles (88.9 injuries per 1000 fires) were the top two causes on a per fire basis.
The incidences of deaths involving the elderly (65 and over) and the very young (under five) occurred disproportionally higher to their proportion of the US population.5 Children under 5 years comprise 7% of the home fire deaths but 6% of the population. However, adults 65 years and over made up 32% of the home fire deaths but represented only 13% of the population. For comparison, adults between 20 years and 49 years make up 42% of the population but represent only 25% of fire deaths. Data on occupants who avoided death and injury are not documented in fire incident reports from which the analysis is based. However, in an analysis based on a survey of households (2004–2005), households who had experienced a recent fire (last 90 days) reported more household members under the age of 18 years (younger ages were not considered), but fewer household members age 65 years and older, than households without a recent fire incident.6
Combined, the two studies5 6 provide evidence that older occupants are susceptible to death from home fires; that is, the disproportionally high fire death rates cannot be explained away by elevated fire exposure (ignition) rates. Furthermore, while smoking materials are the leading cause of death for victims 65 years and over (34%),7 the difference between fire and non-fire households in the number of smokers is only marginally significant.6 In fact, the increase in fire exposure due to smoking is more than offset by the decline in exposure due to other (unobserved) factors related to occupants being 65 years and over—the probability of being a fire household increases by 13% for each smoker, while the probability declines by 45% for each household member 65 years and over.
The pattern of injury rates is much different than those for death, and they appear to affect opposite population segments. The percentage of total injuries is 4% for victims under 5 years, 13% for victims 65 years and over and yet 50% for victims 20–49 years.7
The literature has focused on crude rates of death or injury or, in the case of smoking, alcohol or drugs, simple associations with death and injury. This study measures the rate of injury and death conditional on there being a fire; that is, the focus is on evaluating the susceptibility or vulnerability of age and gender from a residential fire. Successful fire prevention (ie, ignition reduction) efforts can lead to a reduction in fire deaths and injuries; however, recognising population-specific vulnerabilities that influence health outcomes during home fires suggests efforts to increase the ability of sensitive populations to survive unwanted fires (ie, vulnerability reduction) will also lead to a reduction in deaths and injuries.
This paper analyses data exclusively from publicly available datasets.
Model and methods
It is assumed that the probabilities of death and injury can be modelled using the Poisson distribution as:
 (1)
(1)
where N is the number of people exposed to fire, and
 (2)
(2)
is approximately the risk of death per person with characteristics, X, and in environment, H, conditional on exposure to a fire.
Similarly, the risk of injury per person is estimated such that:
 (3)
(3)
is approximately the risk of injury per person with characteristics, X, and in environment, H, conditional on exposure to a fire. Exposure to fire is addressed with an offset term in the model. A more detailed exposition of the model is included in the online supplement.
The challenge is to operationalise the hypotheses introduced in the previous section in a way that they can be empirically tested using risk models. This paper operationalises vulnerability by comparing the death rate in fires to the death rate from natural causes, the latter termed ‘Frailty’. It is proposed that the proportion of people in any group susceptible to dying in a fire will be proportional to the natural-causes death rate. Frailty becomes a proxy for the size of the group susceptible to death in fire. Population groups are defined using age and gender combinations. It is recognised that people who die from natural causes are not necessarily ‘frail’, and many people who are frail lead long and productive lives despite their frailty. Nevertheless, it is expected that the natural-causes death rate will be proportional to the number of people who are ‘frail’ in any population. On that basis, we use it as our measure for this ecological study.
There are two closely related but different meanings for ‘frail’ and ‘frailty’ in this paper. First, ‘frail’ (and occasionally, ‘frailty’) refers to the collection of characteristics that make an individual susceptible to death in fire. This paper does not attempt to identify what those characteristics may be (although we speculate briefly in the conclusions), it simply presupposes their existence. Second, ‘frailty’ refers to the population-level measure defined above. Which ‘frailty’ is meant at any given time will be clear from the context.
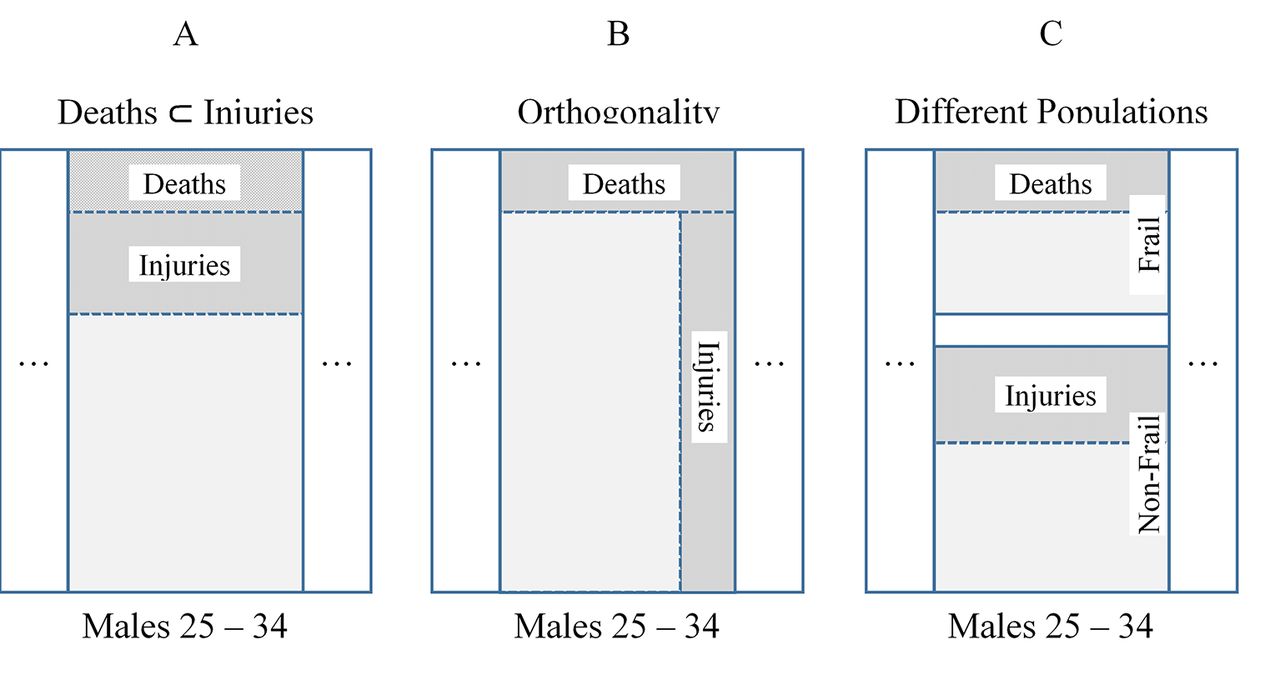
Figure 1 illustrates the hypothesis that different populations are susceptible to death or injury, along with two other possible contrasting hypotheses. The first (contrasting) population hypothesis is that deaths are a subset of injuries. The idea is that some people are injured in fires, and of those injured, some are injured so badly that they die. Essentially, deaths are just extreme injuries. Based on this hypothesis, the number of deaths and injuries should move in tandem, since the processes affecting one should affect the other with same direction of influence. In the second (contrasting) population hypothesis, deaths and injuries are different processes acting independently. Assuming the number of people who are injured or killed in a fire are small relative to the population, then variation in the number of fire deaths has a minimal impact on the number of fire injuries and vice versa. The third population hypothesis, termed the ‘different populations’ hypothesis, and subject of this paper, posits that as the number of people susceptible to death increases, the number of people susceptible to injury decreases and vice versa.
It is expected that the processes governing injury and death rates for the very young will be significantly different from the processes for adults. There are at least two reasons for this. First, among the very young, the cognitive limitations that limit their ability to recognise danger and escape on their own will likely correlate poorly with natural-causes death rates. Second, parental protection will impact death rates in ways that are not reflected in natural-causes death rates. As a result, we do not expect these hypotheses to hold in their present form for younger ages.

Illustration of the different populations hypothesis.
Three sets of death and injury models were estimated (six in total). The models were estimated using the techniques of generalised linear models with SEs for the parameters estimated using bootstrapping. All models account for characteristics of the house and fire environment that affect the risk of injury and death in a fire, including fire spread, occupancy (vacant, rental, measure of crowding and unit size), whether it occurred in a mobile home, fire department protected population size and US Census region. In addition, the models account for personal characteristics that affect the ability of a person to escape death or injury in a fire, including gender, age, frailty, race and ethnicity, social vulnerability index, household income and smoker rate. The online supplement contains a more detailed discussion of the variables included and the literature identifying factors that influence casualty rates.
The Poisson model assumes that the count variance is equal to its expected value (mean) and that is unlikely to hold here. While the Poisson estimates will still be consistent and converge on the correct parameter estimates, the SEs and CIs will be underestimated. To address that, the SEs and CIs are estimated by bootstrapping.8 That non-parametric method allows us to estimate the SEs and CIs without relying on the Poisson assumption about the magnitude of the variance.
The three sets of models differ by their inclusion of key variables: model 1 includes age–gender combinations as dummies; model 2 excludes the age–gender dummies, while including frailty and a dummy for gender; model 3, like model 2, excludes the age–gender dummies, while including frailty and separate dummies for gender, males age under 5 years, males age 5–14 years, females age under 5 years and females age 5–14 years. The analysis below relies exclusively on models 1 and 3. Model 2 is included for completeness.
Using the models described above, our hypotheses are tested empirically as:
Empirical different-population hypothesis
As discussed above, ‘different populations’ implies that as the population vulnerable to deaths increases, the population vulnerable to injuries decreases. Therefore, it is expected that the frailty parameter on injuries in model 3 will be statistical significant and negative. Residuals subsetted by age and gender from the injury model (described below) are not expected to go to zero with the inclusion of frailty.
Empirical vulnerability hypothesis
The vulnerability hypothesis implies that residuals subsetted by age and gender (described below) from the death risk model, using model 3, are not statistically different from zero after the inclusion of the frailty term. (The reason why model 3 is used and not model 2 is because the processes governing death and injury are expected to be different for the young.) Results are compared with model 1, which excludes frailty.
Due to the model structure, the age and gender residuals for deaths and injuries were computed in link-space. The link-space residual for deaths for age × gender group j is the solution to the following equation:
 (4)
(4)
where  is the actual number of deaths for census tract i and age × gender group j,
  is the predicted number of deaths for census tract i and age × gender group j and
  is the link-space residual value for deaths for age × gender group j. Computed age × gender residuals for injuries are exactly comparable.
Data on residential fire-related deaths, injuries, characteristics of the house and fire environment and victims’ personal characteristics are used in this analysis. The variables, their definitions and data source are described in the online supplement and summarised in table 1. All variables are aggregated to the census tract level. One-third of the data was selected at random for analytic tractability.
Variables used in this study
‘Deaths’ and ‘injuries’ are from the NFIRS and include all injuries or deaths resulting from the incident or its mitigation. In principle, it allows updating for 1 year, but since the NFIRS data are filled out by firefighters at the scene follow-up is likely to be sparse and inconsistent. It seems likely that in most cases, the status of the casualty is determined at the time of transport, which is assumed in this analysis.
Limitations
There are several possible data quality issues that are also discussed in more detail in the online supplement.
Since follow-up on casualties is likely to be sporadic, it is possible that the same on-scene casualty will be reported as an injury by one department and a death by another. However, the magnitude of such inconsistent coding is likely to be small, and it seems unlikely that it would affect the results.
It appears that relevant fires are significantly under-reported, while deaths and injuries are more accurately reported. This work necessarily assumes that the data errors and censoring due to geocoding failure are otherwise uncorrelated with the variables used in this study. Although the gross risk levels are unreliable, the relative levels that are the focus of this study should be fairly reliable. Use of the offset implicitly assumes that the ages and genders are not correlated with fire risk within a tract. While less relevant to this study, the construction of the data assumes that all included variables are uncorrelated with fire risk within a tract. That assumption is almost certainly not true, but it is expected that the error introduced is small enough not to bias the parts of the model of interest.
Results
Full regression results are listed in the online supplement, along with a discussion of the results of the ‘nuisance’ variables. Residuals and parameter values for the age and gender terms are listed in table 2.
Age and gender parameters/residuals from the models. Standard errors are shown in parentheses beneath the estimated values. Results in bold are significant at the 2% level
Empirical vulnerability hypothesis
Table 2 provides the parameter estimates of the age–gender combination dummies from model 1, along with the residuals by age–gender combination from model 2 and model 3 for both the death and injury models. The parameter estimates from model 1 demonstrate, in general, that age and gender are correlated with death and injury rates (relative to the baseline of females between 5 years and 14 years of age). Male and females under 5 years, females over 50 years and males over 40 years experience higher vulnerability to death from fire than other ages. The risk is higher for older individuals—peaking for the oldest—than the youngest ones. Males and females exhibit fire injury risk at all ages (relative to the baseline) and peak for individuals in their 40s.
Model 2 replaces the age–gender combination dummies with the frailty measure and a male (no age) dummy. In general, the inclusion of frailty removes the correlation between age and death risk for males over 40 years and females over 50 years. Some residuals are statistically different from zero, which is mainly a product of the inclusion of the very young in the model. Frailty appears to better account for vulnerabilities in older victims than younger ones.
Model 3 effectively removes the very young from consideration. All residuals from the death risk model are statistically indistinguishable from zero. Figure 2 shows the estimated effect of age and gender on death rate in residential fires from model 1 (solid lines) and the mean residuals by age and gender for log death rate from model 3.

Log of death rate by age and gender. Error bars are bootstrapped. Solid lines are coefficients from model 1. Dashed lines are residuals from model 3.
The vulnerability hypothesis is generally supported by the data. There are two exceptions. First, as expected, it fails for the very young. The measure of frailty significantly underpredicts death rates for children under the age of 15 years, which is expected to be driven by the younger portion of that age group. Second, the male gender dummies in models 2 and 3 are significantly greater than zero indicating that males are at higher risk of death in fire than their frailty would suggest. This holds even though males have a higher natural-causes death rate than females at all ages (see figure 3). One explanation is that males are more susceptible to fire and smoke, conditional on the same level of exposure, than their natural-causes death rate would suggest. Alternatively, and more likely, males may be exposed to higher risks than females. Among other possibilities, the latter could take the form of being more likely to be exposed to fire (eg, males are more likely to smoke9) or less likely to egress during a fire (eg, rescue attempts or attempts to extinguish a fire). Of the two, exposure to higher risks (rather than unaccounted-for frailty) seems the more likely explanation.

Death from natural causes by age and gender.
Furthermore, the increased male death rate is realised across all ages to include the under-5 years age group. Again, increased risk, rather than unaccounted-for frailty, seems the more plausible, although whether this takes the form of more risky behaviours on the part of boys or differences in the protective behaviour of their guardians these data cannot tell. Riskier behaviours could include differences in exposure that are not accounted for in this model (eg, boys being more likely to engage in fireplay), or differences in behaviour given the existence of a fire (eg, girls being more likely to flee).
Empirical different-population hypothesis
In testing the vulnerability hypothesis, it was found that frailty explained risk of death during a fire, but not the risk of injury. Figure 4 shows the estimated effect of age and gender on injury rate in residential fires for model 1 (solid lines) and shows the mean residuals by age and gender for log injury rate for model 3. (Note that the frailty residuals have been shifted in figure 4 to match the parameter values for the baseline curves at age 20.) As predicted by the ‘different populations’ hypothesis, in model 3, there is a small but significant negative association between frailty and injuries, and age–gender residuals do not undergo a large relative change and certainly do not go to zero.

Log of injury rate by age and gender. Error bars are bootstrapped. Solid lines are coefficients from model 1. Dashed lines are (normalised) residuals from model 3.
Conclusions
This paper set out to test two hypotheses. First, the people who die in fires are disproportionally those with a vulnerability. Second, that deaths and injuries are drawn from different populations. The hypotheses tested in this paper are supported by the data. Nearly all deaths seem to be associated with ‘frailty’. The only failures of this hypothesis involve the very young, which was expected and where different mechanisms are likely at work, and males who have a higher death rate than their frailty would suggest.
The different-populations hypothesis is also supported. Residuals on injuries are not strongly affected by the inclusion of the frailty term, and the frailty term is negatively correlated with injuries. The hypothesis no longer holds with the inclusion of the very young, but again that was not unexpected.
This work does not answer the question of what individual-level characteristics account for ‘frailty’. We speculate that a major characteristic that ‘frailty’ proxies for is the ability to escape. Specifically, we speculate that the people who die in fires are almost exclusively people who are unable to escape due to mental or physical conditions. However, verification of this speculation is the subject of future work.
These results suggest that measures targeted to reduce fire injuries will have little impact on fire deaths, while measures targeted to reduce fire deaths will have little impact on fire injuries. It also seems likely that measures targeted towards reducing fire deaths and injuries among the very young will have little impact on deaths and injuries among older people and vice versa. Fire deaths seem to be strongly associated with frailty, at least among adults, which suggests that measures to reduce fire deaths among adults should be focused on the disabled and those who suffer from the infirmities of age.
What is already known on the subject
Older people and young children are more likely to die in a residential fire than other ages.
Males are more likely to die in fire than females.
Middle-aged people are more likely to be injured in fire than other ages.
What this study adds
People who suffer non-fatal injuries in home fires are identifiably different from those who suffer fatal injuries.
People who are susceptible to death in home fires can be identified at the population level by ‘frailty’: the log of the natural-causes death rate.
Holding ignition exposure constant, ‘frailty’ (a proxy for physical vulnerability) completely explains the effects of age on the likelihood of death in fire for adults.
Acknowledgments
The authors want to thank Doug Thomas, Bob Chapman, Doug Wissoker, Rob Santos, Joshua Kneifel and anonymous referees whose comments improved this paper. Any remaining errors are the responsibility of the authors.
Footnotes
Contributors Both authors gave considerable contribution to one or more of the following conditions for authorship: study design, data acquisition, analysis and interpretation of results or intellectual content. Both authors gave final approval of the manuscript for publication.
Funding The International Association of Fire Fighters for providing data and a FEMA Fire Grant for support as part of the FireCARES Project.
Competing interests None declared.
Provenance and peer review Not commissioned; externally peer reviewed.