Article Text

Abstract
Background Childhood injury is a leading cause of hospitalisation, yet there has been no comprehensive examination of child injury and survival over time in Australia. To examine the characteristics, temporal trend and survival for children who were hospitalised as a result of injury in Australia.
Method A retrospective examination of linked hospitalisation and mortality data for injured children aged 16 years or less during 1 July 2001 to 30 June 2012. Negative binomial regression examined change in injury hospitalisation trends. Cox proportional hazard regression examined the association of risk factors on 30-day survival.
Results There were 6 86 409 injury hospitalisations, with an age-standardised rate of 1489 per 1 00 000 population (95% CI 1485.3 to 1492.4) in Australia. Child injury hospitalisation rates did not change over the 10-year period. For every severely injured child, there are at least 13 children hospitalised with minor or moderate injuries. The total cost of child injury hospitalisations was $A2.1 billion (annually $A212 million). Falls (38.4%) were the most common injury mechanism. Factors associated with a higher risk of 30-day mortality were: child was aged ≤10 years, higher injury severity, head injury, injured in a transport incident or following drowning and submersion or other threats to breathing, during self-harm and usual residence was regional/remote Australia.
Conclusions Childhood injury hospitalisation rates have not reduced in 10 years. Children’s patterns of injury change with age, and priorities for injury prevention alter according to developmental stages. The development of a national multisectorial childhood injury monitoring and prevention strategy in Australia is long overdue.
- injury
- children
- hospitalisation
- cost
- mortality
This is an open access article distributed in accordance with the Creative Commons Attribution Non Commercial (CC BY-NC 4.0) license, which permits others to distribute, remix, adapt, build upon this work non-commercially, and license their derivative works on different terms, provided the original work is properly cited and the use is non-commercial. See: http://creativecommons.org/licenses/by-nc/4.0/
Statistics from Altmetric.com
Introduction
Injury is a leading cause of death among children and accounts for around 950 000 non-fatal hospitalisations among children each year worldwide.1 In Australia, injury is the leading cause of death for children aged 1–16 years2 and remains a leading cause of hospitalisation and long-term disability among children in many countries.3–6 Beyond the initial injuries sustained, an injured child may face ongoing limitations related to their physical abilities, experience chronic pain and psychological issues, such as post-traumatic stress disorder.7 Their injury also impact on their family and their community networks.8
Medical advances, prehospital intervention and trauma management, legislative change and the introduction of safety initiatives (such as swimming pool fencing, helmets, child-proof medicine containers, non-flammable clothing, hot water tempering) and mechanical safety advances (such as rear-review cameras in vehicles) have all contributed to increasing the survival of children following traumatic injury and/or in the reduction of the severity of the injury sustained.9 Yet, in Australia there has been no comprehensive examination of injury characteristics and survival over time for injured children at a national level. This sort of in-depth information on childhood injury is essential for identifying the injury burden, priority-setting of injury prevention strategies, determining resource planning, identifying temporal changes in injury trends, determining healthcare costs and for evaluating the impact of injury prevention measures.10 Any future gains in improved survival following child injury and in the promotion of injury prevention strategies will likely stem from continued improvements in prehospital care and trauma management11 12 and in advocacy efforts towards effective child injury prevention measures.1 This study aims to examine the characteristics, temporal trend and survival for children who were hospitalised as a result of injury in Australia during 2002–2003 to 2011–2012.
Method
A retrospective analysis was conducted of hospitalised injuries of children aged 16 years or less using linked hospitalisation and mortality records during 1 July 2002 to 30 June 2012.
Linked hospitalisation and mortality data collections
Information on hospitalisations was obtained from the National Hospital Morbidity Database and jurisdiction-based hospitalisation data collections. These include information on all patient admissions from public and private hospitals in Australia. Data were only available from 1 July 2004 in the Australian Capital Territory (ACT). Within the hospitalisation data, diagnoses and external cause codes were classified using the International Classification of Diseases, 10th Revision, Australian Modification (ICD-10-AM).13 Injury-related admissions were identified using a principal diagnosis classification of injury (ICD-10-AM: S00-T78).
Mortality data from the National Death Index were probabilistically linked to the hospitalisation records by the Australian Institute of Health and Welfare to identify mortality posthospital admission. The Western Australian Data Linkage Branch linked Western Australian hospitalisation and mortality records and Tasmanian hospitalisation records were linked using a unique patient identifier, with mortality postadmission recorded within Tasmanian hospitalisation data. In Victoria, 20.4% (n=41 482) of the child injury hospital records were not able to be linked and included in the study as they did not include patient names. A review of these records did not identify any consistent bias by financial year or hospital.
Identification of health conditions and injury severity
A number of chronic health conditions pertinent for children were identified.14 A chronic condition was considered to be a health condition that would reasonably be expected to last 12 months and that resulted in limitations for self-care, independent living or social interactions and/or resulted in the need for ongoing healthcare using medical services or specialist equipment.15 Chronic health conditions were categorised as none, one condition or two or more conditions.
Injury severity was estimated using the International Classification of Disease ISS (ICISS) by applying survival risk ratios (SRR) to each injury diagnoses.16 The ICISS is derived by multiplying the probability of survival for each injury diagnosis using SRRs calculated for each injury diagnosis.16 Minor (≥0.99), moderate (0.941–0.99) and serious (≤0.941) injuries were identified.17
Geographic identification
The Australian Statistical Geographical Standard identified urban and regional/remote location of residence, with remoteness based on distance to service centres.18 The five remoteness categories were categorised as: urban (ie, major cities) and regional/remote (ie, inner regional, outer regional, remote, and very remote).
Hospital costs
The Australian Refined-Diagnosis Related Groups (AR-DRGs), episode of care length of stay (LOS) and episode of care type (eg, acute, rehabilitation) were used to estimate hospital costs. Rehabilitation-related episodes of care were identified using the AR-DRG classifications of Z60A, Z60B and Z60C19 and/or an ICD-10-AM rehabilitation classification (ie, Z50.1, Z50.8 and Z50.9). Using estimates of public hospital costs,20 the average daily cost per AR-DRG was multiplied by the episode of care LOS up to 120 days, then a flat rate of $A200 per day was applied thereafter, excluding long hospital stays for 19 select AR-DRGs.19 The average cost per AR-DRG included costs for medical and nursing clinical services, non-clinical salaries, pathology, imaging, allied health, pharmaceuticals, intensive and coronary care, operating rooms, emergency departments, supplies and ward overheads, specialist procedure suites, prostheses, staff on-costs (eg, superannuation, termination, long-service leave, workers’ compensation, recruitment costs), cleaning, linen and food services and depreciation costs.20
For patients treated for an injury-related period of care at a private hospital, the average daily public hospital AR-DRG costs were used as estimates of injury treatment cost. The calculation of costs excluded 2 years of hospitalisations in the ACT and in Tasmania (ie, 2002–2003 and 2003–2004). All costs are in 2009–2010 Australian dollars and this was equivalent to an average exchange rate of US$0.90.21
Data management and analysis
All analyses were performed using SAS V.9.4.22 All hospital episodes of care related to the one injury were linked to form a period of care (ie, all episodes of care related to an injury until discharge from the health system). Denominator data for the number of children aged 16 years or less were obtained from the Australian Bureau of Statistics population estimates for each jurisdiction. Age-standardised incidence rates were calculated using PROC STDRATE using the estimated Australian residential population at 30 June 2001 as the standard population. Negative binomial regression was used to examine change in temporal trends in the incidence of injury hospitalisation.
Thirty-day mortality was calculated from the date of admission of the first injury hospitalisation. The Cochran-Armitage trend test was used to examine the trend for unadjusted 30-day mortality. Cox proportional hazard regression was used to examine the effect of risk factors on survival at 30 days following hospitalisation. Variables were initially examined using univariate analyses and if significant at 0.25 were entered into a multivariable model. The variables included were: age group, gender, number of health conditions (ie, 0, 1+), injury severity (ie, minor, moderate, serious), injury mechanism, location of residence and principal injury type. A backwards stepwise regression sequentially eliminated factors from the multivariable model that did not significantly contribute to mortality risk at 0.15. HR and 95% CI were calculated.
Results
Between 1 July 2002 and 30 June 2012, there were 6 86 409 index injury-related hospitalisations for children aged 16 years or less in Australia. The age-standardised injury hospitalisation rate (excluding ACT) was 1489 per 1 00 000 population (95% CI 1485.3 to 1492.4) and there was no significant decrease over time (p=0.8) (−0.1% per year; 95% CI −1.10 to 0.89) (figure 1). The estimated total hospital treatment cost for injured children was$A2.1 billion over the 10-year period. Annually, hospital treatment cost an estimated $A212 million, with a mean cost per injured child of $A3119 (median $A1262). Fall-related injuries ($A638 million) and transport-related injuries ($A504 million) were the costliest injury mechanisms.
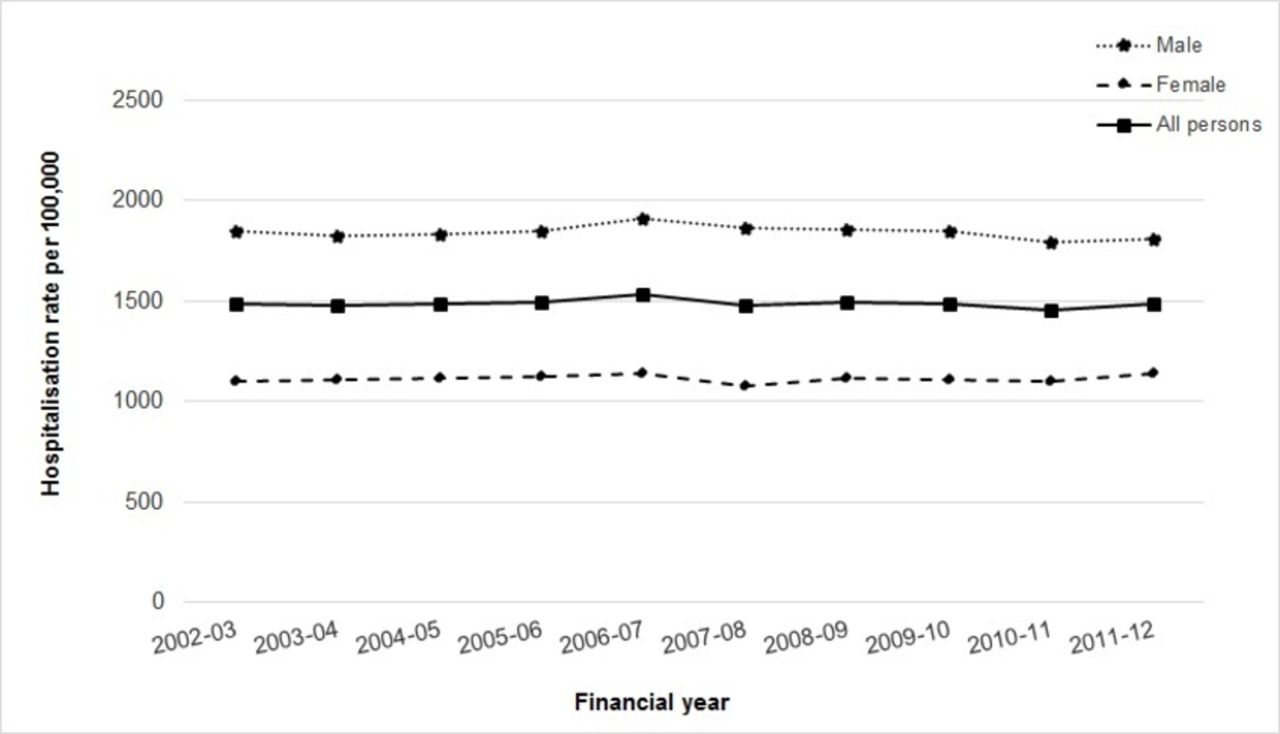
Incidence rate for injury-related hospitalisations for children aged ≤16 years by year, linked hospitalisation and mortality data, Australia, 1 July 2002 to 30 June 2012. Incidence rate excludes Australian Capital Territory.
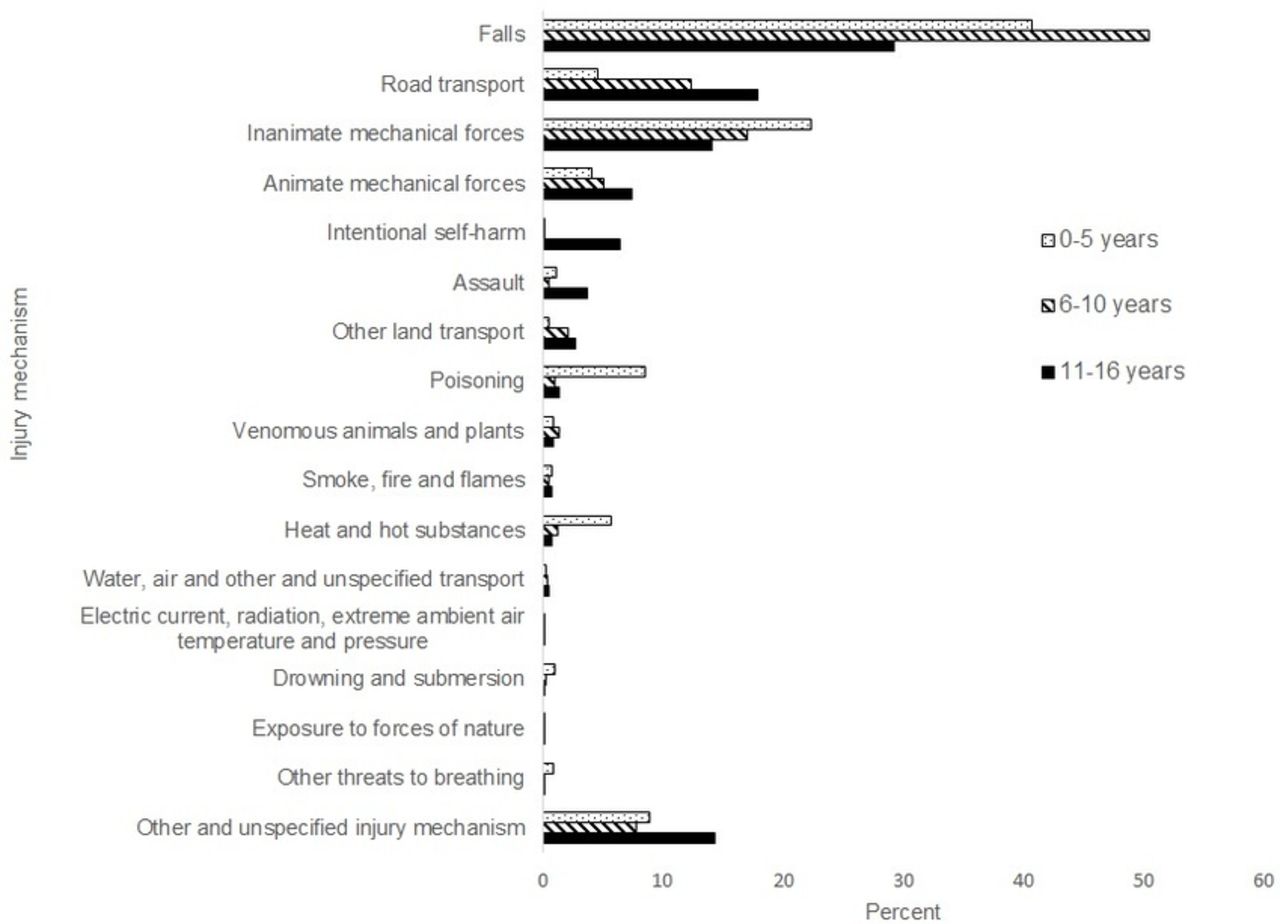
Males accounted for just less than two-thirds (63.6%) of hospitalisations. New South Wales (32.6%) and Queensland (25.8%) accounted for over half of all hospitalisations, and 70.0% of children resided in urban Australia. Just under two-thirds of all injuries were minor (table 1). Fall-related injuries accounted for half the hospitalisations of children aged 6–10 years (50.4%). Injuries from inanimate mechanical forces (such as getting struck by or striking against objects) were common for children aged 0–5 years (22.3%). Road transport injuries were most common for children aged 11–16 years (17.8%). Injuries from intentional self-harm were most common for children aged 11–16 years (6.4%) (figure 2).

Injury mechanism for injury-related hospitalisations of children aged ≤16 years by age group, linked hospitalisation and mortality data, Australia, 1 July 2002 to 30 June 2012. Data only available from Australian Capital Territory from 1 July 2004 and age was missing for one child.
Characteristics of children aged ≤16 years with an injury-related hospitalisation by gender, linked hospitalisation and mortality data, Australia, 1 July 2002 to 30 June 2012
The unadjusted 30-day mortality rate rose over the periods examined from 0.13% in 2002–2003 to 0.19% in 2011–2012 (p<0.0001) (see online supplementary figure 1), but there was no significant difference in the adjusted HRs for 30-day mortality across the 10-year period (figure 3). The multivariable Cox regression model identified that younger children (ie, aged 10 years or less) had a higher mortality risk within 30 days compared with children aged 11–16 years. Moderately and severely injured children had a higher risk of mortality compared with children with minor injuries. Children injured in transport incidents, following drowning and submersion or other threats to breathing, and those injured as a result of intentional self-harm had a higher risk of mortality compared with other and unspecified injury mechanisms. Children who lived in regional/remote Australia had a higher risk of mortality compared with children who resided in urban areas. Children who sustained a head or thorax injury had a higher risk of mortality compared with children who sustained other injuries (table 2).

![[SP1.jpg]](https://injuryprevention.bmj.com/content/injuryprev/24/5/344/DC1/embed/inline-supplementary-material-1.jpg?download=true)
Adjusted hazard ratios (HRs) for 30-day mortality following injury hospitalisations of children aged ≤16 years by financial year, linked hospitalisation and mortality data, Australia, 1 July 2002 to 30 June 2012. Data only available from Australian Capital Territory from 1 July 2004. Adjusted for age group, gender, health condition (ie, Y/N), injury mechanism, principal injury type, injury severity (ie, minor, moderate, serious), urban-regional/remote residence and financial year. Referent year: 2002–2003.
Multivariable predictors of mortality at 30 days following an injury hospitalisation for children aged ≤16 years, linked hospitalisation and mortality data, Australia, 1 July 2002 to 30 June 2012
Discussion
During 2002–2003 to 2011–2012, there were 6 86 409 injury hospitalisations of children aged 16 years or less in Australia. There was no significant decrease in the injury hospitalisation rate for children over the 10-year period. As injury prevention has been a national public health priority area in Australia for 30 years,23 it is disappointing that there has been no apparent reduction in child injury hospitalisations. WHO has continued to promote the need for the implementation of child injury prevention strategies.1 9 In Australia, the national injury prevention strategy expired in 2014.24 With injury continuing to represent a substantial burden to the Australian community,25 the development of a national injury prevention strategy is long overdue.
The total hospital cost of injury hospital admissions of children in Australia was estimated to be $A2.1 billion for the 10-year period. The total cost is underestimated as costs were not able to be calculated for a 2-year period in Tasmania and the ACT and 20.4% of Victorian child injury hospitalisations were not able to be included in the cost calculations. Falls and transport-related injuries represented the costliest injury mechanisms for children, as had been found in previous studies examining the cost of hospitalised injury for children.26 27
Overall, 63.6% of the injury hospital admissions were of young males. Males are known to have a higher rate of injury hospitalisations than females, which is likely to be as a consequence of their higher risk taking.28 The three most common injury mechanisms for child injury hospitalisation were falls, injuries due to inanimate mechanical forces (such as being struck by/striking against objects), and injuries as a result of road transport-related incidents. These injury mechanisms have also been identified as the most frequent for children in other countries.4 29
Factors associated with a higher risk of 30-day mortality after the injury hospitalisation were the child was aged ≤10 years, severe injury, injured in a transport incident or following drowning and submersion or other threats to breathing, regional/remote residence and a head injury. Road trauma represents some of the most severe injuries seen for children in Australian hospitals,30 so it is not surprising that road transport crashes had a higher risk of mortality. Neither is it surprising that drowning and submersion was associated with a higher risk of mortality, with the longer the child has been submerged in water, the poorer the prognosis for recovery.31 In terms of residential location, children living in regional/remote Australia can also be exposed to occupational hazards, as their home and play area can often be a workplace, and head injury has long been identified as a common cause of injury mortality in children.32
While injury hospitalisations represent one piece of the child injury burden in Australia, there are many more children who present to emergency departments and general practitioner surgeries for treatment. During the 10-year period examined, there were also 1759 injury deaths of children aged 16 years or less in Australia,33 some of which are captured by this study, if the child was admitted to hospital prior to death. Many of the serious injuries sustained by children can have long-term implications for ongoing care and treatment, affecting the child’s health-related quality of life and also posing stress on caregivers and other family members.8 Having timely and accurate information on child injury hospitalisations is essential to monitor temporal trends in childhood injury and in evaluating the impact of injury prevention initiatives.10 The Australian national trauma registry will go some way to addressing this; however, funding is not secured past 2020, and, the registry captures only the acute hospitalisation information of those children who are most severely injured and treated at one of Australia’s 27 major trauma centres (which equates to approximately half of Australia’s children hospitalised with an injury).
There were several limitations of the research. Not having information on injury-related hospitalisations in the ACT prior to 1 July 2004 and that 20.4% Victoria records (up to 3975 child injury hospitalisations per year) were not able to be linked has resulted in underenumeration of injury hospitalisations and treatment costs involving children in Australia. Only health conditions relevant to the hospital episode of care are reported in each record, so it is possible that health conditions experienced by children are underenumerated. The cost estimation only included hospital costs, so will underestimate personal (eg, lost parental earnings), societal and other non-hospital treatment costs. When using record linkage techniques to link hospitalisation and mortality records, there is likely to be some degree of error in the data linkage process. The logistics of obtaining access to the linked hospitalisation and mortality records was time consuming. In total, this study took 4 years to complete, somewhat compromising the timeliness of the findings, but nonetheless this is the most comprehensive examination of child injury hospitalisations and health outcomes in Australia across a 10-year period.
Conclusion
Childhood injury is preventable. Child injury hospitalisation rates have not decreased over a 10-year period and child injury remains a costly public health issue in Australia. Therefore, reducing hospitalised childhood injury remains a national priority. The development of a national multisectorial childhood injury prevention strategy in Australia is long overdue.
What is already known on the subject?
Injury is one of the leading causes of death and hospitalisation for children.
The impact of childhood injury can be life changing.
What this study adds?
Child injury hospitalisation rates have not reduced over a 10-year period in Australia.
Over a 10-year period, child injury hospitalisations cost $A2.1 billion.
Development of a national multisectorial childhood injury monitoring and prevention strategy in Australia is long overdue.
Acknowledgments
The authors wish to thank the State and Territory Departments of Health for providing access to their admitted patient data collections, the Australian Institute of Health and Welfare (AIHW) for providing access to the National Hospital Morbidity Database and the National Death Index and AIHW Data Linkage Branch for conducting the record linkage. The authors would also like to thank the Western Australian Registry of Births, Deaths and Marriages for providing access to Western Australian mortality data and the Western Australian Data Linkage Unit for conducting the data linkage of child injury hospitalisations and mortality data collections in Western Australia.
References
Footnotes
Contributors RM, KC and KF were all involved in study concept and design. RM acquired the data, conducted the analysis and wrote the first draft of the manuscript. RM, KC and KF were all involved in interpretation of data and critical revision of the manuscript.
Funding This research was funded by the Day of Difference Foundation.
Competing interests None declared.
Ethics approval Ethical approval was obtained from eight jurisdiction-based health ethics committees and the Australian Institute of Health and Welfare.
Provenance and peer review Health Department representatives in each jurisdiction and the Australian Institute of Health and Welfare had an opportunity to review the manuscript.
Data sharing statement The data that support the findings of this study are available from the State Health Departments and the National Death Index in Australia, but restrictions apply to the availability of these data, which were used under licence for the current study, and so are not publicly available.