Article Text

Abstract
Background The purpose of this study was to show whether and how levels, trends and patterns obtained from estimates of premature deaths from adverse effects (AEs) of medical treatment depended on the deprivation level in England over the 24-year period, 1990–2013. We provide a report to inform decision-making strategies to reduce the burden of disease arising from AEs of medical treatment in the most deprived areas of the country.
Methods Comparative analysis was driven by a single cause-of-injury category—AEs of medical treatment—from the Global Burden of Disease 2013 study. We report the mean values with 95% uncertainty intervals (UIs) for five socioeconomic deprivation areas of England.
Results In the most deprived areas of England, the death rate declined from 2.27 (95% UI 1.65 to 2.57) to 1.54 (1.28 to 2.08) deaths (32.16% change). The death rate in the least deprived areas was 1.22 (0.88 to 1.38) in 1990; it was 1.17 (0.97 to 1.59) in 2013 (4.1% change). Regarding disability-adjusted life year (DALY) rates, the same trend is observed. Although the gap between the most deprived and least deprived populations of England narrowed with regards to number of deaths, and rates of deaths and DALYs from AEs of medical treatment, inequalities between marginal levels of deprivation remain.
Conclusions The study suggests that a relationship between deprivation level and health loss from the AEs of medical treatment across England is possible. This could then be used when devising and prioritising health policies and strategies.
- adverse effects
- mortality
- DALY
- population health
- England
This is an Open Access article distributed in accordance with the Creative Commons Attribution Non Commercial (CC BY-NC 4.0) license, which permits others to distribute, remix, adapt, build upon this work non-commercially, and license their derivative works on different terms, provided the original work is properly cited and the use is non-commercial. See: http://creativecommons.org/licenses/by-nc/4.0/
Statistics from Altmetric.com
Introduction
Effects of socioeconomic deprivation on overall health status, life expectancy, incidence, prevalence and mortality from a range of diseases and surgeries are well understood.1–4 However, there is little information on how various levels of socioeconomic deprivation impact on health loss arising from adverse effects (AEs) of medical treatment.
It has recently been reported that, in England, marked health inequalities between the least deprived and most deprived English populations remain despite the fact that mortality and disability-adjusted life year (DALY) rates from 306 diseases and injuries have decreased in the country over the period 1990–2013.5 6 Insight into the relationship between deprivation level and premature mortality from a single cause-of-injury category—AEs of medical treatment—in the country is important because clinical AEs are gaining more public and media attention. AEs are often related to human error and the opportunity, therefore, to reduce the disease burden from preventable AEs should be explored.7 8 Furthermore, routine mortality statistics undifferentiated by deprivation level can mask inequalities between subpopulations of the country.5
Previous reports on clinical outcomes from AEs of medical treatment in England were based on either the annual number of patient safety-related incidents—less than 0.5% of incidents involved death4—or a review of randomly drawn medical records at acute-care hospitals in one region of England—8% case fatality rate reported.9 A wider range of case fatality rates from AEs of medical treatment was reported in other high-income low-mortality countries—1.5%–21%.10 11 A relationship between socioeconomic deprivation level and mortality from the AEs of medical treatment in England has not been reported.
The purpose of this study was to show whether and, if so, how levels, trends and patterns obtained from estimates of premature deaths from AEs of medical treatment depended on deprivation level in England over the 24-year period, 1990–2013. We aimed to provide a pertinent report to policy-makers and healthcare professionals that could be used for planning strategies to reduce the burden of disease arising from AEs of medical treatment in the most deprived areas of England. We used a single cause-of-injury category—AEs of medical treatment—from the Global Burden of Disease (GBD) 2013 study for this analysis.
Methods
GBD study
The GBD 2013 is a systematic, comprehensive effort to quantify health loss from 306 causes of diseases, 240 causes of death and 79 risk factors by gender and age groups between 1990 and 2013 for 188 countries. Detailed descriptions of the methodology of the GBD 2013 study, including the estimation process used in generating mortality and DALYs for every single cause, are provided elsewhere.12–14
Study country
The scheme of nine English regions is shown in figure 1. They all correspond to the European boundaries of the Nomenclature for Territorial Statistics level 1 regions. The methodology of a division of the territory of England into small relatively homogeneous geographic areas termed as lower super output areas, covering about 1600 people in average, its further ranking and grouping into 45 subregional deprivation areas and five summary deprivation levels were described elsewhere.5 Briefly, each of the nine English regions was divided into five areas by equal fifth (ie, quintile) of population deprivation based on the Index of Multiple Deprivation 2010, which is a composite index resulting from seven domains, weighted as follows: income (22.5%), employment (22.5%), health and disability (13.5%), education, skills and training (13.5%), barriers to housing and services (9.3%), living environment (9.3%) and crime (9.3%). For a factor of regional geography accounts for only a small proportion of the variance between deprivation areas in England, all 45 deprivation areas of the nine regions of England were grouped into five levels.15 The most deprived areas are referred to as deprivation level 1, moderately deprived areas as deprivation level 3 and the least deprived areas as deprivation level 5.5

Scheme of nine English regions.
The National Health Service (NHS) England is a key provider of comprehensive healthcare service for the whole population of this country. The principle of equity—provision of the same healthcare to all residents of the country regardless of ability to pay, age, gender, race, ethnicity and social factors—is the NHS core. The organised provision of unplanned and planned medical care in the NHS to an individual is free of charge (with a few exceptions permitted by Parliament) at the point of delivery of care. Despite numerous political and organisational changes since the foundation of NHS in 1948, it remains to date a service available universally that cares for people of England, Scotland, Wales and Northern Ireland by need. To note, the NHS is funded by taxes and national insurance contributions. The Department of Health (https://www.gov.uk/government) is the responsible body for the direction of the NHS England by developing policies and strategies, securing resources, setting national standards and monitoring performance. Further introductory information regarding the healthcare system in England and the UK are provided elsewhere.16 17
AEs of medical treatment
Coded AEs from both hospitals and emergency departments were included into the process of methodological estimations for GBD 2013 study. The International Classification of Diseases, Ninth Revision (ICD-9) and The International Statistical Classification of Diseases and Related Health Problems, Tenth Revision (ICD-10) were used to code AEs of medical treatment. A detailed list of 311 codes and other supplemental information on the burden of injury from AEs of medical treatment are available in the annex of Global Burden of Injury paper.14
Estimates
The loss of health from AEs of medical treatment was measured in number of deaths and rates of deaths and DALYs. An online, interactive, data visualisation tool (http://vizhub.healthdata.org/gbd-compare/england), launched on 14 September 2015, was used to retrieve the estimates for mortality and DALYs from AEs of medical treatment for England and the nine English regions at every deprivation level and overall.6 We extracted the means with 95% uncertainty intervals (UIs) for number of deaths, and death and DALY rates per 100 000 men and women of all ages at the year 1990, 1995, 2000, 2005, 2010 and 2013.
Mortality and DALY estimation
Although mortality data in England is assumed to be complete as it is a legal necessity to register every death, it is not accurate.5 For this reason, the cause of death ensemble modelling (CODEm) software was used to derive most probable estimates with 95% UIs for mortality from AEs arising from medical treatment. It minimises the effect of highly possible stochastic variation between regions. Multiplication of number of deaths by the residual expected individual life span at the age of death from the GBD 2013 standard model life table provided the years of life lost (YLLs) due to premature death. Disability secondary to AEs of medical treatment was estimated as a product multiplication of prevalence of individuals in each sequela and the appropriate disability weight for the corresponding health state.13 It is important to note that it was not possible to estimate the probability of permanent health loss from AEs of medical treatment in England due to inadequate data. To produce final estimates for years lived with disability (YLDs), the Bayesian meta-regression method DisMod-MR 2.0 was used. The sum of YLL and YLD is a DALY.
UIs express measurement error affecting all data inputs. They are presented by the 2.5 and 97.5 centile values. The 95% UI estimation for the mean value is inherited within the GBD methods. It is propagated using 1000 draws from the posterior distribution in the estimation process of the metrics. We calculated the percentage difference between the means for deprivation levels 1 and 5 at the same time points, and the percentage change between two values at different points in time.
Ethics
Ethical approval from research ethics committees or institutional review boards is not required for this analytical study.
Results
Deaths
In England, in 1990, an estimated 890.7 (95% UI 644.41 to 999.76) and, in 2013, 776.39 (95% UI 645.07 to 1045.15) inhabitants died from AEs of medical treatment. Figure 2 shows a distinct pattern of disproportional distributions of deaths from AEs of medical treatment remains in England—deaths were more frequent in most deprived areas of the country. The sum of percentage proportions from two most deprived levels, 1 and 2, was 48.26% in 1990 and 43.11% in 2013. Only 12.57% of deaths were attributed to level 5 in 1990 and 15.83% in 2013. In contrast, a proportion of deaths attributed to deprivation level 1 made up 25.59% (of 891 deaths) in 1990 and 21.62% (of 777 deaths) in 2013.

A pattern of disproportional distribution of deaths from adverse effects of medical treatment in a 100% stacked column chart for five levels of deprivation in England between 1990 and 2013. The numbers of deaths (as means) are displayed in 30 colour-coded fractions of the columns. Level 1, most deprived; level 3, moderately deprived; level 5, least deprived.
Death rates
Death rates from AEs of medical treatment in England are presented in table 1. Between 1990 and 2013, the AE death rate dropped by 32.16% at deprivation level 1, that is, from 2.27 to 1.54 deaths per 100 000 individuals, whereas the AE death rate declined by 4.1% at deprivation level 5 in England—from 1.22 to 1.17 deaths—from 1990 to 2013.
Death rates with 95% uncertainty intervals for adverse effects of medical treatment per 100 000 all-age individuals of both genders combined in England and the English regions in 1990 and 2013, by level 1 (most deprived) and level 5 (least deprived)
Regarding the death rates in the English regions, they were higher in all most deprived (level 1) areas of England in comparison with least deprived (level 5) areas in both 1990 and 2013, except for Greater London in the year 2013 where the death rate was higher by 11.65% in the least deprived areas. It is noteworthy that three regions of England—North East, East and South East—had most prominent disparities in AE death rates between level 1 and level 5 in 1990 and 2013. For instance, the North East of England is a particular region in this respect as disparities between death rates at level 1 and level 5 were exceptionally high in 1990 (114.53%) and high in 2013 (44.14%).
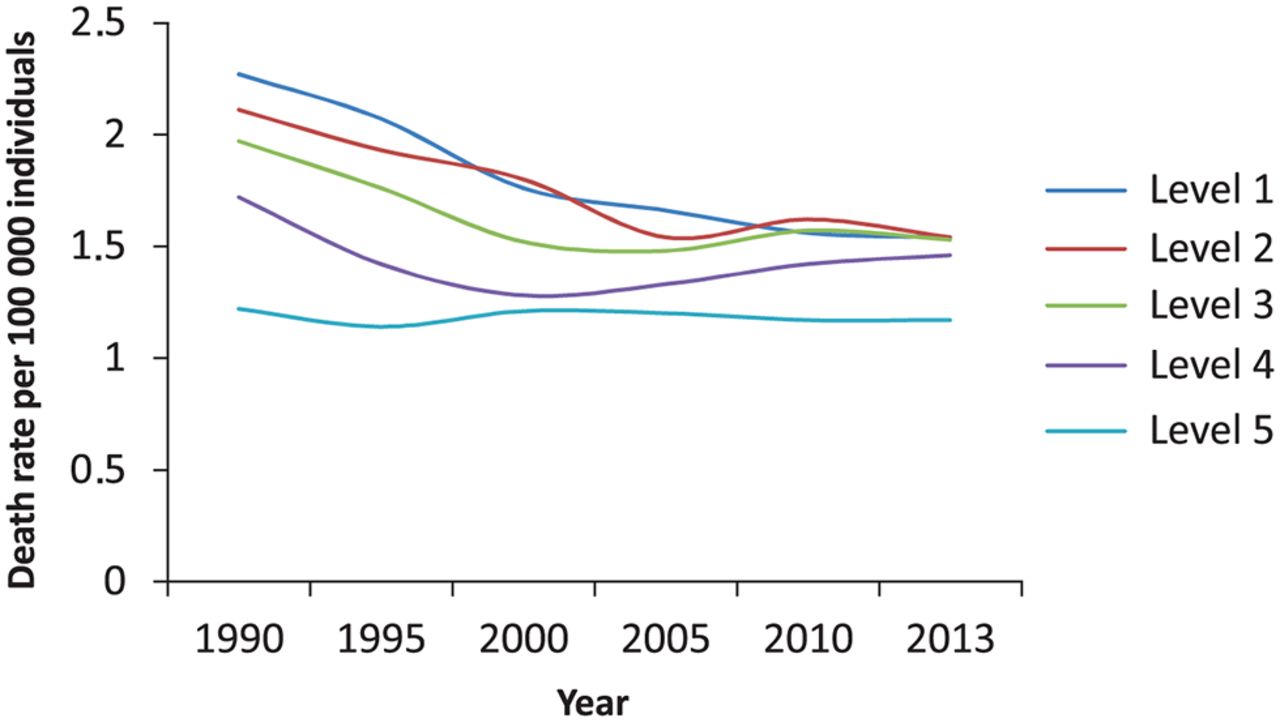
Figure 3 shows trends in England from the mean rates of deaths per 100 000 individuals of both genders combined, by deprivation level, from 1990 to 2013. Lowest death rates from AEs at level 5 (least deprived population) remained stable over a period of 24 years. AE death rates for deprivation levels 1, 2 and 3 declined; the trend lines converged in 2010–2013. The percentage difference between the AE death rates for least deprived (level 5) and most deprived (level 1) populations of England was substantial in 2013—27.31%.

Trends for all-age death rates per 100 000 individuals of both genders in England by deprivation level from 1990 to 2013. Level 1, most deprived; level 3, moderately deprived; level 5, least deprived.
DALY rates
Figure 4 reveals inequalities in DALY rates per 100 000 men and women in England, by deprivation level and year. Highest DALY rates are found among the most deprived (33.72 per 100 000 men and 31.98 DALY rate per 100 000 women in 2013) and lowest DALY rates (22 DALY per 100 000 men and 22.74 per 100 000 women in 2013) are found among the least deprived. Importantly, the trend line for the moderately deprived (level 3) is strictly between marginal levels, and there are no crossovers in trend lines 1, 3 and 5 for men and women. Furthermore, figure 4 shows that variations in DALY rates across the least deprived (levels 4 and 5) areas were minimal in England between 1990 and 2013. Besides, this figure shows that DALY rates decreased by 47.41% in women and 27.75% in men at deprivation level 1, and by 33.08% in women and by 27.17% in men at deprivation level 2 from 1990 to 2013. Although the disparities in AE DALY rates between the most deprived and least deprived areas decreased in England over time, inequalities between them remain.

Inequalities in trends for disability-adjusted life year (DALY) rates per 100 000 men and women of all ages in England by deprivation level from 1990 to 2013; left-side chart for women, right-side chart for men. Level 1, most deprived; level 3, moderately deprived; level 5, least deprived.
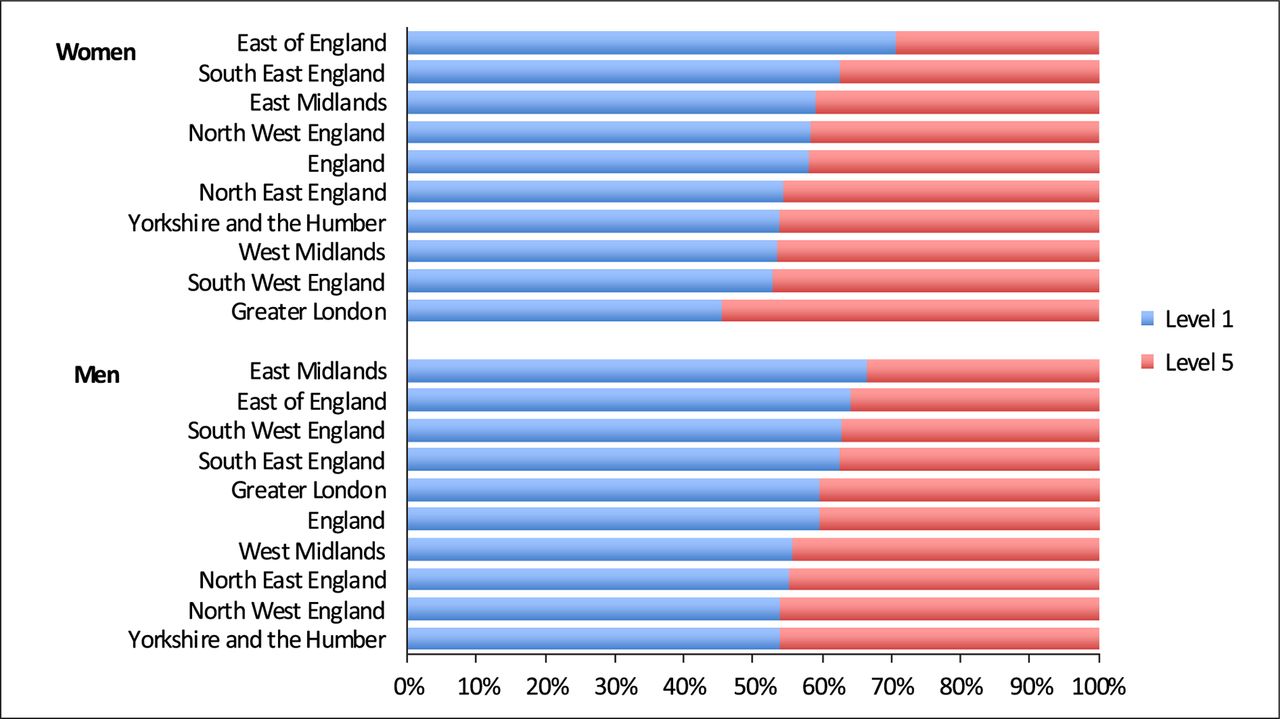
Figure 5 shows the difference between DALY rates for deprivation levels 1 and 5 in 2013, by gender and regional geography of England. The blue colour-coded percentage proportions for DALY rates for most deprived areas (level 1) are more apparent than red colour-coded proportions for least deprived areas (level 5). It indicates that DALY rates in most deprived populations are higher than in the least deprived ones in the country. This pattern is not pertinent only for women from Greater London.

Percentage proportions in 100% stacked bar chart from the mean disability-adjusted life year (DALY) rates for level 1 (most deprived) and level 5 (least deprived) areas across nine regions of England and England per 100 000 women and men of all ages in 2013. Domination of blue colour bars over red colour bars shows that DALY-related burden of adverse effects of medical treatment in most deprived areas of England is distinct from least deprived ones.
DALY rates with 95% UIs per 100 000 individuals of both genders combined from marginal deprivation levels in England and the English regions in 1990 and 2013 are provided in table 2. In 2013, they were lower in all regions of England but West Midlands where DALY rate was higher by 3.02% in the least deprived (level 5) areas. It is important to note that the largest share of DALY originated from YLL—78.38% (95% UI 75.6 to 81.56) and 78.1% (95% UI 77.28 to 82.54) for men and women in England in 2013, respectively. The remainder is attributable to YLD.
All-age disability-adjusted life year rates with 95% uncertainty intervals for adverse effects of medical treatment per 100 000 individuals of both genders combined in England and the English regions in 1990 and 2013 by deprivation levels 1 and 5
Discussion
Results of this analysis suggest an analogical relationship between the level of deprivation and the rates of deaths and DALYs from AEs of medical treatment in England. We hypothesise that the burden of AEs of medical treatment is heavier in most deprived populations because the overall health status is more fragile in those patients. This leads to decreased life expectancy and an increase in mortality from a wide range of primary medical conditions.1 2 Interestingly, previous studies have shown that patients in the most deprived populations are subject to more generic prescribing, drug selection, more frequent antibiotic prescribing and a trend to polypharmacy.18–21 The greater use of cardiovascular drugs in the most deprived young patients with a softer diagnosis of angina pectoris is one example of polypharmacy.21 These phenomena are associated with increased occurrence of AEs of medical treatment, and perioperative AE rates are shown to be higher in patients from most deprived populations.3
Findings of our study highlight that deprivation level affects the outcomes of AEs of medical treatment in England. This suggests that further focused efforts to reduce disparities across different socioeconomic groups are needed to narrow the gap or achieve equity in outcomes from AEs across the country. Shulman et al show increased AEs in patients of low socioeconomic status using insulin pumps and propose specific guidelines to manage this.22
Results of this study demonstrate, too, that the differences in death and DALY rates from AEs of medical treatment between the most deprived and least deprived populations decreased over our study period. This is mainly due to a marked decrease in death and DALY rates from AEs in most deprived populations. There are several plausible explanations for this: First, bearing in mind that life expectancy at birth increased by 5.4 years in England, from 75.9 years to 81.3 years, and age-standardised death rate was reduced by 33.6% between 1990 and 2013,5 we assume that the reduction of those gaps between most deprived and least deprived populations was driven by an overall health status improvement in men and women from the most deprived populations. Second, we hypothesise that long-term programmes and interventions aimed to manage clinical risk and increase patient safety (https://www.england.nhs.uk/patientsafety/) had more impact on deprived patients than their affluent counterparts. Finally, the policy that the NHS is delivering universal and equitable modern secondary prevention and treatment measures for common health conditions independently of socioeconomic circumstances of patients contributed positively in reduction of health loss from hospital AEs following complex therapies.21
Regarding the interpretation of results for Greater London, it was postulated that the overall burden of disease is less than expected in the most deprived groups because of a possible error in the deprivation measuring method, the ethnic composition of the population, healthy migrant effect and selective differential migration.5 However, other studies have suggested that there are poorer outcomes overall on physical and mental health for non-UK-born individuals residing in the UK compared with the UK population.23 Some degree of uncertainty thus remains.
Our analysis has limitations. We could not provide information on incidence and prevalence of AEs of medical treatment by deprivation level in England. This could be demonstrated by further analyses based on GBD studies. Bias associated with a definition of AEs of medical treatment and selection of ICD-9 and ICD-10 codes is possible. A more detailed analysis based on an individual AE code or cluster of codes would identify the proportions of AEs specifically related to pharmacological, surgical and radiological treatments within different socioeconomic groups. It would also be important to depict the impact of deprivation level on the AEs of medical treatment in Northern Ireland, Scotland and Wales.
This analysis also provides some valuable insights into the distribution of AEs of medical treatment in England, by region, gender and deprivation level between 1990 and 2013. It transpires that the highest rates of deaths and DALYs were observed in both Northern regions and Greater London in 1990; in East of England and both Northern regions of England in 2013. Furthermore, inequalities in adverse outcomes from AEs arising from medical care remain, although the NHS in England is delivering equitable treatment to all residents of the country independently of deprivation level. This indicates that other determinants of health status may influence outcomes of medical therapies and play a role in the occurrence of AEs. Examples may include the socioeconomic class-based differences within ethnic groups, racial differences in the society, duration of cultural adaptation of newly arrived residents and effects of preventative medicine interventions for groups of residents at higher risk of illness.24–26 Overall, our study supplements a systematic analysis of changes in health in England, for it precisely pinpoints the levels, shows the trends and highlights the patterns of health loss from AEs of medical treatment in the population of this country over the 24-year period.5 It provides a platform for further research based on specific ICD-10 codes to clarify the burden of individual AEs of medical treatment in England. This could help to understand causes and circumstances associated with them, and develop AE prevention strategies.27
In conclusion, our study suggests that a relationship between deprivation level and health loss from the AEs of medical treatment across England and its regions is possible. This could then inform those responsible for devising and prioritising health policies and strategies.
What is already known on the subject
Important previous reports on outcomes from adverse effects (AEs) of medical treatment in England were based on either the annual number of patient safety-related incidents or a review of randomly drawn medical records at acute-care hospitals in one region of England.
What this study adds
We present levels, trends and patterns from deaths and disability-adjusted life years (DALYs) with relation to socioeconomic deprivation for England (and the nine English regions) over the period 1990–2013.
We demonstrate that the gap between the most deprived and least deprived populations narrowed with regards to number of deaths and the rates of deaths and DALYs.
We highlight that inequality remains between marginal deprivation levels across England and within its regions in terms of death and DALY rates from AEs of medical treatment.
We state that a relationship between deprivation level and health loss from the AEs of medical treatment is possible.
We provide a report to inform decision-making strategies to reduce the burden of disease arising from AEs of medical treatment in the most deprived areas of England.
Acknowledgments
We would like to thank Dr Elizabeth Wilson for editorial assistance (Aintree University Hospital NHS Foundation Trust, Liverpool, UK).
References
Footnotes
Contributor RL was responsible for the study concept, design, data analysis, interpretation of data and drafting the manuscript. RL takes responsibility for the integrity of the data and the accuracy of the data analysis. JAH contributed providing guidance, revised draft critically and substantially for important intellectual content. Authors had full access to all of the data (including statistical reports and tables) in the study. RL is the guarantor for the study.
Funding This study had no specific funding. Bill & Melinda Gates Foundation is sponsor of overall GBD project. It had no role in study design, data collection and analysis, decision to publish or preparation of the manuscript. The researchers are independent from the funder of GBD 2013 study.
Competing interests None declared.
Provenance and peer review Not commissioned; externally peer reviewed.
Data sharing statement Primary data available athttp://vizhub.healthdata.org/gbd-compare/england.