Article Text

Abstract
Objectives Child pedestrians are some of the most vulnerable users of our transportation systems, and they deserve particular attention when we consider traffic safety. The objective of this work is to identify urban locations in which child pedestrians are at particular risk for fatal collisions with vehicles.
Methods This paper examines 30 years of crash data for six American cities to locate areas with high child pedestrian fatality concentrations. Phase I of the study, which examines Denver, Colorado, USA, reveals higher concentrations of child pedestrian fatalities around parks as compared with other areas that children have been shown to frequent. In phase II of the study, we specifically examine fatality concentrations near parks as compared with schools.
Results Statistical analyses suggest that, once exposure is controlled for, child pedestrian fatalities concentrate around parks in densities 1.04–2.23 times higher than around schools. Also, the concentration of child pedestrian fatalities around parks is 1.16–1.81 times higher than the respective citywide concentration.
Conclusion Traffic risks for children around parks deserve further examination as we pursue the goals of Vision Zero and child safety on our streets.
Statistics from Altmetric.com
Introduction
Walking for transportation during childhood has important health and social benefits as it encourages physical activity and independence.1 ,2 Yet, children are often not able or allowed to safely and comfortably walk to their destinations. Traffic safety is one of the primary barriers to such active transportation in children.3 Motor vehicle collisions are the leading cause of death for individuals from the age of 4 through the age of 24 in the USA, with pedestrians being the second most at-risk user type.4 Every hour, an average of 40 children die on roadways around the world, most of whom are vulnerable road users such as pedestrians.5 Despite the unfortunate road safety statistics of child pedestrians and the known health benefits of childhood walking, our transportation networks remain alarmingly dangerous for the few children that still walk independently. The question addressed through this work is: are there other land uses where we should be focusing our resources—beyond our traditional focus on schools—to alleviate large concentrations of child pedestrian fatalities?
Many researchers and practitioners have exerted considerable effort exploring child pedestrian safety around schools. These researchers and practitioners have found success when the necessary resources are allotted to combat the problem near school grounds. For example, reduced speed limits in school zones have been shown to lower vehicle speeds while projects funded by the Safe Routes to School programme have reduced child pedestrian injury rates.6–10 However, other locations within our cities that are frequented by children remain relatively unexplored.11 ,12 The scant literature on the subject suggests that the areas around trails have relatively few child pedestrian crashes, while other research found that areas with few child pedestrian injuries contained a prevalence of parks and play areas, and similarly, that areas at high risk for traffic crashes involving pedestrians under the age of 15 were characterised by an absence of parks.13–15 Furthermore, an analysis of child injuries associated with playground visits in the USA found that pedestrian injuries were so uncommon that a statistical analysis was not possible.16 This current work will fill the gap in the literature by further exploring concentrations of child pedestrian fatalities throughout our urban areas.
In phase I of the study, we use spatial and statistical analyses to compare child pedestrian fatality concentrations around schools with concentrations around other areas that children may frequent—such as recreation centres, parks and trails—in Denver, Colorado, USA, using 31 years of crash data.17 ,18 In phase II, based on findings from the first analysis, we then examine parks in more depth relative to schools in six different cities. The goal of these research activities is to identify the location of high concentrations of child pedestrian fatalities, thereby starting the critical conversation of how to best protect children in our cities' transportation systems.
Data
The study cities were selected because focusing on rapidly growing cities would allow for the examination of current development patterns. While early US cities were designed with pedestrians and streetcars in mind, those developed over the last century were primarily designed to cater to the automobile. Studying these modern autocentric cities will allow the results to inform current building practices. By having a clearer understanding of the implications of our current community designs, we can build safer places for even the most vulnerable road users. According to Census data, the South was the quickest growing region between 2000 and 2013, while the West was close behind.19 Therefore, cities from these two regions became the focus of this study.
Of the 25 most populous places across the USA, Austin had the largest percentage increase in population from 2000 to 2013, Charlotte had the 2nd largest increase, Denver had the 3rd largest increase and Dallas had the 10th largest increase.19 Houston had the second largest growth in total population, while Los Angeles had the fourth largest total growth.19 These cities with substantial population growth are important to study because they are installing new infrastructure in new and unique land-use configurations. The safety outcomes of these new land-use configurations are what we hope to explore through this work. Other cities with high growth rates were not used because comprehensive schools, parks, trails and crash data were not available due to a lack of data collection.
Crash data
We acquired child pedestrian fatality locations from the National Highway Traffic Safety Administration's Fatality Analysis Reporting System for the years 1982 through 2012. This data were available from 1982 to 2000 in address format, and from 2001 until 2012 with latitude and longitude coordinates. Crashes from 1982 to 2000 were geocoded on either the address level or, if the data did not contain enough detail, to the street level. Children were defined as persons under the age of 18. City boundaries were defined by the ‘Places’ shapefile provided by the US Census Bureau through their Topologically Integrated Geographic Encoding and Referencing products.
Exposure data
Due to consistency issues, finding reliable child pedestrian exposure data in geographically broad studies has historically been difficult.20 The best option for this particular study, when numerous exposure approaches were assessed, was to use a population-based exposure metric such as that used by DiMaggio and Li9 in their safety examination of the Safe Routes to School programme. In their study, DiMaggio and Li9 used the number of pedestrian crashes in selected census tracts and the number of persons living in those same census tracts to create a rate of crashes per 10 000 population for each of the tracts. While past studies modelled pedestrian exposure using proxy factors such as road network characteristics, land use and socioeconomics, population-based exposure metrics are also common and have proven useful for preliminary and/or geographically broad work.20 ,21 Given that our study fits both of these conditions, a population-based metric facilitated a consistent child pedestrian exposure metric to study road safety across six US cities. Although there were a number of limitations associated with this population-based exposure metric (which will be detailed in the Conclusion section), analysis on the block group level did allow for finer-grained contexts to be considered.
The exposure variable for the analysis was the number of children living within the analysis zones. This variable was created by pulling the child populations for each block group from the 2010 Census and creating a random point for each child resident. This served as an indicator of the total number of children and a proxy for the relative level of child pedestrian traffic exposure in the study areas. This population-based exposure approach allows for a conservative analysis in terms of parks due to the fact that exposure around schools is typically higher than around parks. Almost all children attend school while not all children use parks. Also, schools get usage from weekday school trips and recreational trips for playgrounds and sports fields on the grounds while parks only experience usage for recreational purposes. Using the same population-based exposure approach for all areas ensured a thoroughly conservative analysis of the risk around parks.
Child-friendly destinations data
We chose child-friendly destinations because past research identified them as public places that children frequent as both recreational and physical activity resources.17 ,18 We obtained locational data for the child-friendly destinations from the publicly available 2015 open data catalogues for the respective cities. The number of schools and parks within the study cities ranged widely (table 1). Buffers were then created based on the location of the buildings for schools and recreation centres and based on the parcel boundary for parks. This facilitated a more accurate representation of access than, for instance, if parks were based on a single point. The buffers for the trails were drawn adjacent to the entire trail; however, this may not be representative of the actual access points. Study areas were designated by quarter-mile buffers around the facilities. This quarter-mile buffer size was chosen because it has been shown to be an appropriate access threshold for children, or the longest distance that children are typically allowed or able to independently walk to their destinations.22 Also, the shortest service area with which parks and recreation areas are typically designed is one-quarter of a mile.23 For instance, regional parks are normally designed to serve entire cities, while pocket parks may be designed to serve just the surrounding blocks. Because every park has at least a quarter-mile service area, this is an effective buffer size to use.
Descriptive statistics for study cities
An ‘Erase’ command was run on the park buffers so that the actual parks were not included in the buffer area. Since there were no fatalities within the parks, erasing the park area did not impact the number of fatalities, but ensured that the exposure variable was not inflated. Thus, the park buffer consisted of only the land a quarter-mile outside of each park.
Methods
In phase I, we examined child pedestrian fatality concentrations at four destinations that children frequent (ie, schools, recreation centres, trails and parks) in Denver, Colorado, USA. The other study cities were omitted in phase I because of data limitations. In phase II, we investigated schools and parks in more detail across six study cities.
Phase I study methodology
On completion of the data collection and formatting, we initiated spatial analysis by defining the study area buffers and calculating the number of child pedestrian fatalities in those study areas. This was completed through spatial joins in ESRI's ArcMap (figure 1).

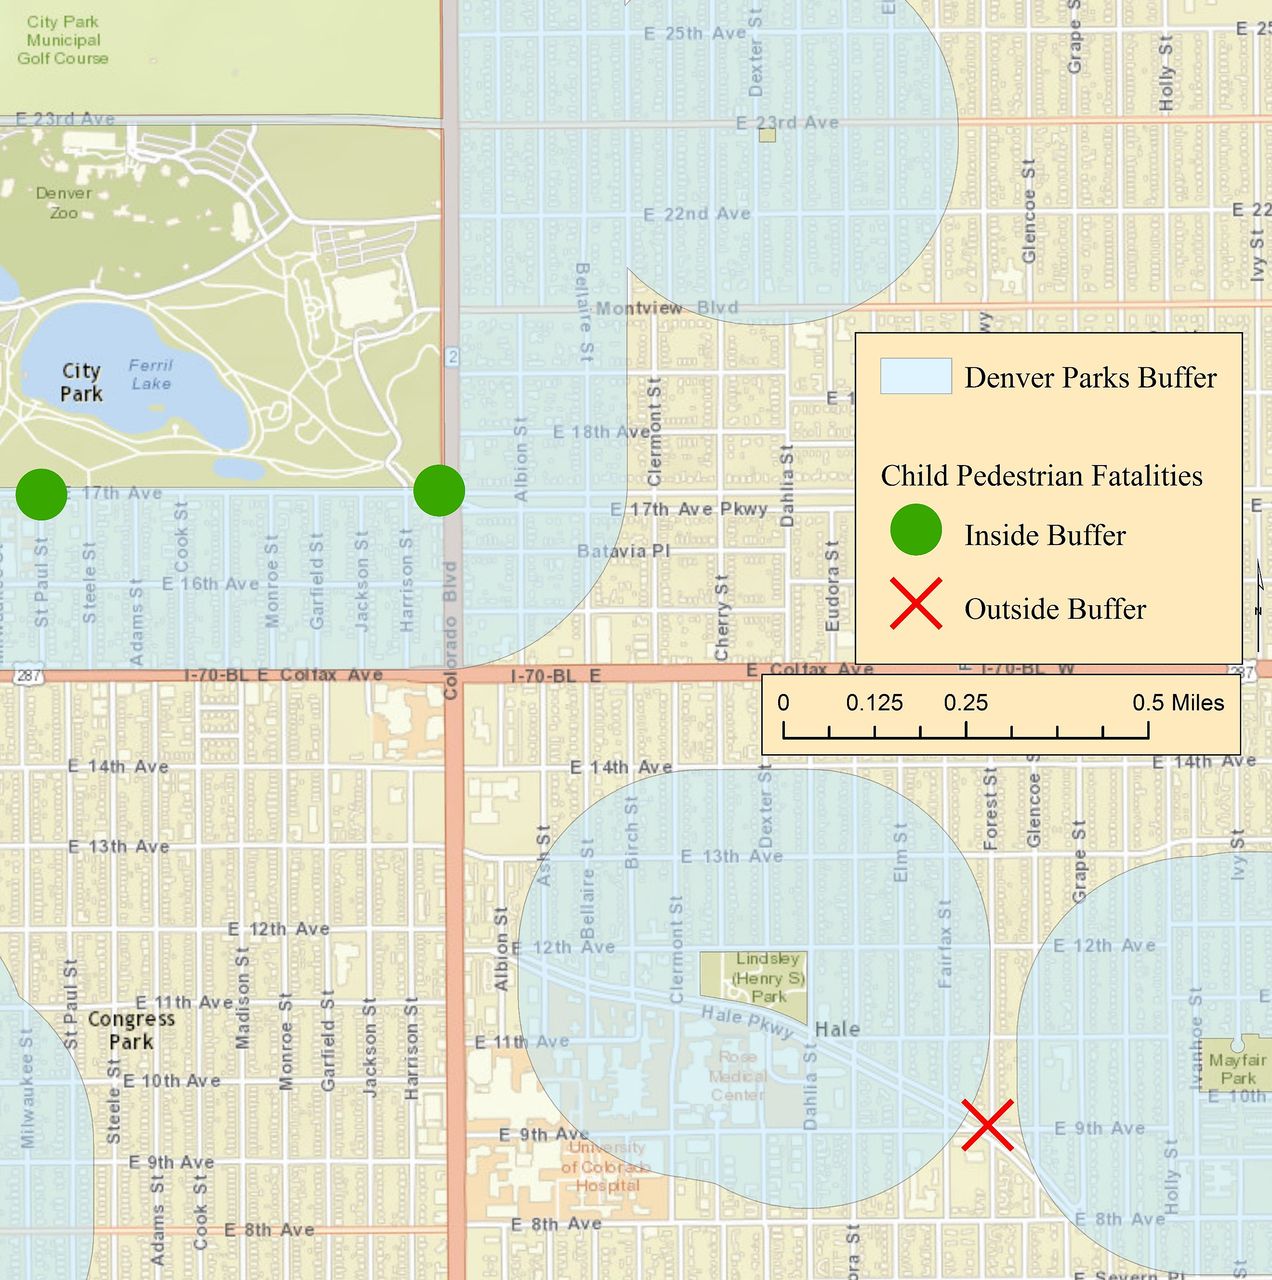
Child pedestrian fatalities relative to park buffers in Denver.
After the number of child pedestrian fatalities was derived through spatial queries for each of the zones, the same procedure was run again to find the total number of children living within those zones. This formed the study's exposure variable, allowing for a rate of fatalities per 10 000 children to be operationalised.
There were no child pedestrian fatalities around recreation centres in Denver (table 2). This suggests that recreation centres are not a primary problem for child pedestrian safety. Trails had rates similar to schools and parks. However, it is not clear if children use trails in the same manner that they use parks and schools. Access to trails is typically constrained, and the location of the child pedestrian fatalities near trails did not appear to necessarily correlate with trail access points. Trails typically have limited access points while child-friendly destinations such as parks have more permeable access along their borders.24–27 Parks were of interest due to the fact that they had the highest fatality rates. We therefore examined parks in phase II by comparing their fatality rates with the fatality rates around schools, which have been the traditional focus.
Child pedestrian fatality rates per 10 000 children near child-friendly locations
Phase II study methodology
Based on findings from the preliminary study, a second analysis of child pedestrian safety around parks was warranted. Parks and schools were therefore examined in more detail for six cities: Austin, Texas; Charlotte, North Carolina; Dallas, Texas; Denver, Colorado; Houston, Texas; and Los Angeles, California.
Using the same procedure from the previous analysis, the child populations and the number of child pedestrian fatalities were derived for analysis (table 3). These variables were considered for areas near schools, areas near parks, areas near schools or parks and areas near neither schools nor parks. The level of risk was derived for each city, location type and year within the study. CIs were then computed.
Child pedestrian fatality statistics and child resident statistics near destinations
Results
The results suggest that, for all of the study cities, child pedestrian fatality rates are significantly higher in areas near a school or a park than in areas near neither a school nor a park (table 4). Fatality rates in areas that are near a park or a school are significantly higher than the average citywide rates for five of the six study cities and not significantly different for one of the study cities.
Child pedestrian fatality rates per 10 000 children living around schools or parks or neither schools nor parks with 95% CIs
Risk was found to be higher around parks than around schools for all of the study cities (table 5). Dallas has the largest difference between schools and parks in terms of risk, with child pedestrians being over twice as likely to experience a fatality within close proximity to a park than within close proximity to a school. All of the fatality rates around parks are significantly higher than the rates around schools except for in Denver. Rates around parks are also higher than the average rates citywide for all study cities, and are significantly higher for each city except for Austin. Rates around schools are higher than the average citywide rates for just three of the six study cities, and only two of these are significantly higher.
Child pedestrian fatality rates per 10 000 children living around schools and parks with 95% CIs
Conclusion
While past efforts to ensure child pedestrian safety have focused primarily around schools, findings from this work suggest that parks may be an important location to focus on as well. In all of the six study cities, risk for child pedestrian fatalities is higher around parks than around schools, although not all of these differences were statistically significant. The risk around parks has, prior to this research, been largely overlooked. Reasons for higher rates around parks may include unsafe streets along with a general lack of awareness, focus, education and engagement in terms of the transportation safety issues present.
There are two perspectives through which we may interpret solutions to this problem: transportation and urban design. Taking a transportation approach to the problem would have us lowering vehicle speeds and making drivers aware of child pedestrians through street design changes such as traffic calming, road diets or pedestrian crossing treatments. A broader urban design approach would focus on the siting of our parks. If we site a park next to a six-lane roadway with a high design speed, few transportation treatments would be able to help. Within the study cities, it was not uncommon to have a park separated from the community that it serves by roadways with four or six lanes. Some of these roadways have been documented with vehicle speeds >70 mph next to the adjacent park.28 Siting parks on slow and narrow local roads within neighbourhoods may help alleviate safety issues and thereby induce higher levels of independent walking. The most effective solution to the problem may very well lie in a combination of both these approaches. We will need to ensure that parks are sited safely within neighbourhoods, and pedestrian infrastructure is provided in a cohesive network to ensure safe access. In addition to these built environment improvements, other approaches—such as child education, driver education and enforcement methods—may prove effective.
There were several limitations present in this study. Many of the limitations were related to the measurement of child pedestrian exposure. A consistent exposure metric was necessary, which led to a population-based exposure metric. We considered conducting a survey to measure exposure, but survey data have been found to significantly under-represent child pedestrian exposure, and low response rates may introduce self-selection issues.29 ,30 We also considered observational data, but observational data fail to properly consider potential endogeneity issues between perceived risk and exposure; in other words, a road perceived to be dangerous could be the cause of the low exposure and result in a seemingly good safety record. This would violate the independence assumption of most statistical models.31 Moreover, observational data are difficult to acquire across multiple cities in large enough numbers to ensure sample sizes that reach statistical significance and are representative of actual conditions.32 For these reasons, a population-based exposure metric was used. The exposure metric assumes that individual children will be exposed to traffic dangers at similar rates across the study cities. While this assumption is not necessarily ideal, most children walking to a child-friendly destination such as a school or park would likely live within a quarter-mile of that school or park.22 Examining finer geographical levels and exploring different methods of operationalising, child pedestrian exposure will be necessary to obtain a better understanding of the issue.
The fact that children of all ages are assumed to act similarly and experience similar risk is another limitation of the exposure metric. In other words, the risk to a 5-year-old pedestrian walking independently to a park is most likely higher than the risk to a 13-year-old walking independently to a park. However, the 5-year-old pedestrian is more likely to be accompanied by a parent, typically alleviating some of the risk. This relationship between age and risk is complex, and deserves more attention. Also, examining risk for child pedestrian injuries around parks would provide larger sample sizes and more robust statistical analysis than child pedestrian fatalities. Focusing on finer geographical levels may allow for an injury-specific analysis.
A further limitation was the lack of knowledge pertaining to installation dates of schools and parks. It should also be noted that results may be exclusive to the generally warm climates of the study cities, and generalisability of the findings should not be assumed for other contexts. Other factors that may prove to be of importance include social factors such as population density, poverty and crime, and built environment factors such as travel lanes, vehicle speeds and cartway width.
Child pedestrians, being highly vulnerable users of our transportation systems, find themselves at substantial risk as they move about our cities. Ensuring their safety is of the utmost importance. However, to ensure that safety, one must understand where safety risks are located. This study has shown that, opposed to traditional beliefs, there are higher concentrations of child pedestrian fatalities around parks than around schools. A shift in the child traffic safety paradigm is now needed to focus treatment efforts around our parks.
What is already known on the subject
Child pedestrians are some of the most at-risk users of our transportation systems.
Considerable resources are spent to ensure child pedestrian safety around schools.
What this study adds
Examines other urban areas to determine if there are additional locations of concern.
Finds that child pedestrian fatality concentrations are higher around parks than around schools.
SafetyLit—too often overlooked
David Lawrence has struggled to provide injury prevention practitioners and researchers with a monthly summary of relevant published work, SafetyLit. The Abstracts from the Finland World Injury Conference were included on the site, and quite sensibly he listed these in alphabetical order by presentation title. This offended some presenters. His response, which I hope is sarcastic, was, “My heart truly aches and my brain worries for those who were angered and offended when their (or their student’s) presentation was not (yet) included. I don’t understand the way the world works today.” To help him overcome his grief, be sure to visit this splendid resource: http://www.safetylit.org/archive.htm.
Drunk canoeing=impaired driving?
Canada is about to remove the penalty for paddling a canoe while drunk. Previously, if convicted, it would be treated like drunk driving with serious penalties such as licence suspension. t There is at least one recent case when a child was killed when in a canoe with an allegedly drunk adult. Comment: The Canadian Safe Boating Council has stated its opposition to the proposed change. Drunk canoeists who cause a death could still be charged with negligence under the criminal code.
Canada to lower legal limit of alcohol
Strict new drunk-driving laws, now considered to be the toughest in the country, took effect in BC this past summer. Now the federal government is asking Ontario to consider lowering the legal blood-alcohol limit to make it a criminal offence to drive with more than 50 mg of alcohol in 100 mL of blood. This would make it easier for police officers to crack down on impaired drivers. Ontario now penalises people driving between 50 and 80 mg of alcohol with a 3-day roadside licence suspension. The proposed decrease would mean criminal charges for those who exceed the limit. Mothers Against Drunk Driving Canada has long advocated for this change along with much more vigorous enforcement.
References
Footnotes
Contributors NNF formulated the original research question, collected the data and formatted it for analysis. He performed initial analysis and wrote much of the paper. He worked all the way through final submission. WEM helped to craft and refine the research question, as well as provided guidance with the data collection, methods and analyses. He was instrumental in providing assistance throughout the multiple iterations of the paper including editorial support through the final submission.
Competing interests None declared.
Provenance and peer review Not commissioned; externally peer reviewed.