Article Text

Abstract
Background Maps identifying the most distinctive feature of each state have become popular on social media, but may also have important public health applications. A map identifying the most distinctive injury death in each state could be a useful tool for policymakers, enabling them to identify potential gaps in prevention efforts.
Objective To identify the most distinctive cause of injury death in each state and explore potential reasons for the geographical variation.
Methods The Centers for Disease Control Web-based Injury Statistics Query and Reporting System was used to identify the injury death for each state with a rate which was the largest multiple of the national rate. Analyses were conducted with and without inclusion of ‘indefinite’ codes, which include injury causes of death of undetermined intent, unspecified person killed in a motor vehicle crash (MVC; vehicle occupant, cyclist, pedestrian, etc) or unspecified injury.
Results Noteworthy patterns included seven states in Appalachia and the Southeast with high relative rates of unintentional firearm deaths (2.14–4.06 times the national average) and five states on the West Coast with high relative rates of legal intervention deaths (1.76–3.49 times the national average). Sensitivity analyses indicated that use of ‘undetermined intent’ classifications and the level of detail in coding MVCs vary substantially by state.
Conclusions These analyses highlight potential areas for prevention, such as promotion of safe storage laws in states with relatively high rates of unintentional firearm deaths and areas where standardisation of cause of death codes could be improved.
Statistics from Altmetric.com
Introduction
Maps have become an increasingly popular medium to convey patterns and trends. Social media, in particular, has embraced this mode of communication. One common type of map shows the most ‘distinctive’ characteristic of each state. For example, the most distinctive band,1 cuisine,2 or job.3 These maps do not show the most popular item in each state, but rather which items are disproportionately popular—that is, the largest multiple of the national average. Recently, researchers have applied this methodology to public health. Using International Classification of Disease, V.10 (ICD-10) cause of death codes from the Centers for Disease Control and Prevention (CDC) WONDER (Wide-ranging Online Data for Epidemiologic Research) database, Boscoe and Pradhan4 analysed the most distinctive cause of death in each state.
A cause of death may be the most distinctive in a state for several reasons. First, and perhaps most intuitively, the most distinctive cause of death may be related to some aspect of the physical environment. For example, one might expect that states with access to large bodies of water would have more deaths from drowning. Second, the most distinctive cause of death may be related to a certain set of policies or cultural attitudes. For example, states may have different policies for, or cultural attitudes towards, impaired driving or firearms, which may in turn lead to geographical variation in these types of deaths. Finally, there is geographical variation in the way in which deaths are classified. Although a standard set of codes are used, there is a substantial grey area in determining cause of death. Boscoe and Pradhan4 noted that this is particularly true of codes that start with the word ‘other,’ indicating that states vary greatly in the level of detail included in their coding.
The primary goal of this analysis is similar to that of Boscoe and Pradhan: to determine the most distinctive cause of death in each state. However, this analysis will focus on injury deaths and use more recent data (2004–2013). A secondary goal is to take preliminary steps to explore the relative contributions of differences in geography and the physical environment, policy and culture and measurement to the distinctiveness of injuries.
Methods
Data and injury categories
All data for this analysis were obtained from the CDC Web-based Injury Statistics Query and Reporting System (WISQARS).5 These data are publicly available at the state and national levels. Ten years of data (2004–2013) were included for all 50 states and the District of Columbia. Cause of death is based on ICD-10 codes recorded on death certificates. All possible, mutually exclusive injury categories were examined, with the exception of the two ‘adverse medical events’ categories, which were considered to be outside the scope of this study. Injury categories were excluded from the analysis if no state had more than 20 deaths from the injury over the 10-year period, as the associated death rates are considered unstable.5 This research was classified as not human subjects research by the Johns Hopkins Bloomberg School of Public Health institutional review board.
Analysis
For each state, the age-adjusted mortality rate per 100 000 population for each injury category was divided by the corresponding age-adjusted national rate. Age-adjusted rates were directly calculated and standardised to the 2000 total US population. All ages, races and ethnicities were included in state and national rates. We used similar methodology to Boscoe and Pradhan,4 to identify the injury category that was the largest multiple of the national rate and had at least 20 deaths over the study period. The most distinctive cause of injury death for each state was then mapped using ArcGIS software.6 States may differ in their classification of ‘indefinite’ injuries, defined here as any injury cause of death of undetermined intent, unspecified person killed in a motor vehicle crash (MVC; vehicle occupant, cyclist, pedestrian, etc) or unspecified injury. These codes are described in detail in online supplementary table S1. Analyses were performed with and without indefinite injuries to test the sensitivity of the results to their inclusion. The top four leading causes of injury death in the USA were calculated and compared with the most frequently occurring, most distinctive causes of death.
Coding variability
One of the greatest concerns about using cause of death data from death certificates is that the cause of death is not consistently coded by location. The role and qualifications of those who determine and record cause of death differ by state. Depending on the state, either a medical examiner or coroner will determine the cause of death.7 Coroners and medical examiners may be appointed or elected, depending on the state and have different training requirements.7 Medical examiners typically have more extensive scientific training and are more likely to classify deaths as suicides as compared with coroners.8 Research also indicates that states do not consistently use ‘undetermined intent’ ICD-10 codes, particularly for poisonings.9 There may also be variability in use of the unspecified person category in motor vehicle accidents with some states being much less likely to indicate whether the person who died in a MVC was a vehicle occupant, pedestrian, cyclist, etc. Thus, some injury death rates may be distinctive, at least in part, due to differences in classification rather than a real difference in rates of injury death. While we are not able to make this distinction on a case by case basis, we have developed two measures to provide a sense of the relative contribution of potential misclassification to the results. The first measure, called the Suicide Classification Ratio (SCR), is calculated using the following formula:

A SCR close to one indicates that the state tends to classify injuries as suicide compared with undetermined intents at approximately the same rate as nationally. A SCR that is substantially greater than one indicates that the state is much more likely to classify the injury as a suicide than expected based on national data. A SCR substantially less than one would indicate that the state is less likely to classify the injury as a suicide than expected based on national data and that the state's injury is distinctive despite potential measurement bias in the opposite direction. Similarly, a Motor Vehicle Classification Ratio (MVCR) was calculated using the formula:

Deaths involving a MVC allow for detailed codes specifying whether the injured person was a vehicle occupant, pedestrian, cyclist, etc, and whether the intent was unintentional, homicide or suicide, but these specifications are often not given. Thus, for states with a specific category of MVCs as the most distinctive cause of injury death, the MVCR indicates whether use of that code category is higher or lower than expected based on national data. SCR and MVCR are calculated for all states with suicides or MVC categories as their most distinctive cause of injury death.
Results
Injury categories
Thirty-four injury categories met inclusion criteria. The final set of code groupings and descriptions of injuries used for this analysis are provided in online supplementary table S1, together with the additional unspecified injury categories.
Most distinctive injuries
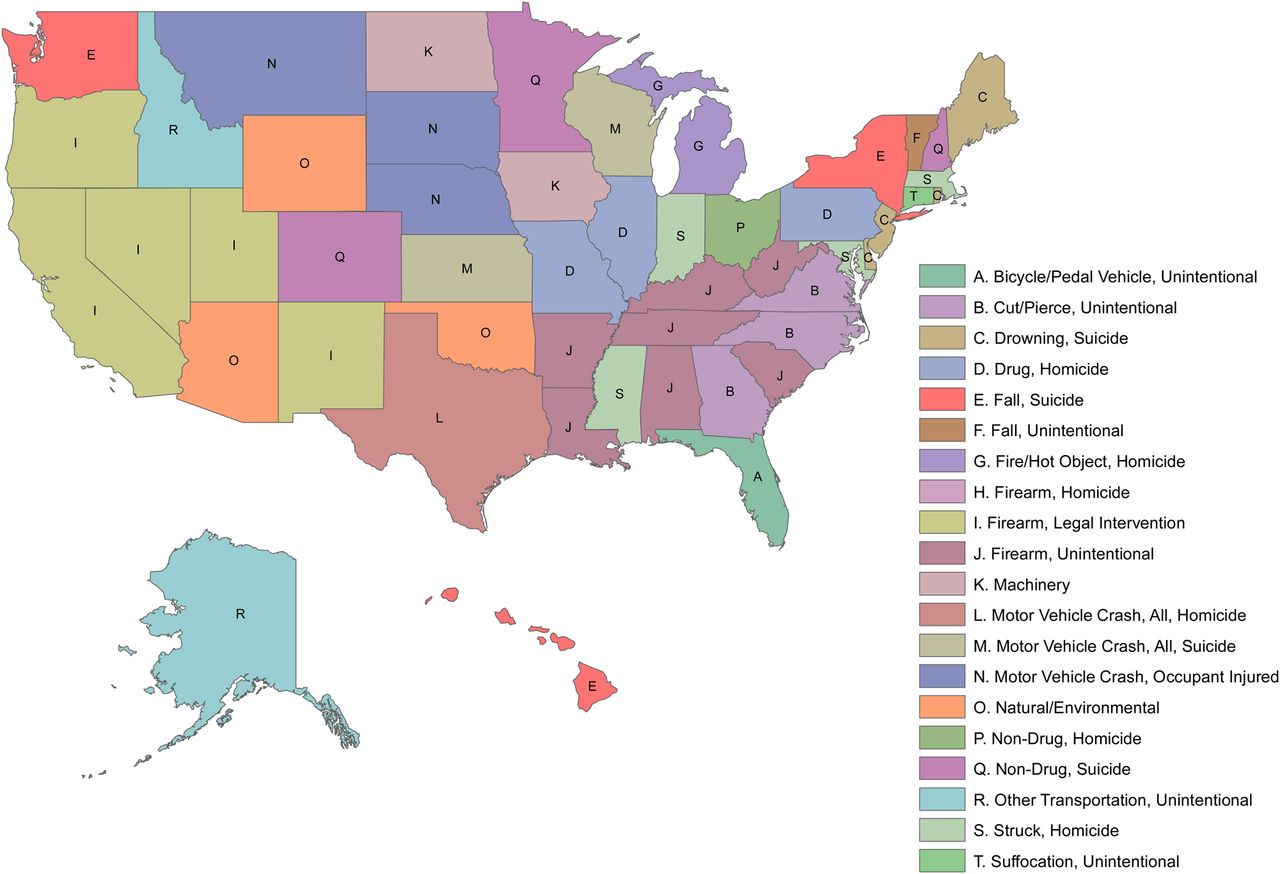
The most distinctive injury deaths for each state are provided in table 1 and mapped in figure 1. The most distinctive cause of injury death with the greatest rate ratio (state injury rate/national injury rate for a given injury) was ‘other transportation death, unintentional’ in Alaska with those injuries occurring at 7.61 times the national rate. No state's most distinctive cause of injury death was less than the national rate, but Virginia had the smallest rate ratio with ‘cut/pierce, unintentional’ injury deaths occurring at 1.30 times the national rate. A few geographical patterns are noted. Most strikingly, the seven states for which ‘firearm, unintentional’ is the most distinctive are clustered in Appalachia and the Southeast (West Virginia, Kentucky, South Carolina, Louisiana, Arkansas, Alabama, Tennessee). The five states for which ‘firearm, legal intervention’ is the most distinctive are all in the western part of the country and three states on the Southeast Coast had ‘cut/pierce, unintentional’ as their most distinctive injury death. Rural, Western and Midwestern states tended to have higher rates of motor vehicle, machinery and natural/environmental deaths.
Most distinctive*injury death for each state
The most distinctive* injury death in each state. *Defined as the injury death for which the state death rate is the largest multiple of the national death rate.
Most frequent distinctive and overall injury deaths
The most frequent injuries, overall (ie, the injuries with the highest national rates) are presented in table 2. The highest rate of injury deaths based on the categorisation system outlined in online supplementary table S1 is for ‘drug poisoning, unintentional’ at 9.02 deaths per 100 000 people. However, it is important to note that motor vehicle deaths have been subdivided into several categories for this analysis and that the overall rate of all motor vehicle death, regardless of who was killed or intent, is 12.92 deaths per 100 000 people. The injuries that occur most frequently in table 1 (ie, the most frequent most distinctive injuries) are also presented in table 2. A more detailed comparison of the most frequent and distinctive injuries by state is provided in online supplementary table S2.These injuries occur at a much lower rate and have greater variability than the four most frequently occurring injuries, overall. The most distinctive cause of injury death that occurs most frequently in table 1 and has the largest variability is ‘firearm, unintentional,’ which was the most distinctive injury death for seven states and has an IQR of 0.12–0.38 deaths per 100 000 people. The lowest rate, after excluding states with fewer than 20 unintentional firearm deaths, was for Massachusetts which only had 21 unintentional firearm deaths; an age-adjusted rate of 0.03 deaths per 100 000 people. In contrast, Louisiana had 364 unintentional firearm deaths over the same time period; an age-adjusted rate of 0.8 deaths per 100 000 people. In other words, Louisiana had 27 times the rate of unintentional firearm deaths as Massachusetts (data not shown).
Most frequent distinctive* and overall injury deaths
Classification of injury intent and MVCs
After adding the indefinite injury categories, the most distinctive injury changed for 18 of the 50 states. These changes are noted in table 1. Interestingly, the only state where ‘unspecified injuries’ was the most distinctive injury death, was Virginia. As shown in table 1, Virginia also had the lowest rate ratio for its most distinctive injury at 1.30. This may indicate that Virginia's apparently low injury rates relative to the national average are in part due to lack of specificity in reporting. In general, the maximum ratios after including the indefinite injury categories were less than twice the maximum ratio not including indefinite injuries, with the exceptions being Hawaii (4.4 for fall suicide vs 11.9 for non-drug poisoning, undetermined intent), Maryland (2.2 for struck, homicide vs 9.7 for drug overdose, undetermined intent), Utah (1.97 for firearm, legal intervention vs 8.55 for drug poisoning, undetermined intent) and West Virginia (3.0 for firearm, unintentional vs 15.0 for fire, undetermined intent). This indicates that, in these four states, certain deaths may be classified as being of undetermined intent far more frequently than in other states.
The SCR and MVCR are presented in tables 3 and 4, respectively. For both falls and non-drug suicides, the ratios are substantially lower than one. This indicates that these causes of death are not the most distinctive because states are more likely to classify deaths as suicides. It seems that these states may be overcoming a measurement bias in the opposite direction. By contrast, states with drowning suicide as the most distinctive cause of death may be more likely to classify drowning deaths as suicides than as undetermined intent. Similarly, in states where a motor vehicle cause of death is listed, those states are much more likely to have given a specific cause of death than nationally. This indicates that the high rate of certain types of motor vehicle deaths relative to the national average may be due, at least in part, to the lower use of unspecified codes.
Suicide classification ratios
Motor vehicle classification ratios
Discussion
This study provides insight into the most distinctive causes of injury death for each state and the District of Columbia. An important finding from this study is that unintentional firearm deaths were the most distinctive for seven states: Alabama, Arkansas, Kentucky, Louisiana, South Carolina, Tennessee and West Virginia. These states are clustered in Appalachia and the Southeast where owning firearms may be more of a social norm. Furthermore, all these states lack safe storage laws, also referred to as child access prevention laws. Only 18 states have laws that require guns to be stored in a safe manner; laws that require storing a gun locked, unloaded and separate from ammunition have been associated with protective effects against unintentional firearm discharge resulting in a fatality and firearm suicide among youth.10
As these data are aggregated across each state's population, it is unknown which age groups are represented in these unintentional firearm deaths across the study period. However, of the 505 unintentional firearm deaths that occurred nationally in 2013, nearly 25% of victims were aged ≤ 19 years.11 A 2005 study of gun storage practices found that only 0.3% of households with children in Massachusetts had loaded, unlocked firearms in the house, the lowest of any state, whereas the percentage for Alabama was 7%. This is consistent with our findings that unintentional firearm injury deaths were Alabama's most distinctive cause of injury at more than three times the national rate and that Massachusetts had the lowest calculated rate ratio for unintentional firearm injury deaths.10 Restricting access for unauthorised individuals through safe storage of firearms might help to reduce the large disparity of unintentional firearm deaths occurring in these states.
Legal intervention, defined as any injury sustained as a result of an encounter with any law enforcement official, serving in any capacity, whether on or off duty, including injuries to the law enforcement official, suspect and bystander, was the most distinctive injury for five states clustered in the West USA: California, Oregon, Nevada, New Mexico and Utah. However, there are a number of problems with the reporting of ‘legal intervention’ on death certificates and these data may not be indicative of the true level.12 It is likely that legal intervention deaths may occur more frequently across the USA than is shown on death certificates. Deaths involving law enforcement may be coded as firearm deaths instead of legal intervention and this under-reporting may differ by state, though the reasons for these differences are not well understood.12 Efforts are being made to collect better data by both federal agencies and non-profit organisations such as Fatal Encounters which uses crowd-sourced information to keep track of citizens killed by law enforcement,13 which is just one aspect of the legal intervention ICD-10 code. Of the 3112 people killed during interactions with law enforcement between 2010 and 2014 that have been captured by Fatal Encounters, nearly 32% occurred in the five states for which legal intervention was the most distinctive injury death, though these states represent just under 16% of the US population. This suggests that even though there are problems with the classification of legal intervention deaths on death certificates, these five states may still experience legal intervention deaths disproportionately more often than would be expected nationally.
Three states—Montana, South Dakota and Nebraska—had ‘MVC, occupant injured, unintentional’ as their most distinctive injury. Trust for America's Health (TFAH) recently released a report on the top 10 indicators for best injury prevention practices and assessed compliance by state. Four of these indicators—presence of primary seatbelt law, mandatory ignition interlocks for convicted drunk drivers, required booster seats and night-time driving restrictions for teens—were related to motor vehicle safety. While states had an average of two of these indicators, Montana had none and South Dakota and Nebraska have only one each.14
Similarly, natural/environmental, motor vehicle and machinery deaths were often the most distinctive deaths in rural, midwestern and western states. This is probably related to the characteristics of these states such as larger wilderness area, rural areas which require more driving time, and increased occupational injury risks from agricultural machinery.15 Alaska, which had the highest rate ratio of any state, had ‘other transportation, unintentional’ as its most distinctive injury. This category includes fatal injuries involving animal-drawn vehicles, trains and streetcars which, while not very common in Alaska, happen at a much higher rate there than nationally. Although it may not be possible to change these underlying geographical characteristics, the most distinctive injuries in these states could help inform behavioural interventions targeted at those most at risk.
This study has several limitations. First, ICD-10 cause of death codes may be used inconsistently by states, particularly in their use of unspecified injury and unspecified intent codes. Although we conducted analyses to explore the extent of differences in classification, these analyses cannot show for individual cases whether a death was misclassified. Second, while this analysis highlights injuries with a disproportionately high burden in some states, it does not provide any sense of the magnitude of the burden in that state. An injury may have a very high rate ratio, but only a small number of total deaths. A high rate ratio could highlight areas where prevention efforts are relatively lacking, but the magnitude of the burden of injury may be too small to devote resources to that area. Third, for some types of injuries, WISQARS does not differentiate between meaningful subcategories. For example, given the recent attention to prescription drug overdose deaths, it would be useful to distinguish deaths from legal and illegal drugs. However, both these categories fall under the ‘unintentional drug poisoning’ code. Finally, states with fewer than 20 deaths from a cause over the 10-year period were not included because results based on fewer than 20 deaths are considered unstable, but some important information might have been missed through these exclusions. For example, a small number of deaths in a state with a low population could still have a very high rate ratio, which would not be included in the analysis.
This study is the first to our knowledge that applies the ‘most distinctive’ map methodology to injury epidemiology and prevention. Mapping the results allowed us to identify clusters of most distinctive injury deaths. Moreover, this study goes further in examining the reasons for the most distinctive designations than has been done previously. We used data over a 10-year period, which avoided classifying a cause of injury death as most distinctive that could be the result of a 1-year spike rather than a trend. These findings can help policymakers and public health practitioners identify injuries that, while not necessarily the most burdensome, warrant attention as the most distinctive injury death in their states. In states where injuries are distinctive due to differences in policy or culture, the results could also be a useful tool for advocates who could assert, “Not only is this injury a problem, it is a problem that we as a state are distinctively bad at addressing.”
What is already known on this subject
Maps identifying the most distinctive feature of each state are a popular way to convey information and may also have important public health applications.
Previous work identifying the most typical cause of death in each state highlights potential geographical variation.
What this study adds
This study identifies the most distinctive cause of death from injury in each US state using recent data.
This study goes further than previous analyses to explore the relative contributions of differences in geography and the physical environment, differences in policy and culture and differences in measurement, to the geographical variation in states’ most distinctive deaths from injury.
Supplementary materials
Supplementary Data
This web only file has been produced by the BMJ Publishing Group from an electronic file supplied by the author(s) and has not been edited for content.
- Data supplement 1 - Online supplement
- Data supplement 2 - Online supplement
Press release
Files in this Data Supplement:
Footnotes
Acknowledgements SEH was funded in part by the NIOSH Education and Research Center for Occupational Safety and Health at the Johns Hopkins Bloomberg School of Public Health (T42-OH 008428).
Contributors SEH conceived the study; SEH and CKC developed the analysis plan; SEH analysed the data; SEH and CKC carried out the literature review, drafted the manuscript and provided critical revisions to the manuscript.
Funding NIOSH Education and Research Center for Occupational Safety and Health at the Johns Hopkins Bloomberg School of Public Health (T42-OH 008428).
Competing interests None declared.
Provenance and peer review Not commissioned; externally peer reviewed.
Data sharing statement The original data for the study are publicly available. Intermediary datasets are available from the corresponding author upon request.