Article Text

Abstract
Background Hospital discharge data are used for occupational injury surveillance, but observed hospitalisation trends are affected by trends in healthcare practices and workers’ compensation coverage that may increasingly impair ascertainment of minor injuries relative to severe injuries. The objectives of this study were to (1) describe the development of a severe injury definition for surveillance purposes and (2) assess the impact of imposing a severity threshold on estimated occupational and non-occupational injury trends.
Methods Three independent methods were used to estimate injury severity for the severe injury definition. 10 population-based hospital discharge databases were used to estimate trends (1998–2009), including the National Hospital Discharge Survey (NHDS) and State Inpatient Databases (SID) from the Healthcare Cost and Utilization Project (HCUP), Agency for Healthcare Research and Quality. Negative binomial regression was used to model injury trends with and without severity restriction and to test trend divergence by severity.
Results Trend estimates for occupational injuries were biased downwards in the absence of severity restriction, more so than for non-occupational injuries. Imposing a severity threshold resulted in a markedly different historical picture.
Conclusions Severity restriction can be used as an injury surveillance methodology to increase the accuracy of trend estimates, which can then be used by occupational health researchers, practitioners and policy-makers to identify prevention opportunities and to support state and national investments in occupational injury prevention efforts. The newly adopted state-based occupational health indicator, ‘Work-Related Severe Traumatic Injury Hospitalizations’, incorporates a severity threshold that will reduce temporal ascertainment threats to accurate trend estimates.
Statistics from Altmetric.com
Introduction
Accurate occupational injury surveillance is necessary for effective prevention planning and evaluation. Although declining trends in work-related injuries have been reported,1–3 there is evidence of increasing barriers to complete surveillance, including constricting workers’ compensation (WC) coverage, changes in employer reporting requirements, changes in the covered workforce and under-reporting of occupational injuries by workers, employers and healthcare providers.4–7 Together, these issues cast doubt on prevailing trend estimates.
National surveillance of non-fatal occupational injuries is limited and primarily dependent on employer surveys, leaving state surveillance systems to fill the gap.8 The National Institute for Occupational Safety and Health (NIOSH) and Council of State and Territorial Epidemiologists (CSTE) Occupational Health Surveillance Work Group has developed a set of occupational health indicators (OHIs) for state-based surveillance.8 ,9 Proposed OHIs undergo rigorous pilot-testing and approval procedures.9 OHIs are selected for their importance to public health, the potential to inform state-level programme and policy development and availability of state-level data. The OHIs enable comparison of occupational health and risk status across states and over time and assist states in building capacity for occupational health surveillance and prevention efforts.8
OHI #22 ‘Work-Related Severe Traumatic Injury Hospitalizations’ was developed by our team and received final approval from the CSTE Occupational Health Surveillance Subcommittee in December 2014, after pilot-testing by health department or WC agency staff in five states (California, Georgia, Missouri, New York and Washington). Work-related traumatic injury is a leading cause of death and disability for US workers10 and is very costly for workers, employers, WC systems and society as a whole.11 OHI #22 was designed to monitor traumatic injuries and to reduce the inherent heterogeneity in the existing OHI #2 ‘Work-Related Hospitalizations’.
Using a severity threshold to remove temporal ascertainment bias in observed occupational injury hospitalisation trends was a primary motivator behind development of OHI #22. Changes such as tightening inpatient admission criteria, constricting WC coverage, economic and workforce shifts and increasing pressure against reporting work-related injuries may increasingly reduce capture of minor injuries by surveillance systems, more so than severe injuries.4 ,12–16 The National Center for Health Statistics17 and a growing body of research suggest that severity restriction may be an important approach to mitigate the impact of changing healthcare delivery and utilisation patterns on observed injury trends.15 ,16 ,18–21 In a previous study using the National Hospital Discharge Survey (NHDS) and hospital discharge data from four states, we found evidence that observed injury trends were biased downwards in the absence of severity restriction.21 Inadequate severity measurement coupled with increasingly incomplete ascertainment of minor injuries may be contributing to an unwarranted optimism about work-related injury trends.4 ,5 ,19–21
Incorporating a severity threshold into surveillance methodology requires a valid measure of injury severity. One well-validated approach is the Abbreviated Injury Scale (AIS), an anatomically based consensus-driven scoring system that rates injury severity based on threat to life, without consideration of comorbidity or complications.22 AIS has substantial face validity and empirical support as a measure of initial injury severity; in contrast, hospital admission and length of stay can both be related to coexisting conditions, health status, insurance coverage and current standards of care.15 ,17 ,19 ,23 While trauma registries typically contain AIS measures, state hospital discharge databases used for OHIs typically do not.
In order to facilitate implementation by state-based public health and occupational health programmes, a simple and transparent case definition for surveillance of severe injuries was needed. Because of the limitations of existing software programmes that estimate AIS-based injury severity scores directly from International Classification of Diseases, 9th Revision, Clinical Modification (ICD-9-CM) diagnosis codes, our team developed a list of severe traumatic injury ICD-9-CM diagnosis codes, roughly corresponding to injuries with an AIS of 3 or above. This list was validated and included in the guidance for OHI #22.9
The objectives of this study were to (1) describe the development of the severe injury definition used for OHI #22 and (2) assess the impact of imposing a severity threshold on estimated occupational and non-occupational injury trends. Methods used for this study were similar to those described in a previous publication21 with two important updates: (1) the newly developed severe injury definition was used in place of the previous AIS-based severity threshold and (2) the number of included states was expanded from four to nine.
Methods
Development of the severe injury list
Development of the severe injury list presented in table 1 involved estimating AIS for traumatic injury ICD-9-CM codes using three independent methods (two distinct computer programmes and an expert coder), followed by team review. The goal was to identify injuries roughly corresponding to an AIS of 3 or above (AIS ranges from 1 to 6). Such injuries carry a high probability of hospital admission, thus systematic ascertainment bias due to secular trends in hospital admission practices should be minimised for this subset.19
ICD-9-CM codes for severe traumatic injuries
Two software packages estimate AIS-based injury severity scores directly from ICD-9-CM codes: (1) ICDMAP-90 software developed by and available from the Bloomberg School of Public Health24 and (2) Stata's user-written suite of programmes ICD Programs for Injury Categorization (ICDPIC).25 Both have important limitations. ICDMAP-90 has not been updated to the most recent ICD-9-CM and AIS changes and cannot be run on newer computers. ICDPIC is freely available to Stata users; however, the crosswalk does not include the most recent ICD-9-CM codes and is based on an outdated AIS version. Further, AIS and ICD-9-CM were developed for different purposes and there is no single straightforward crosswalk between them. Some ICD-9-CM codes can be mapped to more than one AIS or are too vague to map with confidence to any AIS.
Only traumatic injury codes were included in the candidate list of ICD-9-CM diagnosis codes (800–904.9, 910–929.9, 950–957.9, 959–959.9).26 Burns (940–949.9) were excluded because AIS does not reliably classify burns (ICDPIC does not score burns). As a starting point, we estimated AIS for each diagnosis code using ICDMAP-90 and ICDPIC. Our expert coder (MR) independently assigned AIS based on AIS 2008 (a more recent AIS version than that used by either software package). She initially reviewed all injury diagnosis codes for which ICDMAP-90 and ICDPIC AIS scores differed and all those assigned an AIS of 6. Our team then reviewed the entire list of diagnosis codes, discussed all discrepancies and assigned AIS (where possible) to diagnosis codes not scored by either ICDMAP-90 or ICDPIC (eg, newly developed, rare or combination codes). In general, we used the following rules for these assignments, leaning towards conservative severity assignments: (1) when the ICD-9-CM code mapped to more than one possible AIS, we assigned the lowest AIS and (2) when the ICD-9-CM code included more than one definite injury (ie, combination injuries), we assigned the lowest AIS for the most severe definite injury. Finally, we revised the resulting set of diagnosis codes to improve face validity based on our team's assessment of high probability of hospital admission and to enhance simplicity. We included, for example, all skull fractures and all crush injuries in the final list, even though AIS was estimated as lower than 3 for some individual injuries within those groups.
In a related validation study, we linked Washington State Trauma Registry (WTR) records with WC claims for injuries from 1998 through 2008 (N=208 522) and found that traumatic injuries classified as severe using the severe injury list (table 1) were significantly more likely than those classified as minor/indeterminate to (1) be reported to the WTR, (2) involve an early hospitalisation, (3) result in total permanent disability or death, (4) have more compensated lost work days, (5) have higher total medical costs and (6) have an unresolved claim after long-term follow-up.27 There was substantial injury severity classification agreement between WTR clinical diagnoses and WC billing diagnoses (kappa=0.75), suggesting that diagnostic information contained in billing data is adequate for this purpose.27
Impact of severity restriction on estimated injury trends
Data sources and samples
Inclusion and exclusion criteria are summarised in box 1. Ten population-based data sets were used for this study, including nine state hospital discharge databases and the NHDS. The NHDS is a national probability sample of hospital discharges freely available for public use from the National Center for Health Statistics.28 Hospital discharge data for Arizona, California, Colorado, Florida, Michigan, New Jersey, New York and South Carolina were obtained from the State Inpatient Databases (SID), Healthcare Cost and Utilization Project (HCUP), Agency for Healthcare Research and Quality.29 Hospital discharge data for Washington State were obtained from the Comprehensive Hospital Abstract Reporting System (CHARS).30 These nine states represented diverse geographic areas and different WC systems and satisfied several selection criteria, including the presence of a payer category specific to WC, and having data available for most years from 1998 through 2009. The NHDS and seven states had all years available (1998–2009), California had 2003–2009 and Michigan had 1999–2009.
Summary of inclusion and exclusion criteria
Inclusion criteria
▸ National Hospital Discharge Survey (NHDS) and nine state hospital discharge databases that report workers’ compensation (WC) as a distinct payer category
▸ Hospital discharge during 1998 through 2009
▸ Traumatic injury based on first-listed International Classification of Diseases, 9th Revision, Clinical Modification (ICD-9-CM) code (principal diagnosis)
▸ Ages 16–64 years
Exclusion criteria
▸ Burns (as principal diagnosis)
▸ People residing outside the state in which they were hospitalised
The National Trauma Data Bank's definition was used to identify traumatic injuries.26 Burns were excluded for reasons described earlier. Inclusion was based on the first-listed (principal) diagnosis code, to avoid temporal bias related to the increasing number of available diagnosis fields over time and to avoid inclusion based on superficial/incidental injuries. This aligns with injury surveillance recommendations published by the Safe States Alliance and the Centers for Disease Control and Prevention (CDC).31 ,32 People residing outside the state in which they were hospitalised were excluded to ensure applicability of denominators. The age range was restricted to ages 16 through 64 years, to maximise comparability of the occupational and non-occupational injury groups and to minimise extraneous secular trends related to Medicare coverage. Prior to this restriction, those aged 65 and older comprised under 10% of the occupational injury discharges but roughly half of the non-occupational injury discharges. (Note: OHI #22 does not exclude workers over 65 years old.)
Measures
Work-related injuries were identified as those having WC listed as primary expected payer. CSTE states that ‘designation of WC as primary payer is a good proxy for the work-relatedness of hospitalized injuries.’9 A study based on New Jersey hospital discharge records found that although WC as payer underestimated the number of work-related injuries by about 20%, it was a good to excellent proxy for self-reported work-relatedness (kappa=0.78; sensitivity=83%; specificity=98%).33 In previous work linking WTR records to WC claims, we found that WC as payer was 89% sensitive and 98% specific in identifying injuries resulting in an accepted WC claim.34 Non-WC injuries were identified as those having any primary expected payer other than WC.
The list presented in table 1 was converted into a binary severe injury indicator (1=any listed diagnosis present; 0=otherwise). The minor group contains both minor and moderate injuries, as well as those that could not be accurately classified due to non-specific ICD-9-CM codes.
Data analysis
Occupational injury rates (per 100 000 workers) were based on Bureau of Labor Statistics’ Current Population Survey (CPS) annual employed population denominators, as recommended by CSTE.9 Non-occupational injury rates (per 100 000 residents) were based on US Census Bureau annual resident population denominators. NHDS inflation weights were used to produce nationally representative discharge rates.
Negative binomial regression models that included a continuous variable for discharge year and that adjusted for employed population denominators were used to model injury rates and linear trends, following standard techniques.35 Negative binomial regression was used in preference to Poisson models because the Vuong test often indicated overdispersion.36 Models were run with and without imposing a severity threshold. Temporal trend divergence by severity was tested by including an interaction term that represented the ratio of the trend for severe injuries to that for minor injuries.
Cell size for several age strata did not meet NHDS reliability standards, preventing age adjustment, but differences between crude and age-adjusted rates and trends in the state samples were small and unremarkable, likely due to the age restriction (data not presented).28 Statistical tests were two-tailed, with statistical significance defined as p≤0.05. Analyses were conducted using Stata/MP V.13.1 for Windows (StataCorp LP, College Station, Texas, USA).
Results
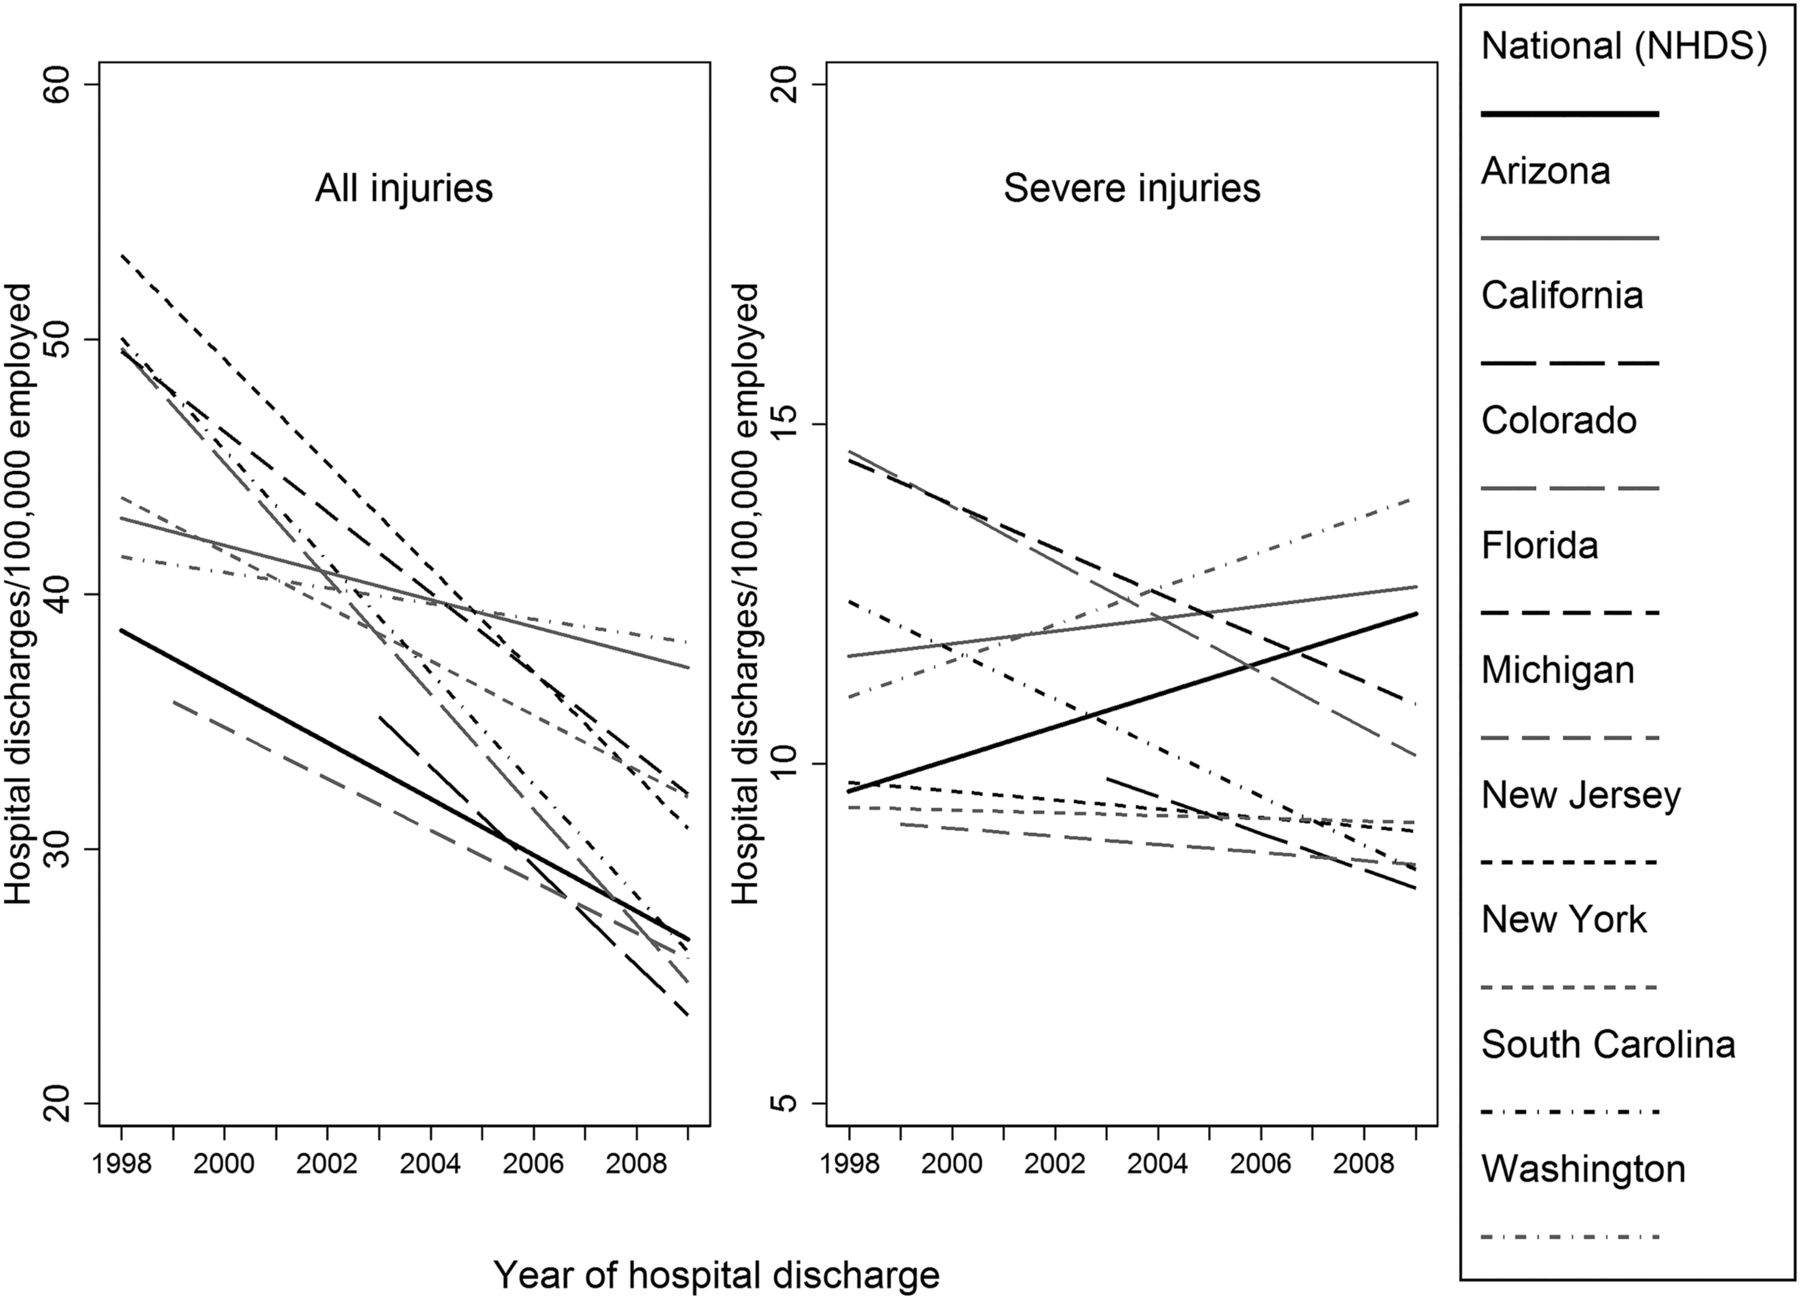
Table 2 presents the results of the trend models for traumatic injury hospitalisations, by severity and payer type. Injury rates and numbers of hospitalised injuries are presented for the year 2009, in order to demonstrate the proportion of all-injury hospitalisations identified as severe, the amount of rate variation across the state and national samples and the proportion of injury hospitalisations covered by WC versus non-WC payers. Trends based on all-injury hospitalisations can be compared with trends based on severe or minor injury hospitalisations, using results from the injury trend columns (the mean annual per cent change). For example, there was an estimated 3.4% mean annual decrease in all WC NHDS injury hospitalisations, while the trend for severe WC NHDS injury hospitalisations was statistically flat. The injury trends for non-WC injury hospitalisations were generally quite different than for WC injury hospitalisations.
Traumatic injury hospitalisation rates and trends, by severity and payer type
As shown in the trend interaction columns, severe NHDS injury hospitalisations trended significantly upwards relative to minor NHDS injury hospitalisations for both WC and non-WC hospitalisations. (This does not imply a significantly increasing annual trend for severe injury hospitalisations, because the trend line for severe injury hospitalisations was compared with the trend line for minor injury hospitalisations rather than to a flat line.) Apart from Arizona, every trend line for severe injury hospitalisations trended significantly upwards relative to the corresponding trend for minor injury hospitalisations; trend interactions for Arizona had the same direction of effect, but the estimates were not statistically significant. The trend ratio point estimates for WC injury hospitalisations always appeared larger than those for non-WC injury hospitalisations. The sole exception was South Carolina, wherein WC and non-WC point estimates were roughly the same.
Figure 1 provides a graphical depiction of national and state-level trends in WC traumatic injury hospitalisations for all WC hospitalisations and for the severe subset. This figure visually summarises the impact of severity restriction on observed trends and illustrates the potential impact of incorporating a severity threshold into surveillance practice.

Impact of including only the severe subset of work-related traumatic injury hospitalisations rather than all-injury hospitalisations when assessing temporal trends in occupational injury rates (10 population-based data sources). NHDS, National Hospital Discharge Survey.
Discussion
We have described the development of the severe injury list used for the CSTE OHI #22 ‘Work-Related Severe Traumatic Injury Hospitalizations,’ and demonstrated that the use of this list as a severity threshold markedly impacts observed injury hospitalisation trends. This study confirms and extends findings from a previous paper that reported similar analyses in fewer states, using an AIS-based threshold rather than this newly developed list.21 Trend estimates were generally biased downwards in the absence of severity restriction, more so for occupational than non-occupational injuries (table 2). Although this study was not designed to identify the precise causes of severity-based trend differentials, our findings are consistent with causes suggested for similar trend differentials in previous studies of traumatic brain injury hospitalisations, which include temporal changes in standards of care resulting in decreasing likelihood of hospital admission for minor injuries as well as a shift from inpatient care to outpatient care (eg, emergency departments, observation units, urgent care facilities).15 ,16 ,18 Our findings are also consistent with the possibility that prevention efforts are successfully reducing minor injuries more so than severe injuries. There may be a contributory survival shift effect (ie, targeted fatality prevention efforts preventing death but not severe injury or severe injury less often proving fatal due to trauma system improvements). These potential collective or alternative mechanisms have been discussed at more length in previous related publications.21 ,37 ,38
Our findings with regard to the differential impact of severity restriction by expected payer are consistent with the hypothesis that there are additional downward pressures affecting ascertainment of occupational injury hospitalisations, on top of the changing utilisation and service delivery patterns that have affected all-injury hospitalisations over time. These additional downward pressures may include constricting WC coverage in the form of more stringent legal causation tests,39 expanded use of pre-existing conditions to deny WC, expanded use of outside medical reviewers or new exclusions of specific categories of workers.40 They may also include changes in the covered workforce, increases in contingent or precarious employment and/or decreasing identification or reporting of minor injuries as being work related.4 ,5 Adaptation to financial pressures by healthcare providers, as well as changes in access to health insurance coverage other than WC, may have an especially important impact on observed occupational injury trends when using WC as a proxy for work-relatedness.12 ,38
Severity restriction may improve occupational injury trend estimates by mitigating any or all of these temporal biases, at least to the extent that each is correlated with increasingly impaired ascertainment of minor injuries relative to severe injuries. Depending on the goals of a particular project, the benefits of severity restriction must be balanced with sample size considerations. For example, the exclusion of minor and moderate injuries may impair the finer-grained stratification (eg, by injury cause or intent) needed to identify prevention opportunities.
Strengths and limitations
Our previously reported findings were confirmed and nationwide generalisability was enhanced by the use of 10 population-based hospital discharge data sets, including a nationally representative hospital survey. The nine included states represent diverse geographic areas, have structurally different WC systems and contain about 38% of the US population according to 2009 Census estimates. Although hospital discharge databases are population based, their use involves the following well-documented limitations, none of which would be expected to bias the findings of this study. Hospital discharge records are only available for non-federal, acute care hospitals. Reliance on WC as payer undercounts work-related injuries.33 ,34 Expected payer may not reflect actual payer. All hospital discharges were counted, including potential readmissions for the same injury.
The severe injury list is transparent, easily modified by the user to suit other purposes and eliminates the need to rely on proprietary software programmes. Our expert coder used AIS 2008, which is more current than the AIS versions used by ICDMAP-90 or ICDPIC.
ICD-9-CM codes are still in use in the USA, where this study was based. Jurisdictions using more recent ICD classification systems will not be able to use the severe injury list in its present form. The severe injury list will need to be revised once ICD-10-CM is implemented. Although beyond the scope of this study, assessment of whether particular burn diagnoses could be added to the severe injury list would be useful.
Conclusions
We conclude that downward trajectories in occupational injury hospitalisation trends have been overstated, in part due to inadequate severity measurement in combination with decreasing capture of less severe occupational injuries. This study demonstrated that imposing a severity threshold can improve the accuracy of trend estimation by reducing temporal biases that differentially affect minor injuries; more accurate estimates can in turn be used by occupational health researchers, practitioners and policy-makers to identify prevention opportunities and to support state and national investments in occupational injury prevention efforts. We have also demonstrated that severe traumatic injuries can be directly identified using a list of ICD-9-CM diagnosis codes, providing a simple and transparent alternative to AIS-based injury severity estimation. The newly adopted state-based OHI, ‘Work-Related Severe Traumatic Injury Hospitalizations’, incorporates a severity threshold that will reduce temporal ascertainment threats to accurate trend estimates. Injury severity measures should be developed for existing and newly designed occupational injury surveillance systems. In addition, inclusion of work-relatedness information in hospital discharge databases would reduce reliance on payer, which is known to undercount work-related injuries.
Severity restriction may improve the accuracy of trend measurement by reducing temporal biases that differentially affect minor injuries.
What is already known on this subject
Work-related traumatic injury is a leading cause of death and disability for US workers.
Changes such as tightening inpatient admission criteria, constricting workers’ compensation coverage, economic and workforce shifts and increasing pressure against reporting work-related injuries may increasingly reduce capture of minor injuries by surveillance systems, more so than severe injuries.
What this study adds
Trend estimates were biased downwards in the absence of a severity threshold, more so for occupational than non-occupational injuries.
Severe traumatic injuries can be directly identified using a list of International Classification of Diseases, 9th Revision, Clinical Modification (ICD-9-CM) diagnosis codes.
Teens video aims to discourage distracted driving
About one third of youth in Alaska report having either texted or emailed while driving. The Alaska Injury Prevention Center responded by encouraging teens to make videos to counter distracted driving. The assumption is that having teens teach other teens is highly effective. As part of the ‘Raise Your Voice’ campaign, one group of students made a film showing how easily teen drivers' attention is diverted. Other films aim to help teenagers realise that they are not invincible behind the wheel. Comment: this is promising and we hope a formal evaluation becomes part of the exercise.
Breathalyser-locked car ignitions effective
A study published in the Am J Public Health reports that the requirement for ‘ignition interlocks’ led to a 15% decline in alcohol-related deaths in the 18 states that required them for anyone convicted of driving when intoxicated (DWI). This success rate is similar to that credited to airbag laws. To start a car equipped with an ignition interlock, you blow into a breathalyser. If the BAC is above a set limit—usually 0.02—the engine will not start. Comment: this study supports MADD's position that this device be required for all DWI offenders.
Birth control pills lessen risk of knee injury in female athletes
A study published in Medicine and Science in Sports and Exercise based on 23 428 female athletes aged 15–19 years who injured their anterior cruciate ligaments (ACLs) found that those who were on birth control pills had less serious injuries and were 22% less likely to need reconstructive surgery. Apparently, the pills act by lowering oestrogen levels. Comment: I was surprised to learn that women athletes are nearly twice as likely than men to injure their ACLs.
Gun science deficient
In 1993, The New England Journal of Medicine published a study, coauthored by Fred Rivara. The main finding was that a gun at home was ‘strongly and independently associated with an increased risk of homicide’. The National Rifle Association argued that the study was intended to mobilise support for gun control. This resulted in a funding amendment prohibiting CDC funds to be used to advocate or promote gun control. The same language was applied to the National Institutes of Health. It has been estimated that as a result CDC funding for firearm research has shrunk by 96%. Comment: the USA has the highest homicide rate in the developed world. Could there be a connection?
Acknowledgments
We wish to thank David K Bonauto, MD, MPH, at the Washington State Department of Labor and Industries, for his suggestions and guidance regarding state-based OHIs.
References
Footnotes
Contributors All authors made substantial contributions to conception, design and data interpretation for this study. JMS, SMB and MR developed the severe injury list. JMS and LB conducted data analyses. JMS and SH-J were responsible for designing statistical approaches. JMS drafted the initial manuscript. All authors were involved in critical revisions and final approval of the manuscript.
Funding National Institute for Occupational Safety and Health (R21OH010307).
Disclaimer The contents of this article are solely the responsibility of the authors and do not necessarily represent the official views of NIOSH.
Competing interests MR receives teaching honoraria from the Association for the Advancement of Automotive Medicine, originators of the AIS.
Provenance and peer review Not commissioned; externally peer reviewed.
Data sharing statement Data used for this study are publicly accessible from the agencies identified in the manuscript, subject to execution of data use agreements.