Article Text

Abstract
Background The Global Burden of Diseases (GBD), Injuries, and Risk Factors study used the disability-adjusted life year (DALY) to quantify the burden of diseases, injuries, and risk factors. This paper provides an overview of injury estimates from the 2013 update of GBD, with detailed information on incidence, mortality, DALYs and rates of change from 1990 to 2013 for 26 causes of injury, globally, by region and by country.
Methods Injury mortality was estimated using the extensive GBD mortality database, corrections for ill-defined cause of death and the cause of death ensemble modelling tool. Morbidity estimation was based on inpatient and outpatient data sets, 26 cause-of-injury and 47 nature-of-injury categories, and seven follow-up studies with patient-reported long-term outcome measures.
Results In 2013, 973 million (uncertainty interval (UI) 942 to 993) people sustained injuries that warranted some type of healthcare and 4.8 million (UI 4.5 to 5.1) people died from injuries. Between 1990 and 2013 the global age-standardised injury DALY rate decreased by 31% (UI 26% to 35%). The rate of decline in DALY rates was significant for 22 cause-of-injury categories, including all the major injuries.
Conclusions Injuries continue to be an important cause of morbidity and mortality in the developed and developing world. The decline in rates for almost all injuries is so prominent that it warrants a general statement that the world is becoming a safer place to live in. However, the patterns vary widely by cause, age, sex, region and time and there are still large improvements that need to be made.
This is an Open Access article distributed in accordance with the Creative Commons Attribution Non Commercial (CC BY-NC 4.0) license, which permits others to distribute, remix, adapt, build upon this work non-commercially, and license their derivative works on different terms, provided the original work is properly cited and the use is non-commercial. See: http://creativecommons.org/licenses/by-nc/4.0/
Statistics from Altmetric.com
Introduction
Since the late 1940s the use of epidemiological analyses to assess the gains of prevention of injury has been advocated, reflecting the changing view of injuries as preventable events.1 These epidemiological analyses entail the use of data to quantify the injury problem and assess causative factors to guide the development of preventive measures and to enable periodic evaluation of the effectiveness of instituted prevention programmes.1 For many decades, injury epidemiologists have largely relied on mortality data.2 However, since the launch of the disability-adjusted life year (DALY) in 1993, the burden of disease concept has become more widely adopted by countries and health development agencies.3 The DALY measures the burden of disease; it aggregates the total health loss at the population level into a single index by summarising premature mortality in years of life lost (YLLs), and non-fatal health outcomes in years lived with disability (YLDs).4 Thus, the DALY provides a more comprehensive measure of the relative magnitude of different health problems for health planning purposes.5 ,6 This information serves as a crucial input to facilitate policy decision-making on prevention and control through allowing comparisons of the health impact of different diseases and injuries and related risk factors over time and between countries.
In the first Global Burden of Disease and Injury (GBD) study, commissioned by the World Bank in the early 1990s, the DALY was used to describe the burden of disease of 98 diseases, 9 injuries and 10 health risk factors for eight world regions.7 This study, and subsequent updates by WHO, showed that injury was a substantial cause of morbidity and mortality in the developed and developing world.7–10 A new GBD study, the GBD 2010, commenced in 2007. This study used enhanced methodology and interactive visualisation tools to provide regional and global estimates for 263 diseases, 28 causes of injury, 67 risk factors, 20 age groups, both sexes and 187 countries in 21 world regions from 1990 to 2010.11 Apart from the expansion of cause list, risk factor list and regional detail, a notable methodological change was the change from incidence-based to prevalence-based YLDs.12 The key results of the GBD 2010 study were published in 2012, including injury results.11–14 However, a detailed description of the GBD injury methods and results has not yet been published. To provide policy-makers, researchers and other decision-makers with the most current estimates of population health, the GBD estimates are being updated annually starting with the year 2013 (GBD 2013). At every update the whole time series from 1990 onwards is estimated again in order to maintain internal consistency and comparability after the addition of new data and revision of some parts of the methods.
The aim of this study is to provide an overview of the methods, and results of injury mortality, incidence and DALYs from the GBD 2013 study, with detailed information on the range of causes of injuries globally and by country including trends in their occurrence.
Methods
Disability-adjusted life years
The DALY is calculated by adding YLLs and YLDs. YLLs are calculated by multiplying deaths by the remaining life expectancy at the age of death from a standard life table chosen as the norm for estimating premature mortality in GBD. YLDs are calculated by multiplying the number of prevalent cases with a certain health outcome by the disability weight assigned to this health outcome. A disability weight reflects the magnitude of the health loss associated with an outcome and it has a value that is anchored between 0, equivalent to full health, and 1, equivalent to death.
GBD injury codes and categories
The International Classification of Diseases (ICD) was used to classify injuries because it is the standard diagnostic tool for epidemiology. In the GBD study injury incidence and death are defined as in ICD-9 codes E000-E999 and ICD-10 chapters V to Y. Chapters S and T in ICD-10 and codes 800–999 in ICD-9 are used for estimation of injury morbidity. There is one exception: deaths and cases of alcohol poisoning and drug overdoses are classified under drug and alcohol use disorders.
For GBD 2013, injury was categorised into 26 mutually exclusive and collectively exhaustive external cause-of-injury categories. For our morbidity analysis, each cause-of-injury category was further divided among 47 mutually exclusive nature-of-injury categories (see online supplementary annex tables 1.1 and 1.2). Some injuries are trivial and unlikely to account for an important number of DALYs (eg, small bruises, scratches); these injuries were excluded from this study by restricting our morbidity analysis to cases warranting some form of healthcare in a system with full access to healthcare. We have included cases with injuries that did not receive care in areas with restricted access to healthcare, but that would have warranted some type of healthcare in a system with full access to healthcare.
Mortality
Online supplementary annex table 2.1 summarises the number of site-years of death from vital registration, verbal autopsy, mortality surveillance, censuses, surveys, hospitals, police records and mortuaries by the 21 GBD world regions. A site-year is defined as a country, state or other subnational geographical unit contributing cause of deaths data in a given year. The overall approach to estimate causes of death has been described elsewhere.13 ,15 Briefly, the first step is the mapping of all data sources into the GBD cause list of diseases and injuries. Second, adjustments are made for ill-defined cause of death or garbage codes. Third, ensemble models with varying choice of covariates and mathematical models are run using the GBD cause of death ensemble modelling (CODEm) software to derive estimates by age, sex, country, year and cause. Police and crime reports are data sources uniquely used for the estimation of deaths from road injury, self-harm and interpersonal violence. The police data were collected from published studies, national agencies and institutional surveys such as the United Nations Crime Trends Survey and the WHO Global Status Report on Road Safety Survey. For countries with vital registration data we did not use police records, except if the recorded number of road injury and interpersonal violence deaths from police records exceeds that in the vital registration.
In countries for which we did not have vital registration data hospital and burial/mortuary data were used to assess patterns and proportions of deaths from each injury cause of death by year, age, sex and country (ie, cause fractions). In these cases, the proportion of injury deaths due to specific causes were transformed into proportions of all causes by multiplying by the proportions of all deaths due to injuries estimated in CODEm.
Online supplementary annex section 3 describes the preparation of cause of death data, the redistribution of garbage codes, the modelling process and covariates, and the separate analyses of mortality from armed conflicts and natural disasters in more detail.
Years of life lost
We calculated YLLs by multiplying deaths by the residual expected individual life span at the age of death as derived from the GBD 2013 standard model life table.13
Morbidity
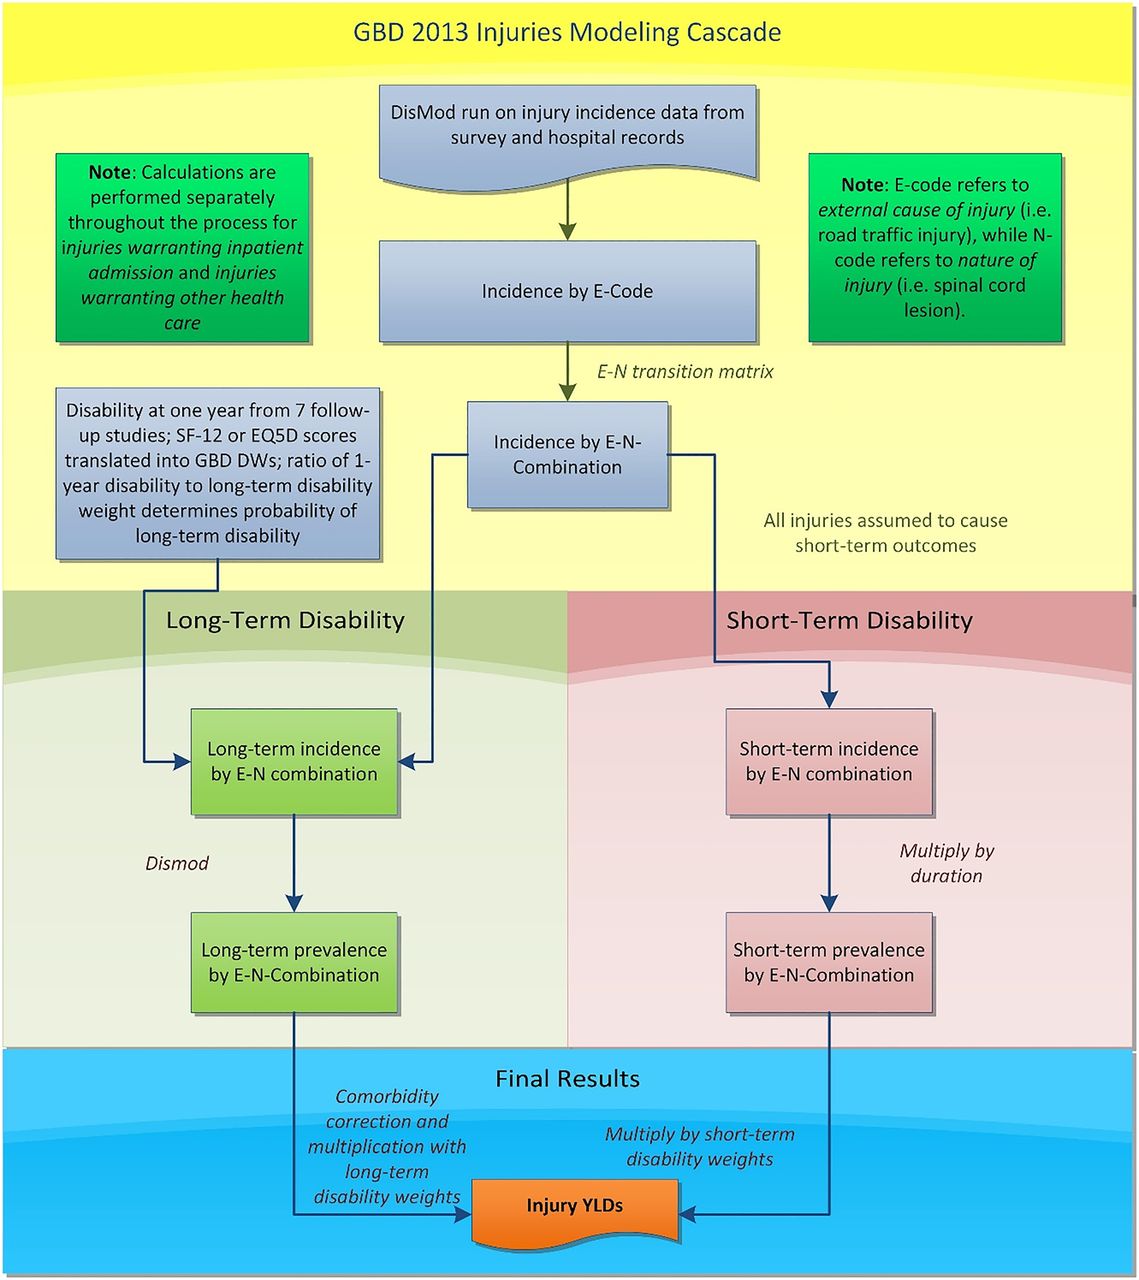
Estimating the non-fatal health consequences of injuries is complex as it needs to take into account short-term and long-term disability for a large range of nature-of-injury categories that can arise from each cause of injury. Figure 1 shows the flow diagram of this process. Our strategy was to first apply DisMod-MR 2.0 (a descriptive epidemiological meta-regression tool that uses an integrative systems modelling approach to produce simultaneous estimates of incidence, prevalence, remission and mortality) to injury incidence data from emergency department (ED) and hospital records and survey data to produce cause-of-injury incidence by country, year, age and sex. We estimated incidence of injury warranting inpatient admission (‘inpatient care’) and incidence of injury warranting other types of care (‘outpatient care’) for all cause-of-injury categories.16 Injuries warranting inpatient care refer to injury cases of sufficient severity to require inpatient care if there are no restrictions in access to healthcare. Outpatient care refers to injury cases of sufficient severity to require healthcare attention but not hospitalisation. This category includes ED visits. Second, we imposed a hierarchy to select the nature-of-injury category that leads to the largest burden when an individual experiences multiple injuries. Third, using hospital and ED data we created two different matrices to estimate the proportions of incident cases in each of the 26 cause-of-injury categories that resulted in each of 47 nature-of-injury categories. One cause-nature-of-injury matrix was for inpatient injuries, the other for outpatient injuries. Applying these matrices to our cause-of-injury incidence from step 1, we produced incidence of inpatient and outpatient injuries by cause and nature of injury. Fourth, we estimated short-term disability by nature-of-injury category for all incident cases of inpatient and outpatient injuries. We estimated the average duration for each nature of injury category and derived short-term prevalence by multiplication of incidence and duration. Fifth, we estimated the proportion of cases that result in permanent disability for each nature-of-injury category. We then applied DisMod-MR 2.0 to estimate the long-term prevalence for each combination of cause-of-injury and nature-of-injury from incidence and the long-term mortality risk in cases with long-term disability. After correction for comorbidity with other non-fatal diseases, YLDs were calculated as prevalence times a disability weight.

Flowchart of Global Burden of Disease Injury years lived with disability (YLD) estimation.
Online supplementary annex section 4 describes the data sources and our strategy to assess the non-fatal burden of disease in more detail.
Uncertainty
Burden of disease estimates have varying degrees of uncertainty arising from input data, the data adjustments and the statistical models. We have propagated uncertainty from all these sources using standard GBD methods of repeating all calculations 1000 times, each time drawing from distributions rather than point estimates for all the relevant parameters in our models.12 For the injury mortality estimates the estimation of model uncertainty is inherent to the ensemble modelling method.13
All rates of deaths and DALYs we present are age-standardised using the revised GBD 2013 standard population.15
Results
Incidence, mortality and burden of disease of injuries in 2013
In 2013, we estimated that 973 million (uncertainty interval (UI) 942 to 993) people sustained injuries that warranted some type of healthcare and 4.8 million (UI 4.5 to 5.1) people died from injuries. Major causes of injury death were road injury (29.1%), self-harm (17.6%), falls (11.6%) and interpersonal violence (8.5%). Of the people who sustained injuries that warranted some type of healthcare, 5.8% (56.2 million; UI 55.6 to 57.3) warranted inpatient care, of whom 38.5% (21.7 million; UI 21.3 to 22.0) sustained fractures (see online supplementary annex table 5.1). Of the patients who warranted outpatient care 75.2% sustained minor injuries (689 million; UI 672.0 to 712.8).
Table 1 shows the global incidence and deaths by cause of injury.
Global incidence and deaths by cause of injury with 95% UI, 2013
Injuries accounted for 10.1% (UI 9.5 to 10.8) of the global burden of disease in 2013. YLLs were responsible for 85.2% (UI 81.2 to 88.7) of injury DALYs. The proportion of DALYs due to disability (YLD) is much higher for collective violence (69.1%; UI 54.3 to 81.8), falls (46.4%; UI 38.3 to 54.1) and forces of nature (43.0%; UI 26.0 to 56.7). The main contributors to injury DALYs are road injuries (29.3%; UI 26.4 to 32.2), self-harm (14.0%; UI 11.8 to 16.2), falls (12.0%; UI 9.8 to 14.1), drowning (8.7%; UI 6.3 to 11.2) and interpersonal violence (8.4%; UI 6.5 to 10.4).
Table 2 shows the global YLLs, YLDs and DALYs by cause of injury.
Global YLLs, YLDs and DALYs, 2013 and per cent change in DALYs 1990–2013 with 95% UI, by cause of injury
Table 3 shows the global age-standardised YLL, YLD and DALY rates by cause of injury. DALY rate refers to the number of DALYs per 100 000 population.
Global age-standardised YLL, YLD and DALY rates per 100 000 population in 2013 and per cent change DALY rate 1990–2013 with 95% UI, by cause of injury
The contribution of cause-of-injury category DALY rates to the total injury DALY rates differ by year, age category, sex and region. Figures 2⇓⇓–5 show the DALY rates by cause-of-injury, for men and women, and by GBD world regions in 2013 separately for age categories 0–14 years, 15–49 years, 50–79 years and 80+ years, respectively. In all regions injury rates are much higher in men than in women with the exception of the 80 years and older age group where the sex differential largely disappears. In boys under the age of 15 years, DALY rates per 100 000 vary from a low of 468.4 (UI 427.7 to 509.7) in western Europe to a high of 6471.4 (UI 4197.1 to 8680.9) in central sub-Saharan Africa. In girls under the age of 15 years DALY rates vary from a low of 307.4 (UI 277.9 to 336.8) in western Europe to a high of 4788.1 (UI 3260.4 to 6354.7) in central sub-Saharan Africa. Road injuries are an important driver of DALY injury rates in children across the globe but with a large variation in the rates. The DALY rate for road injuries is 9.7 times higher in boys and 9.1 times higher in girls in central sub-Saharan Africa compared with high-income Asia Pacific. Drowning shows large variations with highest rates in sub-Saharan African and Asian regions. Even in children, the high rates of homicide in Latin America and, particularly, in tropical and central Latin America stand out.

Disability-adjusted life year (DALY) rates by cause of injury, sex and region, ages 0–14 years. For the purposes of these plots, all non-road unintentional injuries have been collapsed to “All Other Unintent” (other transport injury, animal contact categories, foreign body categories, and adverse effects of medical treatment).

Disability-adjusted life year (DALY) rates by cause of injury, sex and region, ages 15–49 years of injury, sex and region.

Disability-adjusted life year (DALY) rates by cause of injury, sex and region, ages 50–79 years of injury, sex and region.

Disability-adjusted life year (DALY) rates by cause of injury, sex and region, ages 80 years and above of injury, sex and region.
In younger adults aged 15 years to 49 years, DALY rates in men vary from a low of 2651 per 100 000 population (UI 2427 to 2904) in western Europe to a high of 10 780 (UI 10 157 to 11 390) in eastern Europe. In women, rates range from a low of 798 (UI 712 to 907) in Australasia to a high of 3268 (UI 2608 to 3985) in South Asia. This is the peak age category for road injuries in all regions but with an eightfold difference in rates between high-income Asia Pacific and western sub-Saharan Africa. Rates in high-income North America are around 70% higher than in western Europe, Australasia and high-income Asia Pacific with generally higher rates for most injuries, but particularly so for interpersonal violence. High rates in Latin America and sub-Saharan Africa are driven by road injuries and interpersonal violence. Eastern Europe and Central Asia have particularly high rates of drowning and self-harm (figure 3). The high rate of fire injuries in South Asian women stands out.
Patterns of injury DALY rates in the age group 50–79 years follow similar patterns as those in the younger adult age group but the differences between regions and between men and women are less pronounced: DALY rates in high income regions are higher and those in other regions are lower. The lowest DALY rates per 100 000 for men (2873; UI 2668 to 3070) and women (1574.2; UI 1429 to 1720) are seen in Australasia while South Asia has the highest rates in men (7525; UI 6880 to 8172) and in women (4798; UI 4421 to 5173). Falls become a more prominent cause of DALYs in this age group and self-harm becomes a greater cause than violence in most regions. Fire injuries and drowning are sizeable causes in sub-Saharan Africa, eastern Europe and South Asia.
Falls are the dominant cause of injury DALY rates in the elderly. An ageing cohort of people with long-term disabilities from past wars and disasters is quite prominent in Andean Latin America, South-East Asia, North Africa and the Middle East and sub-Saharan African regions. At older ages the share of road injuries in pedestrians increases.
With regards to YLDs, the disability component of the DALY, in 2013, nature-of-injury categories fracture of patella, tibia, fibula or ankle (26.6%; UI 26.0 to 27.1) and multiple significant injuries (11.1%; UI 10.8 to 11.4) contributed most to the global YLDs of injuries. The relative contribution of nature-of-injury YLDs to cause-of-injury YLDs differs for each cause of injury. For some cause-of-injury categories one or two nature-of-injury categories are responsible for the majority of YLDs (eg, fire, heat and hot substances, and burns), whereas for others a variety of nature-of-injury categories contribute to the cause-of-injury categories. The distribution of nature-of-injury YLDs by cause-of-injury category also differs by sex, age category, injuries warranting inpatient versus outpatient care and high/low income countries.
Changes between 1990 and 2013—all injury
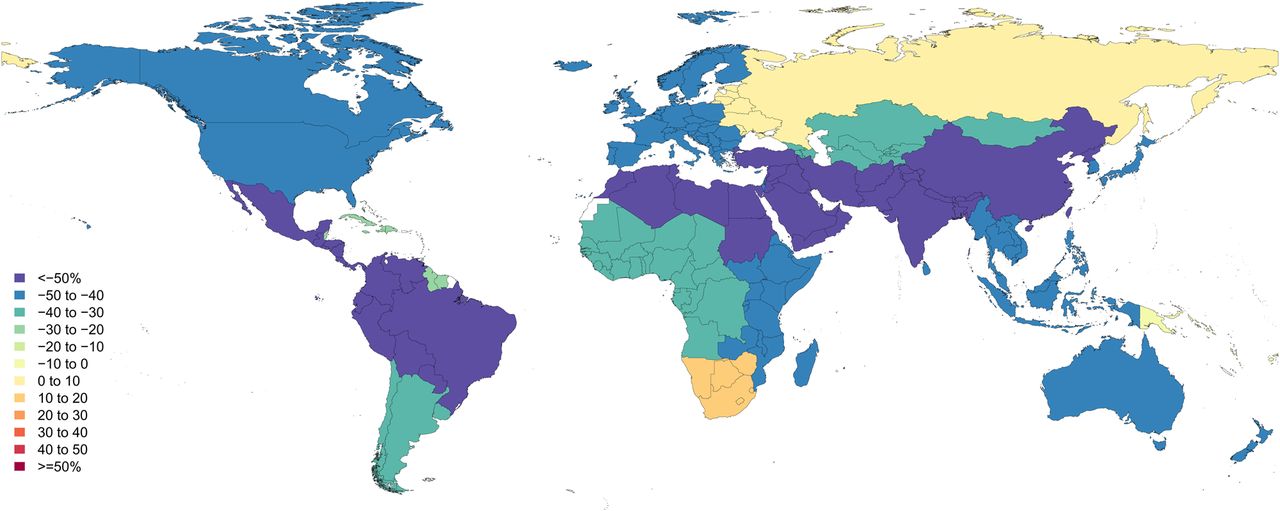
Between 1990 and 2013 injury DALY rates have declined by 30.9%, an annualised rate of decline of 1.6% (table 3). For communicable, maternal, neonatal and nutritional disorders and non-communicable disease DALY rates declined by 42.2% (UI −45.0 to −40) and 14.5% (UI −17.3 and −11.6), respectively. Rates of change for injury DALY rates vary widely across regions ranging from a decrease of 54.8% (UI −64.2 to −44.1) in Andean Latin America to an increase of 6.4% in Oceania (UI −24.1 to 48.3) (figure 6). All but four regions showed a significant decline with Oceania, and West, central and southern sub-Saharan Africa the exceptions. Among high-income regions, western Europe and Australasia showed the largest declines. East Asia, North Africa and the Middle East, Central Europe and Southeast Asia ranked second to fifth in terms of largest decrease in injury DALY rates.

Percent change in age-standardised all-injury disability-adjusted life year (DALY) rates 1990–2013.
Table 4 shows the per cent change in incidence, YLL and YLD rates by cause of injury. The patterns of change in injury DALY rates were similar between men and women. Over the period 1990–2013 the rate of YLDs from injuries decreased by −37.0% (UI −30.0 to −45.4) while YLLs due to injuries decreased only by −29.6% (UI −24.1 to −33.6). The rate of incidence of all injuries declined at a slower pace of −19.5% (UI −14.7 to −23.9) over the same period.
Percent change in incidence, YLL and YLD rates by cause of injury with 95% UI, 1990–2013
The change in incidence rates for all causes of injury has been smaller than the change in YLD or YLL rates. For transport injuries and intentional injuries the change in YLD rates has been greater than the change in YLL rates but the opposite is the case for unintentional non-transport injuries.
Changes between 1990 and 2013 in DALY rates for unintentional injuries
The decline in injury DALY rates was significant for all unintentional injuries, with the exception of the smaller categories of unintentional suffocation, adverse effects of medical treatment, non-venomous animal contact and foreign body in other body part.
Road injury
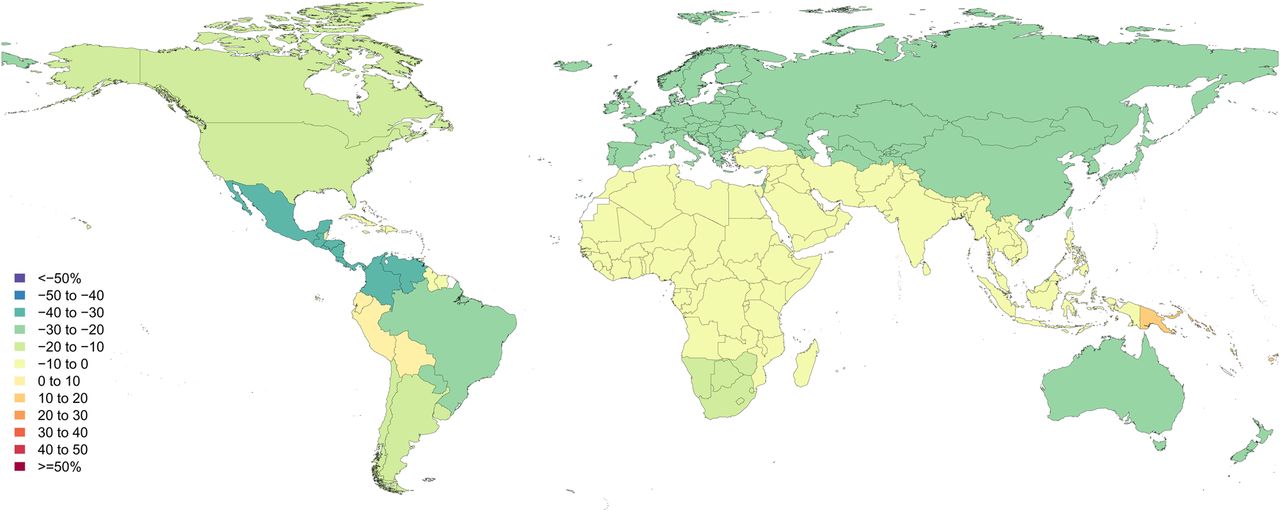
Figure 7 shows the per cent change in road injury DALY rates. Over the period 1990 to 2013 global road injury DALY rates decreased by 15.7% (UI −23.2 to −10.4). Decreases were mainly apparent in high-income Asia Pacific (−66.9%; UI −69.8 to −63.9), followed by western Europe (−61.1%; UI −63.1 to −58.9), Australasia (−57.0%; UI −60.1 to −53.8) central Europe (−50.6%; UI −55.8 to −47.1) and eastern Europe (−38.3%, UI −42.9 to 33.5).

Percent change in age-standardised road injury disability-adjusted life year (DALY) rates 1990–2013.
The decline in rates in Oceania (−16.9%; UI −41.4 to 22.1), East Asia (−14.1%; UI −33.9 to 2.7) and central sub-Saharan Africa (−9.9%; UI −22.5 to 5.5) were not significant. Rates increased in South Asia (6.5%; UI −11.2 to 26.1) and West (13.1%; UI −0.5 to 28.6) and South sub-Saharan Africa (35.2%; UI −14.1 to 60.6) but not significantly. Four-wheeled motor vehicle injuries significantly increased in South Asia (21.7%; UI 1.8 to 44.6) and sub-Saharan Africa (19.8%; UI 6.6 to 35.0).
Falls, drowning, fire and poisoning
Over the period 1990 to 2013 the burden of disease due to falls decreased −20.8% (UI −32.6 to −13.5). The decrease was significant in 13 out of 21 GBD world regions. The change in DALY rates due to falls in the other eight regions was not significant (figure 8).

Percent change in age-standardised falls disability-adjusted life year (DALY) rates 1990–2013.
Drowning showed a pronounced decline globally by −52.2% (UI −59.1 to −12.1). The greatest declines in drowning DALY rates occurred in East Asia (−71.0%; UI −75.2 to −29.4) and southern sub-Saharan Africa (−62.3%; UI −73.2 to −26.4). Oceania was the only region recording an increase in drowning DALY rate, a non-significant change with large uncertainty (14.9%; UI −38.6 to 72.7). The global decline in DALY rates of drowning was apparent in all age categories, but largest for age category 1–4 years (by 64.4%).
Other unintentional causes of injury that showed marked decreases in DALY rates were fire, heat and hot substances (−46.8%; UI −54.9 to −33.2) and poisoning (−43.8%; UI −64.7 to −35.3). Poisonings and fire, heat and hot substances showed a decrease in burden of injury for most regions, with a few exceptions. South Asia is the only region which did not see a decline in poisoning DALY rates (−0.7%; −50.3 to −33.1). DALY rates from fire injuries declined significantly in 16 out 21 world regions, with central and southern sub-Saharan Africa, Oceania, eastern Europe and the Caribbean as the exceptions (figures 9 and 10).
Percent change in age-standardised fire injury disability-adjusted life year (DALY) rates 1990–2013.

Percent change in age-standardised poisoning injury disability-adjusted life year (DALY) rates 1990–2013.
Changes between 1990 and 2013 in DALY rates for intentional injuries
The decline in DALY rates for interpersonal violence was −19.1% (UI −24.2% to −11.5%), with significant decreases in 11 of 21 world regions with non-significant changes in the other regions. However, the increase by around 50% in the rates of interpersonal violence DALYs in South sub-Saharan Africa and Oceania are reason for concern even though the large UI crosses zero (figure 11).

Percent change in age-standardised interpersonal violence disability-adjusted life year (DALY) rates 1990–2013.
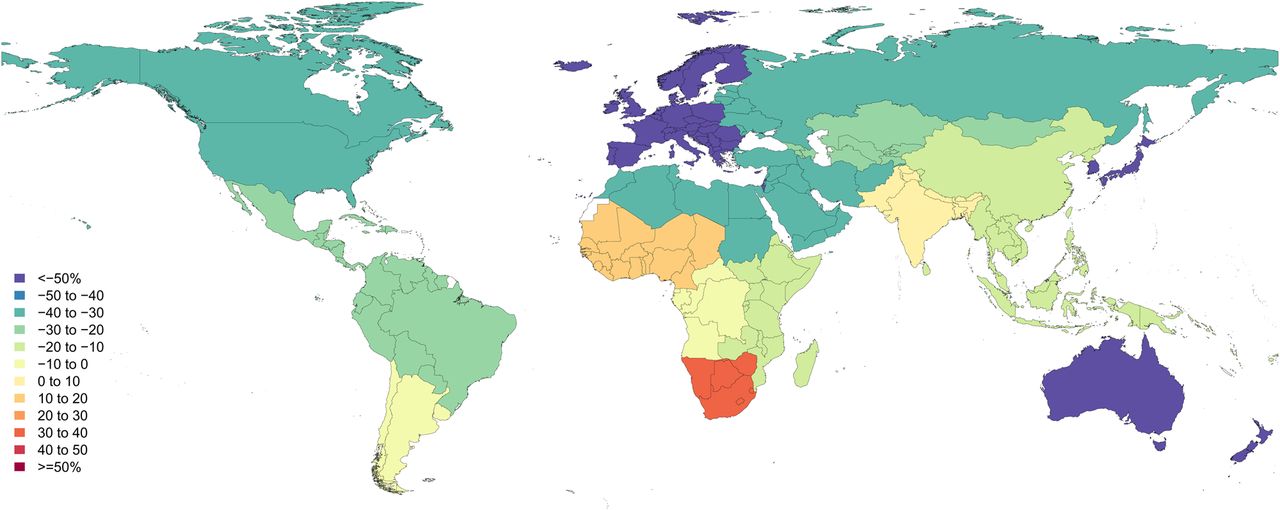
The per cent change of self-harm was −24.3% (UI −32.7 to −14.5). The largest decline occurred in East Asia (−68.3%; UI −73.0 to −46.8), while rates in South-East Asia, the Caribbean, western Europe, and tropical and southern Latin America dropped by about a third. At the other end of the spectrum rates increased by more than a quarter in South Asia, high-income Asia Pacific, North Africa and the Middle East, and southern sub-Saharan Africa (figure 12).

Percent change in age-standardised self-harm disability-adjusted life year (DALY) rates 1990–2013.
Collective violence and forces of nature
Due to the sporadic nature of war and forces of nature, a rate of change between 1990 and 2013 is a less meaningful statistic. What is of interest is that we estimate a long tail of disability arising from such events for many decades to come. Past disaster and war experience at a large scale in countries like Lebanon, Peru, Cambodia, Vietnam and Rwanda continues for decades in a slowly aging cohort of people with long-term disability, for example, from amputations and poorly healed other injuries.
Online supplementary figures 6.1 to 6.11 in the annex show maps of change in injury DALY rates by sex for selected cause-of-injury categories.
Discussion
GBD 2013 provides a systematic quantification of mortality, incidence and disability over the time period 1990 to 2013, allowing analyses of time trends and comparison between regions. Since 1990 age-standardised rates of DALYs due to injuries have significantly decreased in all major injury categories. The slower decline in incidence rates compared with YLL and YLD rates, GBD's measures of premature mortality and disability, suggests that the observed changes are driven by multiple mechanisms. Reduction in incidence would be the effect of measures preventing the occurrence of injuries (eg, road safety measures, gun control or safer tools). The greater declines in YLL and YLD rates could be brought about by injury prevention measures reducing the severity of the injury sustained (eg, seat belts and helmets) or by improved access to better quality care after an injury (eg, trauma systems).
Road injury
Globally, the burden of disease due to road injury has decreased significantly since 1990, but this decrease is largely in high-income regions, with the reverse trend occurring in low-income and middle-income countries. Other studies have argued that this is because growth in motorisation and traffic density is outpacing infrastructural development and levels of law enforcement,17–20 and that this is particularly the case for major fast-growing economies such as Brazil, Russia, India, China and South Africa; countries that have experienced rapid economic development that led to changes in lifestyle and environment and subsequently impacted health and mortality.21–23 Our study shows that these countries have relatively high road injury mortality and DALY rates, but that DALY rates have significantly decreased in Brazil and Russia over the period 1990–2013 while rates for South Africa, India and China showed insignificant changes. Low-income and middle-income regions that had lesser declines or an increase in traffic injury DALY rates often do not have comprehensive urban speed limit laws, seat belt laws, motorcycle helmet and/or drink-drive laws, or poor enforcement if the laws exist.17 ,24 These laws have shown to substantially reduce road injury mortality, underlining the importance of implementing these strategies to reduce road traffic injury.25
Intentional injury
Our findings on interpersonal violence tally with findings from the United Nations Office on Drugs and Crime (UNODC) Homicide Statistics and WHO which show that the overall trend in the global homicide rate is decreasing, but that regional trends are diverse:26 ,27 in Asia and Europe overall homicide rates are decreasing but other regions have continuing high levels of homicide.26 ,28 UNODC and WHO report that this is particularly the case for the Americas and in Eastern and Southern Africa, where homicide levels have remained high, and in some countries levels increased.29–33 These reported homicide trends correspond to the continuing high levels of DALY rates from interpersonal violence in parts of Latin America and sub-Saharan Africa. Important to note is that regional interpersonal violence death and burden of disease rates may disguise large variations in trends between countries and within countries.26 Others have observed a decline in violence over much longer periods in history contrary to popular discourse on the rising threat of violence partly attributed to media exposure of prominent events of violence.34 ,35
Self-harm is the second leading cause of death from injury and it is a main contributor to injury DALYs. Over the period 1950–1995 the global self-harm death rates were reported by WHO to have increased, although the authors noted that the figures should be interpreted with caution because the 1950 estimates were based on data from 11 countries.36 ,37 More recently, studies found evidence that there was an upturn in suicide rates during the financial crisis of 2007/2008 set against this overall decline.38 ,39 We found a significant decrease of the self-harm rates between 1990 and 2013 in all European and American regions (except central Latin America) but do not see a change in this decline coinciding with the recent economic downturn. More than half of all self-harm DALYs occur in East and South Asia. The trends in these regions are in opposite directions, decreasing significantly and by a great margin in East Asia but rising, though not significantly, in South Asia between 1990 and 2013. The decline in East Asia was greater in women than in men while in South Asia self-harm increased more rapidly in men than in women. Previous studies have reported similar trends in the most populated countries in these regions, India and China.40 ,41 Over the past two decades China and India have experienced rapid economic growth and urbanisation, and therefore the opposing trends would need to be explained by other factors, such as the distribution of increasing wealth, cultural shifts, ease of access to mental health treatment, ease of access to the main means for self-harm, and other factors. Furthermore, India, in contrast to China, is just at the start of industrialisation and urbanisation.
For reasons related to social and religious attitudes, self-harm may be under-reported or misclassified.36 In the GBD 2013 several steps have been taken to enhance data quality of morbidity and mortality data and adjust for misclassification. Nonetheless, the burden of disease of self-harm may still be under-reported and captured as unintentional injuries.
Collective violence and legal intervention
Globally, battle deaths have declined since 1945 and the number of interstate conflicts has decreased since 1990 while the peak of interstate conflicts with more than 1000 battle deaths per year was in the 1970s with a rapid decline thereafter.34 ,42 ,43 However, the Human Security Report showed that in Africa conflicts and battle deaths have become more numerous in recent years and often are high-intensity conflicts, causing more than 10 000 battle deaths a year.43 This increase also resulted in an increase in battle deaths in certain African countries. GBD 2013 shows that deaths due to collective violence and legal intervention continued to decline over the 1990–2013 period.15 These findings correspond to the GBD 2013 changes in burden of disease rates due to collective violence. Deaths do not represent the total impact of injuries and this is particularly relevant to collective violence as two-thirds of DALYs are from long-term disability of past wars, the long tail of long-lasting disabilities such as amputations. The decline in disability (YLDs) from collective violence has kept pace with the decline in mortality (YLLs).
Data limitations
Coverage of vital registration is low or absent in large parts of the world and there are issues of incompleteness and differences in death certification systems, definitions of variables and methods of data collection.44–47 For these regions, it was necessary to predict estimates using models, relying on covariates and verbal autopsy.12 ,13 We added police and mortuary data for road injuries, self-harm, and interpersonal violence to help predict level and age patterns in countries with sparse or absent cause of death data even though we know from countries with near-complete vital registration data that police records tend to underestimate the true level of deaths. GBD uses the largest collection of data on causes of death in the world, allowing us to use statistical models that can borrow strength over time and geography. Although this ensures an estimate for all causes and all countries, estimates for populations and time periods with sparse or absent data are inherently less precise. While we attempt to capture all sources of uncertainty from sampling error, non-sampling error and model specifications in the 95% UIs, we cannot guarantee that we have captured all uncertainty.48 ,49
The lack of nationally representative mortality data in many low-income and middle-income countries emphasises the need for investment in vital registration and standardised cause of death certification. These data are essential to identify and monitor the effectiveness of injury intervention strategies.
For many countries hospital data collection systems with national coverage exist but, due to country-specific privacy regulations, the data are not made available or made available in summary tabulations only. The latter is problematic for injuries as our analyses make a strict distinction between cause and nature of injury and therefore requires dual coding of injuries. Many countries unfortunately record injury hospital admissions or ED encounters as a haphazard mix of cause and nature-of-injury codes. Rather than discarding these data sets we set a low bar for inclusion if at least 45% of cases had a cause-of-injury code. Although these data inform our estimates of cause patterns that are scaled up to the total ‘all injury’ incidence, we cannot be sure that the patterns in these small sample sizes are representative of those at the country level. A clear recommendation to custodians of hospital data collection systems is to ensure that all cases of injuries are dual coded.
Data protection regulations and legislation are becoming more important, and because of that there may be more countries for which hospital data or other data sources are not made available. However, it should be noted that for GBD de-identified data are sufficient.
Besides hospital data collection systems hospital-based trauma registries have become well established in high-income countries and are emerging in some low-income and middle-income countries. WHO has created standardised data sets to be used across settings to ensure best practice principles and consistent data collection.50 Application of these guidelines in hospital-based trauma registries and the development of an international trauma databank would make it possible to track burden of disease as well as measure effectiveness of interventions, conduct intervention trials across settings, and support innovation in prevention and treatment of injury.51 ,52
For forces of nature and collective violence we retrieved data from vital registrations as well as data sets that were set up particularly for the collection of data from armed conflicts and/or disaster.53 ,54 Problematic, however, is that war and disaster and their after-effects may severely disrupt the infrastructure of vital and health registration systems, complicating collection of data on morbidity and mortality.55 Postdisaster and war surveys have been carried out to assess related mortality and injury, yet recall bias related to acute postdisaster experiences and postdisaster or postwar migration may hamper the data collection and interpretation of these studies.
Significant methodological differences between GBD 2010 and GBD 2013
To estimate the burden of injury we used a methodology similar to GBD 2010 but with several significant changes, including changes with respect to the injury classification. First, the list of external cause of injury was disaggregated from 15 to 26 categories and the list of nature of injury was expanded from 23 to 47 categories. Second, we incorporated additional inpatient and outpatient data sets from a variety of countries and new follow-up studies with patient-reported outcome measures from the Netherlands and China and recent years of Medical Expenditure Panel Survey (MEPS). Third, patient-reported outcome measurement data were used to develop a hierarchy to select the most severe injury category for patients with multiple natures of injury. Fourth, we allowed for differing durations of short-term outcomes and probabilities of long-term disability depending on whether an injury was treated or not. Fifth, we report outcomes by cause-of-injury category and nature-of-injury category, whereas previously outcomes were reported by cause of injury only.
Methodological limitations
Nature-of-injury severity hierarchy
To assess issues of correlation between severe natures-of-injury categories and particular mild nature-of-injury categories, we developed a nature-of-injuries severity hierarchy. This hierarchy was used to establish a one-to-one relationship between cause-of-injury category and nature-of-injury category in an individual. This means that in a person with multiple injuries we selected the nature-of-injury category that was likely to be responsible for the largest burden based on a regression analysis of seven follow-up studies. Ignoring the injuries with smaller burden sustained by such individuals may have led to a shift in estimates from milder to more severe injury categories.
Probability of permanent health loss
The estimation of the probability of long-term health loss due to a particular nature of injury is a key step in our analysis that drives the estimation of YLDs from long-term outcomes. The strategy that was used to determine the probabilities of permanent health loss has several limitations. First, in the GBD 2013 study the probability of long-term injury was based on patient-reported outcome data from follow-up studies in just three countries (China, Netherlands and the USA). Second, even though the total number of cases of the pooled data set was high, for rare nature of injury codes there were limited cases. Third, the follow-up studies used different injury classifications that needed to be mapped into the GBD cause and nature-of-injury categories and the follow-up studies used different patient-reported outcome measures, introducing greater uncertainty and potential bias in our estimation of disability.56 ,57 Fourth, for certain outpatient nature-of-injury categories high probabilities of permanent health loss were observed. An explanation for this may be that cases were misclassified as outpatients whereas in fact they were treated in an inpatient setting.
The probability of treated long-term outcomes is estimated via the ratio of the average level of disability 1 year after an injury relative to the long-term disability weight for each nature of injury category. Because this ratio incorporates the disability weights assigned to each nature-of-injury category, the probabilities of long-term outcomes depend strongly on the value of these disability weights. For GBD 2013 disability weights have changed, including all injury disability weights. This means that the probability of long-term outcomes of injuries has changed. Overall YLDs will only be affected in cases where we observed 100% probability of long-term outcomes. In other cases, higher probability of long-term results in a higher prevalence of cases with long-term consequences, but combined with lower disability weights this will result in the same overall YLDs.
Furthermore, we used DisMod-MR to stream out prevalence from incidence and this process assumes a steady state where rates are not changing over time. This steady state assumption may lead to inaccurate estimates of prevalence of long-term disability if there are large trends in incidence rates or mortality. Taking such trends into account would also require adequate data on the trends in the mortality risks in people with long-term disabilities and a new version of DisMod-MR that is under development.
Duration of short-term injury
In GBD 2010, the estimates of short-term duration were based on limited expert opinion.12 For GBD 2013, we used patient-reported data for the majority of nature-of-injury categories to provide a more empirical basis for these estimates. However, these estimated durations are based on a very limited sample size and the validity and reliability of these estimated durations may be affected by response and recall bias. Second, the patient-reported data were from the Netherlands only, a high-income country with a high access to quality healthcare and these durations may not apply to settings with lower-quality care. The duration of short-term injury in case of untreated injuries was based on the opinion of GBD injury collaborators.
Health system access and the proportion of untreated cases
To determine the proportion of untreated cases for each country-year we used a proxy covariate that defines health system access that is largely based on maternal and child health indicators. It therefore mostly reflects access to primary care services and may not reflect access to trauma services that are required for injuries. There are variables, such as hospital beds per 1000 or physician density that may serve as proxy for the proportion of untreated injury per country-year, but these have been found to vary wildly over time and between countries without face validity as an indicator of access to trauma services.
Conclusions
Globally, since 1990, there is a remarkable declining trend in the rates of DALYs due to injury. The rate of decline was significant for 22 of our 26 cause-of-injury categories, including all the major ones. The decline in rates for almost all injuries is widespread. However, the results vary by cause, age group, sex, geography and over time. These decreases in DALY rates for almost all cause-of-injury categories warrant a general statement that the world is becoming a safer place to live in, although the injury burden remains high in some parts of the world. The slower decline in incidence rates compared with YLL and YLD rates suggests that the observed changes are driven by multiple mechanisms.
The findings from the GBD are a valuable resource for countries to prioritise major contributors of injury deaths, incidence and/or DALYs and monitor progress over time. Changes over time can facilitate in raising hypotheses regarding the underlying causes. However, there may be a complex set of explanations relating to primary, secondary and tertiary prevention efforts and it may be difficult to tease out which measures have yielded the greatest effect. The GBD will continue to be updated annually and provide regular updates of the burden of disease at the national level and, increasingly over time, at the subnational level for large countries.
What is already known on the subject
Since the 1990s Global Burden of Disease and Injury (GBD) studies have quantified the important contribution of injury deaths and disability to the overall burden of disease, by world regions.
What this study adds
Detailed up-to-date results of injury deaths, incidence and disability for 21 world regions and 188 countries for 1990 to 2013.
Injuries continue to be an important cause of morbidity and mortality in the developed and developing world.
Globally, since 1990, there has been a remarkable declining trend in the rates of disability-adjusted life years of all the major causes of injury; however, the patterns vary widely by cause, age, sex, region and time.
The findings from the GBD are a valuable resource for countries to prioritise injury prevention, monitor progress over time and raise hypotheses regarding causes of changes over time.
Acknowledgments
The authors thank the GBD experts for their contributions on injuries.
References
Supplementary materials
Supplementary Data
This web only file has been produced by the BMJ Publishing Group from an electronic file supplied by the author(s) and has not been edited for content.
- Data supplement 1 - Online supplement
Press release
Files in this Data Supplement:
Footnotes
Twitter Follow Richard Franklin at @Franklin_R_C and Karen Tabb at @professortd
Contributors JH, NG, MN, IB, ECM and TJV prepared the first draft. TJV and CJLM conceived the study and provided overall guidance. All other authors provided data, developed models, reviewed results, initiated modelling infrastructure, and/or reviewed and contributed to the paper.
Funding Article funded by Bill and Melinda Gates Foundation.
Competing interests None declared.
Provenance and peer review Not commissioned; externally peer reviewed.
Data sharing statement In GBD publications and in our online visualisation tools we allow users to look up the cause of disease or injury, measure at regional, subregional, country or, for some countries, subnational level that is of interest.
Linked Articles
- Editorial