Article Text

Abstract
Background To examine unintentional drowning mortality by age and body of water across 60 countries, to provide a starting point for further in-depth investigations within individual countries.
Methods The latest available three years of mortality data for each country were extracted from WHO Health Statistics and Information Services (updated at 13 November 2013). We calculated mortality rate of unintentional drowning by age group for each country. For countries using International Classification of Disease 10 (ICD-10) detailed 3 or 4 Character List, we further examined the body of water involved.
Results A huge variation in age-standardised mortality rate (deaths per 100 000 population) was noted, from 0.12 in Turkey to 9.19 in Guyana. Of the ten countries with the highest age-standardised mortality rate, six (Belarus, Lithuania, Latvia, Russia, Ukraine and Moldova) were in Eastern Europe and two (Kazakhstan and Kyrgyzstan) were in Central Asia. Some countries (Japan, Finland and Greece) had a relatively low rank in mortality rate among children aged 0–4 years, but had a high rank in mortality rate among older adults. On the contrary, South Africa and Colombia had a relatively high rank among children aged 0–4 years, but had a relatively low rank in mortality rate among older adults. With regard to body of water involved, the proportion involving a bathtub was extremely high in Japan (65%) followed by Canada (11%) and the USA (11%). Of the 13 634 drowning deaths involving bathtubs in Japan between 2009 and 2011, 12 038 (88%) were older adults aged 65 years or above. The percentage involving a swimming pool was high in the USA (18%), Australia (13%), and New Zealand (7%). The proportion involving natural water was high in Finland (93%), Panama (87%), and Lithuania (85%).
Conclusions After considering the completeness of reporting and quality of classifying drowning deaths across countries, we conclude that drowning is a high-priority public health problem in Eastern Europe, Central Asia, Japan (older adults involving bathtubs), and the USA (involving swimming pools).
This is an Open Access article distributed in accordance with the Creative Commons Attribution Non Commercial (CC BY-NC 4.0) license, which permits others to distribute, remix, adapt, build upon this work non-commercially, and license their derivative works on different terms, provided the original work is properly cited and the use is non-commercial. See: http://creativecommons.org/licenses/by-nc/4.0/
Statistics from Altmetric.com
Introduction
Despite the global decrease of age-standardised unintentional drowning mortality rate from 7.5 (deaths per 100 000 population) in 1990 to 5.1 in 2010, there was still a total of 439 100 unintentional drowning deaths globally in 2010, according to the Global Burden of Disease Study 2010 (GBD 2010).1 Of 439 100 estimated unintentional drowning deaths in 2010, one-third (32.1%) were children aged 0–14 years, and one-fifth (21.5%) were young adults aged 25–44 years. The drowning death rate differed by age group: 12.6 (deaths per 100 000 population) for children aged 1–4 years, 3.0 for early adolescents aged 10–14 years, 5.0 for late adolescents aged 15–19 years, 3.8 for adults aged 44–49 years, and 7.5 for older adults aged 70–75 years.1 For years of life lost, unintentional drowning ranked 21 among 179 causes of death globally; however, the rank was 12 in Eastern and Central Asia and 54 in Western Europe.1 However, the GBD 2010 did not analyse drowning deaths by body of water.1 The GBD found huge variations in unintentional drowning mortality by age and region, which are mainly due to exposure to different bodies of water (eg, bathtub, swimming pool, pond, lake, stream, river, or beach), activities (eg, activities of daily living, recreation, or work-related activities), and circumstances (eg, after drinking alcohol, during a flood, or the occurrence of diseases, such as epilepsy).2
Brenner and Taneja suggest that delineation of location and circumstances surrounding the drowning event are key to identifying prevention strategies.3 While there have been many epidemiological studies on locations and circumstances surrounding drowning deaths, most of these studies were confined to a single country. Furthermore, most of these studies focused on children,4–18 which cannot help us understand the worldwide diversity of drowning mortality rates. In regards to international comparisons, we found only two. One study examined drowning mortality worldwide, but this study did not present the age-specific drowning mortality rate in each country.19 Another recent report revealed a detailed picture of drowning mortality rates among children in low-income and middle-income counties in Asia.20 However, no study yet has compared unintentional drowning mortality rates in middle and older adults across countries. International comparisons of injury mortality can help generate hypotheses and provide clues for injury prevention.21–24 Thus, we sought to examine unintentional drowning mortality by age and body of water across countries to provide a starting point for further in-depth investigations of unintentional drowning mortality within individual countries.
Methods
Data source
Mortality data for each country were extracted from the WHO Health Statistics and Health Information Services.25 As of 13 November 2013, 153 countries had submitted mortality data to WHO. Because we are interested in relatively current comparisons, we excluded countries for which the latest available data was before 2005.
Different countries used different Revision and Tabulation List of the International Classification of Disease (ICD). We used ICD-8 condensed A List A143 (ie, detailed ICD-8 code E910), ICD-9 condensed Basic Tabulation List B521 (ie, detailed ICD-9 code E910), ICD-10 condensed Tabulation List 1 1098 (ie, detailed ICD-10 codes W65-W74), and ICD-10 detailed Three and Four Character List ICD-10 codes V90, V92, W65–W74 to identify unintentional drowning deaths.
To ensure statistical stability in calculating the mortality rate by age group, we combined data for the latest available 3 years, and included only those countries that reported more than 150 unintentional drowning deaths for all age groups. Based on these inclusion criteria, a total of 60 countries were included in the final analysis.
One country (Turkey) used condensed ICD-8 List A; one country (Greece) used condensed ICD-9 Basic Tabulation List; four countries (Kazakhstan, Belarus, Russia, and Ukraine) used condensed ICD-10 Tabulation List 1; seven countries (South Korea, Malaysia, Taiwan, Bulgaria, Serbia, Egypt, South Africa) used detailed Three Character List ICD-10 codes; and the remaining 47 countries used detailed ICD-10 Four Characters List codes.
Completeness and quality of mortality data differed across countries; because this affects interpretation of this study, we listed the completeness of mortality data for each country as assessed by the WHO.26 There were nine countries for which the completeness of mortality data was less than 90%, and seven countries for which the information on completeness was not available (Appendix). For countries that used detailed ICD-10 Three or Four Character List codes, we further examined the quality of reporting for body of water (ie, bathtub, swimming pool, natural water, other) and mechanism (while in water or falling into water). To do this, we calculated the percentage of drowning deaths classified as ‘unspecified’ (ICD-10 code W74) among all drowning deaths (ICD-10 codes W65-W74). We defined ‘high quality’ data as having less than 20% as ‘unspecified’, as suggested by the Global Burden of Disease Injury Expert Group.27
Statistical analysis
We first calculated the age-specific (0–4, 5–14 15–24, 25–44, 45–64, and 65+ years) unintentional drowning mortality rates (deaths per 100 000 population) and 95% CIs in each country and region. Some countries did not provide population data to WHO, so we used population data from the 2010 Revision of the World Population Prospects undertaken by the Population Division of the United Nations Department of Economic and Social Affairs of the United Nations Secretariat.28 We used the WHO World Standard Population to compute the age-standardised mortality rate.25 We then ranked the unintentional drowning mortality rates of each country by age groups. For countries that used detailed ICD-10 Three or Four Character List codes, we further illustrated the percentage of drowning deaths by body of water (ie, bathtub, swimming pool, natural water, other, and unspecified). The countries were grouped according to region as used by the GBD 2010.1
Results
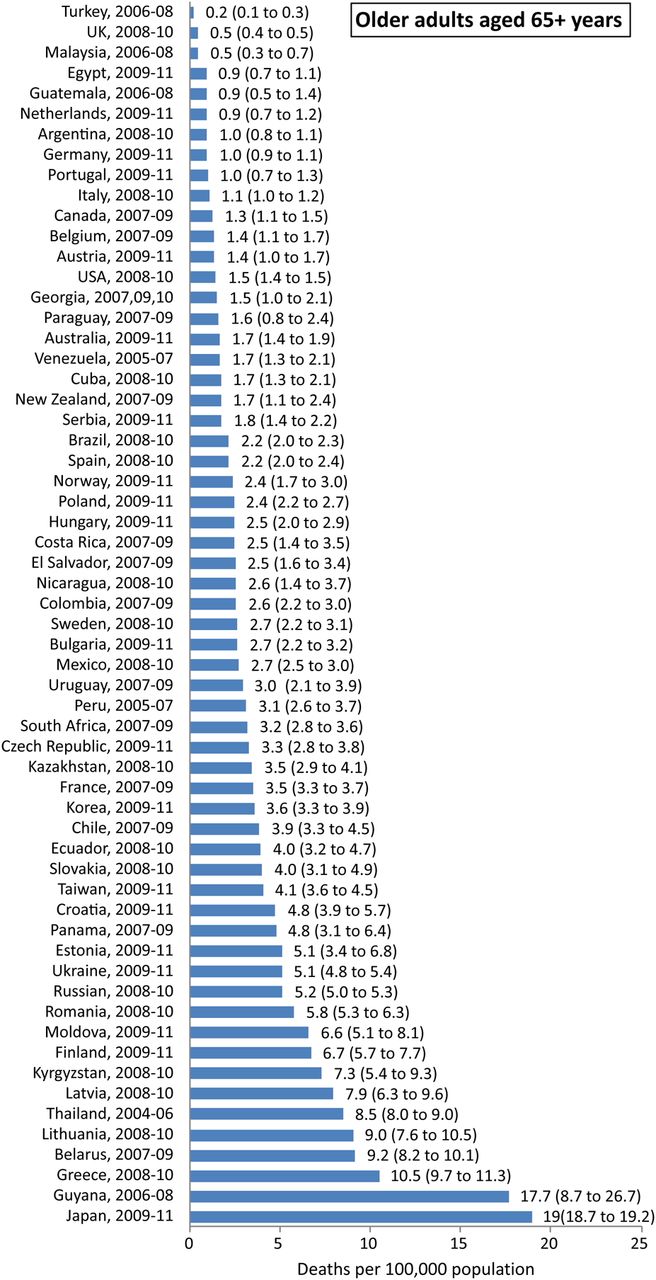
Table 1 presents the ranking of unintentional drowning mortality rate for each country by age groups. Of the 10 countries with highest ranking in age-standardised mortality rates, six (Belarus, Lithuania, Latvia, Russia, Ukraine and Moldova) were in Eastern Europe and two (Kazakhstan and Kyrgyzstan) were in Central Asia. Some countries (Japan, Finland and Greece) had a relatively low rank in mortality rate among children aged 0–4 years (43, 48 and 40, respectively) but had a high rank in mortality rate among older adults (1, 9, and 4 respectively). On the contrary, South Africa and Colombia had a relatively high rank among children aged 0–4 years (7 and 9) but had a relatively low rank in mortality rate among older adults (25 and 31). The numbers, proportions and rates of unintentional drowning deaths in each country are illustrated by age and region in online supplementary file 1.
Ranking of unintentional drowning mortality rates for each country by different age groups
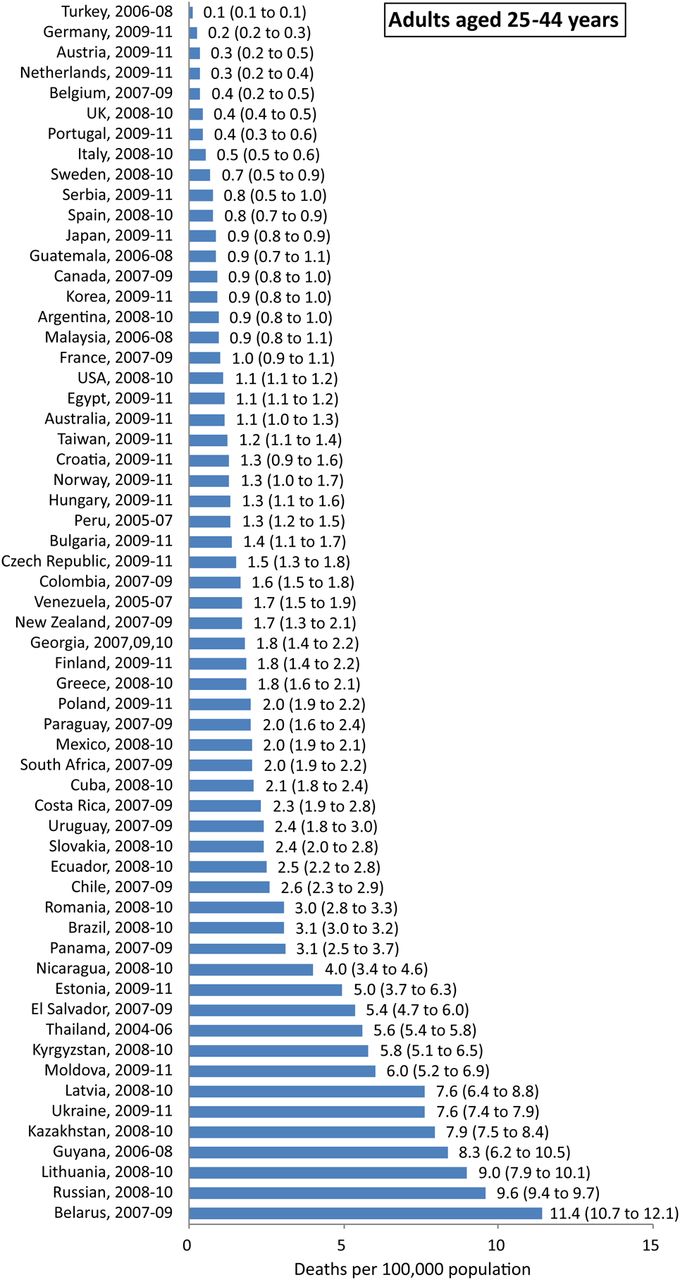
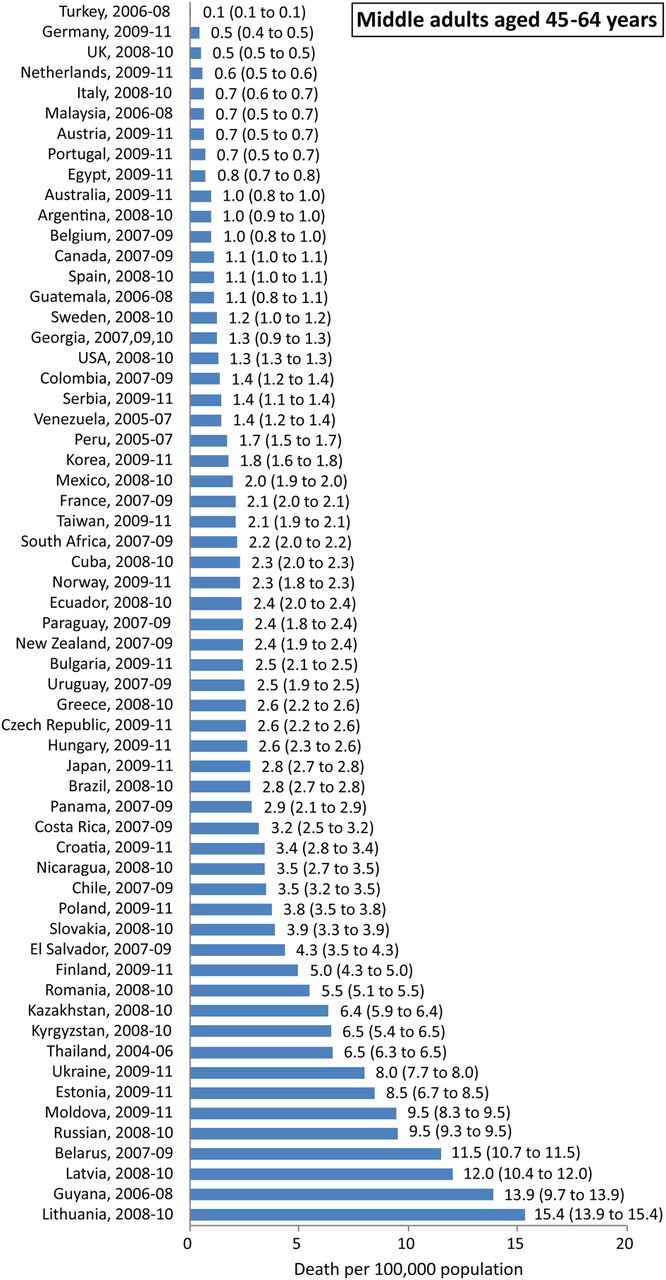
The age-standardised and age-specific unintentional drowning mortality rate and 95% CI in each country are illustrated in figures 1⇓⇓⇓⇓⇓–7. The range in mortality rate between countries with highest and lowest rates was largest among children aged 0–4 years, and was lowest among young adults aged 15–24 years, and middle adults aged 45–64 years.

The age-standardised unintentional drowning mortalty rate (deaths per 100 000 population) and 95% CIs in each country.

Unintentional drowning mortalty rate (deaths per 100 000 population) and 95% CIs for children aged 0–4 years in each country.

Unintentional drowning mortalty rate (deaths per 100 000 population) and 95% CIs for children aged 5–14 years in each country.

Unintentional drowning mortalty rate (deaths per 100 000 population) and 95% CIs for young adults aged 15–24 years in each country.

Unintentional drowning mortalty rate (deaths per 100 000 population) and 95% CIs for adults aged 25–44 years in each country.

Unintentional drowning mortalty rate (deaths per 100 000 population) and 95% CIs for middle adults aged 45–64 years in each country.
Unintentional drowning mortalty rate (deaths per 100 000 population) and 95% CIs for older adults aged 65 years and above in each country.
Of the 54 countries that used ICD-10 detailed Three or Four Character List codes (see online supplementary file 2), only 14 countries provided high-quality information on body of water and mechanism of drowning, that is, with less than 20% classified as unspecified (table 2). The proportion of unintentional drowning deaths involving bathtubs was extremely high in Japan (65%), compared to the second and third highest, Canada (11%), and the USA (11%). Of the 13 634 drowning deaths involving bathtubs in Japan between 2009 and 2011, 12 038 (88%) were older adults aged 65 years or above. The proportion involving natural water was high in Finland (93%), Panama (87%), and Lithuania (85%). The percentage involving swimming pools was high in the USA (18%), Australia (13%), and New Zealand (7%).
Number and percentage of unintentional drowning deaths by body of water for 14 countries that used ICD-10 detailed 3 or 4 Character List with percentage of unspecified code less than 20%
Of the 2088 drowning deaths occurring in swimming pools in the USA between 2008 and 2010, 766 (37%) were children aged 0–4 years, 244 (12%) were children aged 5–14 years, 163 (8%) were young adults aged 15–24 years, 264 (13%) were adults aged 25–44 years, 319 (15%) were middle adults aged 45–64 years, and 332 (16%) were older adults aged 65 years and above. With regard to the mechanism of drowning in swimming pools in the USA, the proportion that involved falling into water was 18% (141/766) among children aged 0–4 years, 7% (17/244) among children aged 5–14 years, 4% (6/163) among young adults aged 15–24 years, 5% (13/264) among adults aged 25–44 years, 7% (23/319) among middle adults aged 45–64 years, 21% (70/332) among older adults aged 65 years and above.
Discussion
The findings of this study suggest huge variations in unintentional drowning mortality rates and relative involvement of different bodies of water across countries. We found a more than 20 times difference in highest and lowest age-standardised mortality rates between countries. Countries in Eastern Europe and Central Asia had comparatively high mortality rates. Japan had an extremely high mortality rate among older adults involving bathtubs. The USA had the highest relative proportion involving swimming pools.
We should be cautious regarding the comparability of mortality data across countries due to variable completeness and coverage. The GBD 2010 study stressed that completeness of mortality data is often substantially different for child and adult deaths; while in some regions, such as Latin America, child completeness is usually lower than adult completeness, alternate patterns are observed in Asia. Some systems capture deaths relatively completely in selected administrative units only, such as in Turkey. Therefore, completeness of registration might be high but coverage is not.1 The findings of this study indicate that mortality rate in Turkey was lowest in each age group, which might be due to poor coverage reporting drowning deaths.
Most unintentional drowning events occurred in communities with natural water such as seas, rivers, lakes and ponds; subsequently, the victims are found dead at the scene many hours after the drowning event occurred. Many of these drowned corpses are not brought to hospitals or health facilities and, therefore, are under-recognised. Furthermore, societal factors ranging from financial consideration, to fear of punitive legal implications for the persons reporting the drowning, to distance to health facilities, and lack of transportation all may be factors that impede reporting. According to UNICEF survey, estimation of child drowning in low and middle-income countries in Asia, around 20% of child drowning deaths were under-recognised in all countries surveyed.20
Of the 10 countries with the highest age-standardised mortality rates estimated in this study, Guyana and Thailand had completeness levels less than 90%. For the other eight countries, two were in Central Asia (Kazakhstan and Kyrgyzstan) and six were in Eastern Europe (Belarus, Latvia, Lithuania, Moldova, Russia, and Ukraine). Six of these are members of or participate in the Commonwealth of Independent States, where it has been suggested that the increasing injury mortality rates are a consequence of poor management of the societal transition to market economies. Furthermore, there are high rates of alcohol consumption, which is an obvious risk factor for unintentional injuries.29 However, no study yet has specifically examined the exact circumstances of unintentional drowning deaths in Eastern European countries, and the potential connection to alcohol consumption.
We should also consider the quality of reporting for specific information on death certificates across counties. We defined high quality of reporting as less than 20% of drowning deaths classified as unspecified for body of water or mechanism of drowning. According to this definition, only 17 out of 69 countries (25%) using ICD-10 detailed Three or Four Character List codes submitted high-quality drowning-related mortality data to WHO in 2009.30 In 2003, the number of countries with high-quality mortality data was 14 out of 54 (26%), not a significant change.
Of the 14 countries with high quality in reporting information on body of water in this study, natural water was the main body of water involved in unintentional drowning deaths in 13 countries. The only exception was Japan, where bathtub was the main body of water involved and victims were mostly older adults. Researchers in Japan pointed out the low autopsy rates for elderly deaths involving bathtubs and suggested that many of the so-called drowning deaths were actually due to ischaemic heart disease or cerebrovascular disease. They also found variation in personal preferences of medical examiners, police surgeons, and general practitioners for certifying drowning deaths versus cardiovascular diseases deaths.31 ,32
There is no specific subcategory under natural water. Previous studies have indicated that the main type of natural water differed across countries. The type of natural water most often involved was, lake, in Finland; sea, in Denmark,4 Australia,6 Singapore,10 northern Iran15 and urban South African18; pond/ditch, in rural Bangladesh,5 China13 and south India.14 The variations are due to geographic environment, climate and cultural activities, which influence circumstances that may result in drowning.
There were two countries with a relatively high proportion of drowning in swimming pools: the USA (18%) and Australia (13%). A US study of swimming pool drowning deaths among residents aged 5–24 years indicated that the majority of Black victims (51%) drowned in public pools, the majority of White victims (55%) drowned in residential pools, and the majority of Hispanic victims (35%) drowned in neighbourhood pools.33 Our findings point out that one-third of swimming pool drowning deaths were middle and older adults. However, no study yet has examined circumstances surrounding swimming pool drowning among middle and older adults. We also found that children and older adults were the age groups with highest percentage, with falling into water as the mechanism involved. Further studies are needed to collect relevant information on drowning deaths involving falling into water in a swimming pool, for designing better preventive measures.
Several other limitations should be noted. First, many countries with high drowning mortality rates (eg, India and Bangladesh) were not included because no data were available in the WHO mortality database. Second, to ensure statistical power stability, we confined our analysis to countries that reported more than 150 deaths by drowning with the most recent year of data after 2005, which resulted in 93 countries being excluded from the analysis (including China). Third, for countries using condensed ICD-9 Basic Tabulation List or condensed ICD-10 Tabulation List, we could not identify water transport-related drowning deaths (ie, ICD-9 code E830 and E832 and ICD-10 code V90 and V92).
Despite these limitations, this preliminary descriptive epidemiological study can still provide useful information as a starting point for further in-depth investigations within individual countries. After considering the completeness of reporting and quality of classifying drowning deaths across countries, we conclude that drowning is a high-priority public health problem in Eastern Europe, Central Asia, Japan (older adults involving bathtubs), and the USA (involving swimming pools). Further in-depth studies are needed to explore the exact circumstances and specific factors as basic information in designing relevant counter-measures.
What is already known on the subject
Most previous studies on unintentional drowning mortality were confined to one country and focused on children.
Little is known with regard to drowning mortality rates for middle-aged and older adults, with a global picture.
What this study adds
Age-standardised drowning mortality rates were highest in countries in Eastern Europe and Central Asia.
Older adults in Japan had an extremely high drowning mortality rate involving bathtubs.
The proportion of drowning deaths in swimming pools was highest in the USA. Children and older adults had high percentages of falling into swimming pools.
Acknowledgments
The authors thank Ms. Bai-Huan Lin for her analyses of data.
References
Supplementary materials
Supplementary Data
This web only file has been produced by the BMJ Publishing Group from an electronic file supplied by the author(s) and has not been edited for content.
Files in this Data Supplement:
- Data supplement 1 - Online supplement
- Data supplement 2 - Online supplement
Footnotes
Collaborators Tsung-Hsueh Lu.
Contributors C-YL, Y-FW and T-HL conceived the study, guided the analyses, wrote the article draft and are the guarantors of the study. IK interpreted the results and critically revised the manuscript.
Funding This study was funded by the Department of Health of Taiwan (DOH101Z3087), the National Science Council (NSC102-2314-B-006-054) and the Chi-Mei & National Cheng Kung University Joint Program (CMNCKU10016).
Competing interests None.
Patient consent No.
Ethics approval This study was approved by the Institutional Review Boards of Chi-Mei Medical Center (09909-004) and National Cheng Kung University Hospital (ER-99-170).
Provenance and peer review Not commissioned; externally peer reviewed.
Data sharing statement The data used in this study are accessible from website of the WHO Health Statistics and Health Information Services.