Article Text

Abstract
Objectives (1) Estimate age, period and cohort effects for motorcyclist traffic casualties 1979–2008 in New Zealand and (2) forecast the incidence of New Zealand motorcycle traffic casualties for the period 2019–2023 assuming future age, cohort and period effects, and compare these with an estimate based on simple linear extrapolation.
Methods Age-period-cohort (APC) modelling was used to estimate the individual effects of age, period and cohort after adjusting for the other two factors. Forecasting was produced for three period-effect scenarios.
Results After adjusting for cohort and period effects, 15–19-year-olds have substantially elevated risk. The period effect reduced in significance over time until the last period, 2004–2008, where the risk was higher than the preceding period. The 10-year cohorts born 1949–1958, 1954–1963, 1959–1968 and 1964–1973, had elevated risk. The forecasting, based on APC modelling, resulted in the lowest estimates of the future incidence being approximately one-third that of the highest estimate (6641).
Conclusion Trends in motorcycle casualties have been influenced by significant independent age, period and cohort effects. These need to be considered in forecasting future casualties. The selection of the period effect has a significant impact on the estimates. Which period-effect scenario readers choose to accept depends on their views about a wide range of factors which might influence motorcycle use and crash risk over time.
- Motorcycle
- age
- cohort
- period
- forecasting
- interventions
- advocacy
- legislation
- public health
- methodology
- surveillance
- terminology
- populations/contexts
- adolescent
- behavioural
- MVTC
This is an open-access article distributed under the terms of the Creative Commons Attribution Non-commercial License, which permits use, distribution, and reproduction in any medium, provided the original work is properly cited, the use is non commercial and is otherwise in compliance with the license. See: http://creativecommons.org/licenses/by-nc/3.0/ and http://creativecommons.org/licenses/by-nc/3.0/legalcode
Statistics from Altmetric.com
- Motorcycle
- age
- cohort
- period
- forecasting
- interventions
- advocacy
- legislation
- public health
- methodology
- surveillance
- terminology
- populations/contexts
- adolescent
- behavioural
- MVTC
Introduction
Latest figures on road fatalities in 33 countries published by the International Transport Forum at the Organisation for Economic Co-operation and Development show that the first 10 years of the 21st century were a record for road safety.1 The total number of road fatalities fell in 30 of the 33 Organisation for Economic Co-operation and Development countries and, in many cases, the average annual drop in road deaths was dramatically higher than in previous decades. Despite the marked reduction in the number of overall road fatalities, the 2000–2009 decade saw motorcycle deaths increasing in 13 countries.1 A similar source of international trends for serious non-fatal motorcycle crashes does not exist, and statistics for individual countries are difficult to obtain. In New Zealand (NZ), the annual incidence of non-fatal motorcycle crashes reported to the police in the 1950s was approximately 1300 (60 per 100 000 population). Twenty years later, this had risen to a historic peak of approximately 4000 per annum (127 per 100 000 population). By 1995, the incidence had dropped to approximately 1500 (40 per 100 000 population), and continued to its lowest record level at the turn of the century at 669 incidents (17 per 100 000 population). Since then, the incidence has been steadily increasing; in 2009 the Ministry of Transport reported 1369 incidents (32 per 100 000 population).2 This increase in incidence over the last decade has also been reported for the USA.3
As part of road safety planning, government agencies often seek to predict future crash trends. For example, in NZ, it has been suggested that if the recent trend for motorcycles continues, NZ will expect to see a total of 650 fatalities for the 10 years 2010–2020, and about 20 000 injuries for the same period.4 The basis for these estimates has been simple linear extrapolation based on injuries in recent years.
Such extrapolations are problematic. This is well illustrated by one of the explanations for the increase in motorcycling, namely the rise in popularity among older age groups.4 These older drivers come from a period in history where there was a post-World War II ‘boom’ in births. They are often referred to as ‘baby boomers’. A commonly accepted operational definition of a baby boomer is someone born between 1946 and 1965.5 Many of these baby boomers would have ridden motorcycles when they were young, when motorcycling was very popular as a cheap form of transport compared with cars. Moreover, it is reasonable to assume that many were desirous of owning more expensive models that were beyond their financial resources at the time. Now that they are in their 50s and 60s, with fewer family responsibilities and more disposable income, many chose to ‘relive their youth’. This cohort brings a unique social and cultural experience to the situation. More importantly, the impact of that experience will not persist as this cohort will get older and less interested in or able to participate in motorcycling and begin to die off.
As the ‘baby boomers’ age and decline in number, the population, as a whole, is getting older. Assuming the current level of motorcycle use by various age groups, the relative impact of the younger age groups which have the highest risk, will be less (ie, age effect).
Other explanations for the rise in motorcycle injuries include increased exposure (motorcycle miles driven) due to higher fuel prices, congestion and environmental awareness.4 ,6 These factors (period effects) impact on all age groups to varying degrees.
Age, period and cohort effects interact with one another. For example, for some of the baby boomers who used to ride in their youth, the price of fuel may have been the trigger which prompted them to return to motorcycling. Similarly, graduate loan debt (a relatively new phenomenon in NZ) and soaring unaffordability of housing (worst in the history of NZ), may prompt some young people to take up motorcycling in order that they are more able to save the deposit for a house or a first or second car.
For reasons of resource allocation, it is important that we determine, based on past experience, the independent impact on motorcycle injury crashes of age, cohort and period effects, and use this information to model various scenarios to forecast the future incidence of motorcyclist casualties.
We sought to:
-
Estimate age, period and cohort effects for motorcyclist traffic casualties covering 1979–2008 in NZ
-
Forecast the NZ incidence of motorcycle traffic casualties for 2019–1923, assuming future age, cohort and period effects, and compare these with an estimate based on simple linear extrapolation.
Methods
Cases were sourced from the Ministry of Health's (MoH) National Minimum Dataset of all publicly funded discharges from hospitals, and from the MoH's Mortality Collection. Cases were selected according to the following criteria:
-
A pillion rider (ie, passenger) or driver of a motorcycle injured in a motor vehicle traffic crash between 1979 and 2008
-
Either died within 30 days as a result of the crash, or had non-fatal injuries which required public hospital inpatient treatment of at least 1 day
-
Were aged between 10 and 69 years.
Motorcycle traffic crashes were defined as those with external cause codes in the range 810–819 with a fourth digit of two or three in International Classification of Diseases 8th revision (year 1979), or ICD-9 (years 1980–1998), or V20–V29 in ICD-10 (years 1999–2008).
For non-fatal cases, the principal diagnosis (the primary reason for admission to hospital) needed to be recorded as an injury, as defined by ICD injury and poisoning codes. All readmissions were excluded. For cases discharged during 1989–2008 readmissions were determined according to the method described by Davie and others.7 Briefly, for a given person, all admissions with the same date of injury as an earlier admission, or cases with a date of admission within 1 day of earlier discharge, were treated as readmissions. This approach was not possible for the years 1979–1988 since date of injury was not recorded on the electronic file. For these years, we relied on the MoH's readmission indicator.
Rates
The denominators used for calculating rates were the annual end-of-year age-specific population estimates sourced from Statistics New Zealand (SNZ). NZ resident population estimates are available for years 1991–2008, and NZ de facto population estimates are available for earlier years. Both are derived from census figures, with similar adjustments for changes due to births and deaths, but with different adjustments for overseas migration. SNZ reports that the differences between the two types of estimates are smaller at the end of each year compared with mid-year, and stable over the years, thus, the change from end-of-year de facto to resident estimates will have minimal effect.
(http://www.stats.govt.nz/products-and-services/Articles/pop-est-changes-Mar99.htm).
Individuals were grouped into 12 age groups with the youngest age group 10–14 yrs and the oldest 65–69 yrs. The 30 years of data (1979–2008) were grouped into six 5-year periods, with the period 1979–1983 forming the first period. The diagonal elements of the age group by period matrix correspond to the 10-year birth cohorts. This resulted in 17, 10-year overlapping birth cohorts (1909–1918, 1914–1923, 1919–1928 … 1989–1998).
Rates were calculated for each age group as the number of casualties (ie, sum of fatalities and non-fatal hospitalised injuries) per 100 000 person years.
Age-Period-Cohort (APC) models were used to assess the individual effects of these three factors. As the linear dependency of age, period and cohort (period = age + cohort) is a major methodological challenge for APC models, numerous possible solutions have been identified8–13 After a thorough search in the literature for APC models, we determined that fitting the intrinsic estimator (IE) model13 was the most appropriate approach. This approach is based on estimable components, and uses principle component regression to remove the influence of the null (column) space of the design matrix on the estimator. The method is fully described elsewhere.13 In brief, instead of modelling response variables in terms of explanatory variables directly, this method models outcome variables in terms of principle components of the explanatory variables, and then the results are back-transformed to the original variables space. Because principle components are non-colinear, this method is able to overcome the problems associated with linear dependency among explanatory variables. The IE model has been recommended as a better alternative to the widely discussed, constrained, generalised linear model.13 We used the IE model to estimate individual effects of age, period and cohort. The number of casualties was included as the response variable, population as the exposure variable, and age group, period and cohort as predictor variables. STATA V.11.2 with the ‘add-on’ command apc_ie was used for the analysis.14 The estimated effects for each variable were adjusted for the other two variables and presented as rate ratios using appropriate reference groups.
Forecasting
Estimates which considered age, cohort, period effects
There were four steps in the derivation of the estimated incidence for 2019–2023. First, we determined which age group and cohorts would be in the future period. Second, we forecast rates for each age group separately using APC models. Third, we multiplied the age-specific rates to the estimates of the future population to produce an estimate of incidence for that age group. Fourth, we summed the age group estimates.
The predicted population was sourced from SNZ's Series 5 population growth scenario (medium fertility, medium mortality and medium net migration. (http://www.stats.govt.nz/products-and-services/table-builder/pop-projections.htm).
For the period (2019–2023) that we wished to forecast, there were three cohorts (1994–2003, 1999–2008, 2004–2013) that were not included in our modelling for the period 1979–2008. We thus assumed that these three cohorts have the same level of effect that is equal to the average effect of the four nearest cohorts (ie, 1974–1983, 1979–1988, 1984–1993 and 1989–1998).
Forecasts were produced for three scenarios of the period effect: Scenario (A) assumes the period effect continues to remain at the 2004–2008 level; Scenario (B) assumes the period effect from present time to the future follows the trend observed for 1984–2003 and Scenario (C) assumes that the period effect follows the trend observed for 1999–2008.
Estimate based on simple extrapolation
This scenario (Scenario D) assumes that the observed trend in incidence rate since 2002 (figure 1) will continue for the future, adjusted for population changes. To this end, we fitted a simple linear regression.
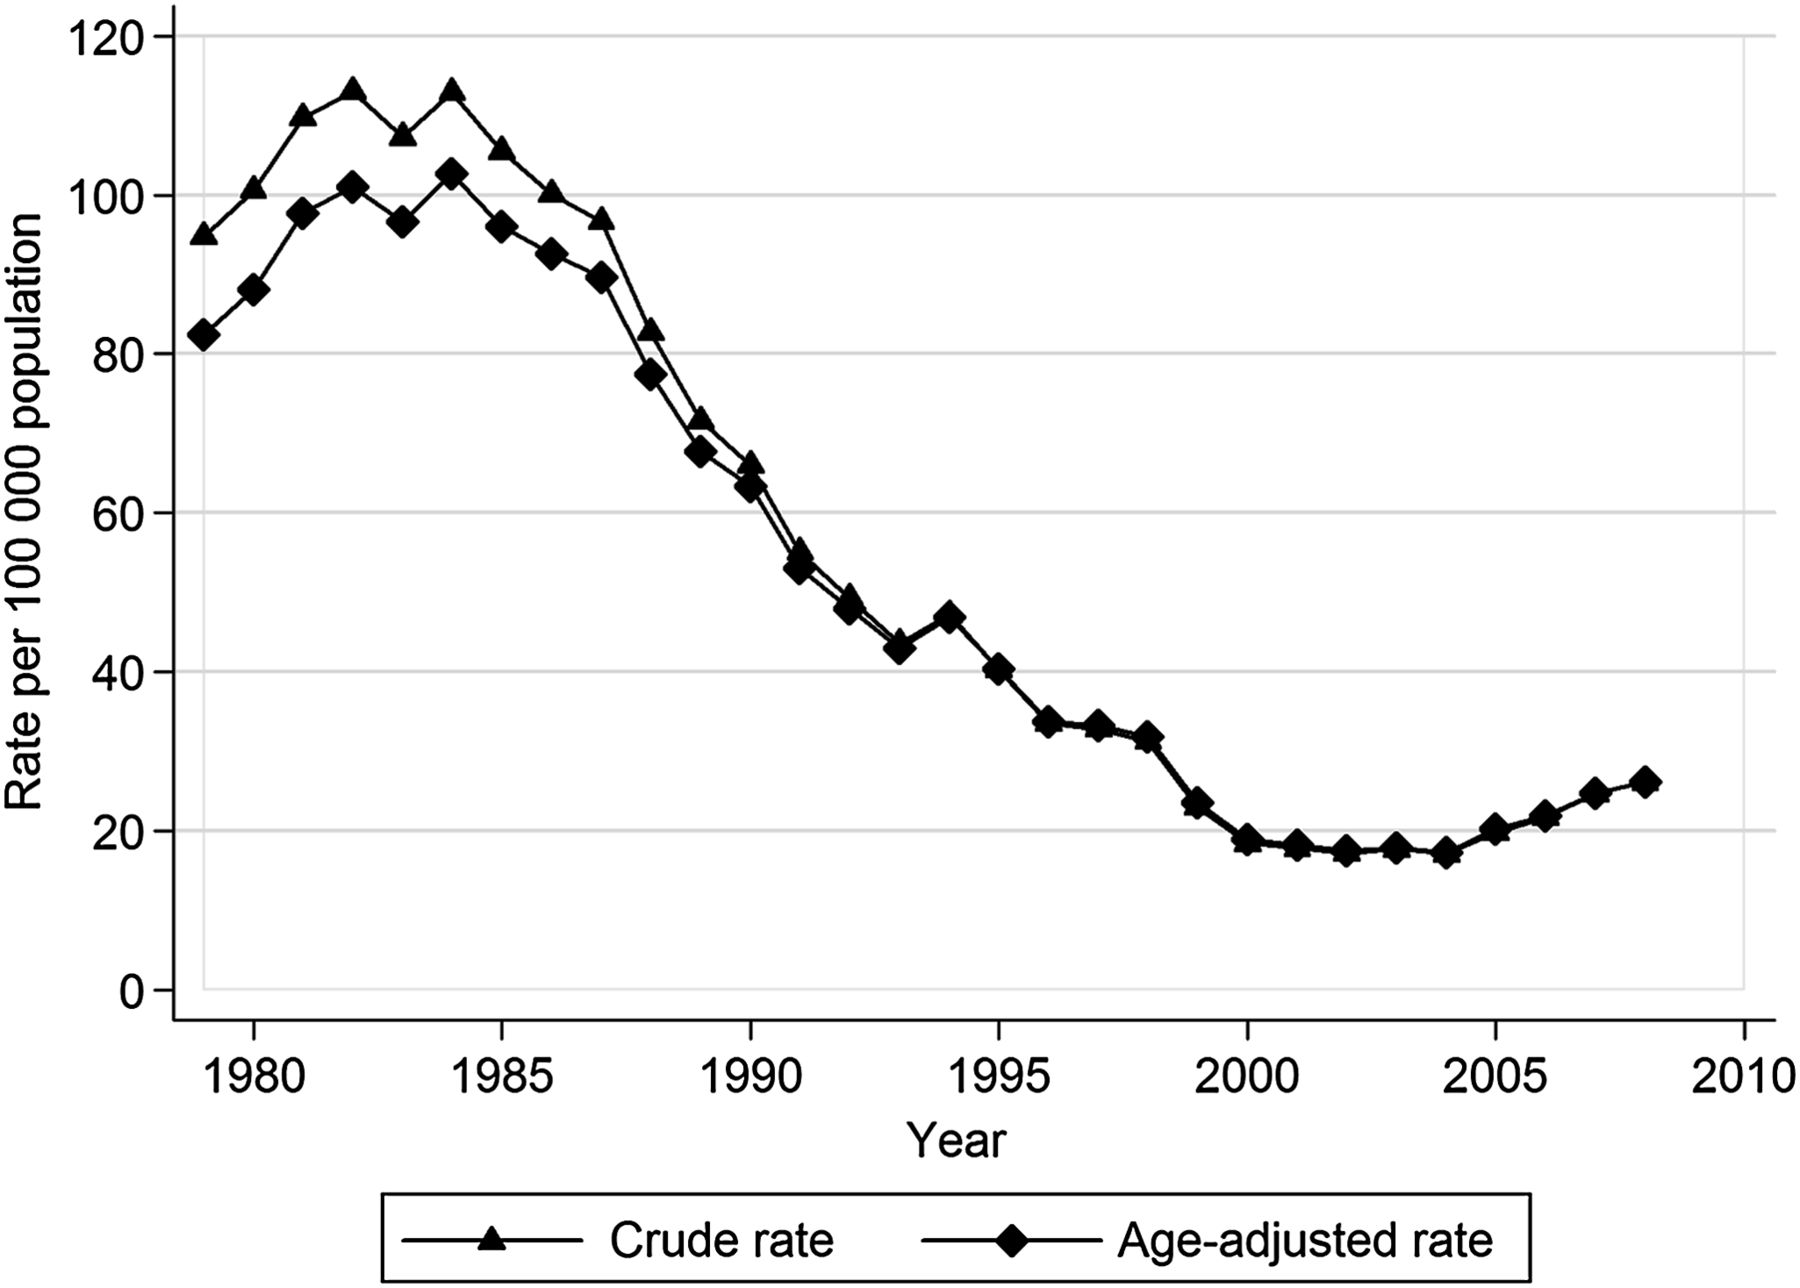
Motorcycle casualties (fatal and hospitalised non-fatal): crude and age-adjusted rates by year.
Results
There were 45 076 casualties (2271 fatalities and 42 805 hospital admissions) over the period 1979–2008. Figure 1 shows the crude and age-adjusted rates for that period and, in particular, the trend from 2002 to 2008 which has become of concern to government, health and transport agencies.
Figure 2A,B,C show the age, period and cohort effects, respectively, from the IE model. Risk increased dramatically from age group 10–14 to a peak at 15–19, and declines rapidly to age 35 where the risk has stabilised (figure 2A). Figure 2B shows that the period effect reduced substantially, relative to 1979–1983, until the last period, 2004–2008. Those born 1949–1958, 1954–1963, 1959–1968 and 1964–1973, had elevated risk relative to the 1944–1953 cohort (figure 2C).

(A) Age effects after adjusting for cohort and period effects. (B) Period effect after adjusting for age and cohort effects. (C) Cohort effect after adjusting for age and period effects.
Figure 3 provides an assessment of the model fit by comparing the observed casualties with casualties predicted by the model. Our simple linear regression had an R2=0.92.

Indication of model fit: observed versus predicted incidence by year.
Table 1 shows the contribution of age groups and cohorts to the derivation of estimates for Scenarios A, B and C.
Outcomes of the four steps in derivation of incidence for 2019–1923
Our forecast under Scenario A, based on the assumption that the period effect would remain at the level observed in 2004–2008 (figure 2B), resulted in an estimate of the incidence for 2019–2023 of 3596 casualties (range 20.5–20.6 per 100 000 population per year). Under Scenario B, where we assumed the period effect would continue to trend downward, as observed for 1984–2003 (figure 2B), we estimate there would be 2076 casualties (range 11.8–11.9 per 100 000 population per year). Under Scenario C, where we assumed the period effect would continue to trend upward, as observed for the period 1999–2008, we estimate 6641 casualties (range 37.8–38.1 per 100 000 population per year). Our highest estimate (Scenario D) of 8145 casualties (range 43.4–49.8 per 100 000 population per year) was produced by simple extrapolation based on the trend in incidence observed since 2002 (figure 1).
Discussion
The results show that even after adjusting for cohort and period effects, the 15–19-year-olds have substantially elevated risk.
The reducing period effect to 2003 is most likely due to a reduction in exposure brought about by the reducing popularity of motorcycles as a mode of transport. In 1979, the start of the first period we studied, there were 111 653 motorcycles registered for use on public roads. By 2003, the end the declining period effect, the number had declined by 50%. In 2008, the number of registrations had increased 172% over the 2003 registrations to 97 0422
The 1949–1958, 1954–1963 and 1959–1968 cohorts had high rates. These cohorts approximate the operational definition of a baby boomer. One reason put forward for the higher rates of baby boomers is that after an absence from motorcycling they return to riding larger and more powerful motorcycles than they did in their younger years. The lack of recent experience, coupled with the unfamiliar characteristics of modern and large motorcycles may place them at elevated risk. It should be noted, however, that the 1964–1973 and 1969–19*78 cohorts also had relatively high rates.
There was substantial variation in the forecasts for 2019–2023. Nevertheless, Scenario D, the simple extrapolation approach, produced the highest incidence by a considerable margin. This suggests that it is likely to be an overestimate. Elvik, in examining long-term trends in the number of fatalities in eight highly motorised countries stated: “ …simple trend lines fitted to the count of traffic fatalities for a period of 10–30 years are completely worthless as a basis for predicting the future number of fatalities.” Elvik (p.249).15
The investigation has a number of strengths. It is highly likely to have captured all the cases of interest. The registering of deaths and their causes is comprehensive in NZ. Our source of injuries from non-fatal crashes was public hospital discharges which covers the entire population of NZ. In addition, injured persons requiring acute hospital inpatient treatment would rarely attend a private hospital in NZ.16 While our study was restricted to those aged 10–69 years, <1% of motorcycle injury crashes resulting in hospitalisation (the majority of events in the analyses) involve those <10 years of age and >69 years of age.17
There are some limitations to our analyses. The modelling assumes that the members of the various cohorts are not differentially affected by emigration and immigration. We have no practical way of determining whether this is the case.
Figure 3 shows that using our model for the period 1979–2008, our predicted incidence provided a reasonable estimate of observed incidence. The obvious difference is that the predicted values follow more of a step function. This is because our model produced one rate for each of the 5-year periods, and that rate thus applies to each individual year in the period.
For the period that we wished to forecast (2019–2023), there were high-risk age groups (15–19, 20–24 years of age) from cohorts (1994–2003, 1999–2008, 2004–2013) that could not be included in our modelling for the period 1979–2008. We thus assumed these three cohorts have the same level of effect equal to the average effect of the four nearest cohorts. While this is less than ideal, the alternative would have been to restrict our forecasting to those aged 25–69. That would have seriously limited the usefulness of the forecasting, given we had established that those aged 15–19 had the highest casualty rate.
A major challenge for a study such as this is estimating the future period effect. The difficulties are well illustrated by a US study which demonstrated that motorcycle registrations and motorcycle fatalities in the USA are closely correlated with the price of petrol.6 This suggests that predictions of future gasoline prices would be a reasonable basis on which to estimate a period effect. The US study showed that petrol prices declined from 1900 to 1998, but then climbed steeply and steadily thereafter until 2006, the end of the series studied. In 2006, it would not have been unreasonable to assume, based on recent experience, that the price would keep rising. In practice, the prices have been very volatile. For example, the price per gallon of petrol in June 2006 was US$ 2.93, and in 2007 it had risen very little (US$ 3.10), but in 2008 it climbed to a high of US$ 4.10, then it dropped back to 30 cents below the 2006 price. The price rose 10 cents in 2010, and then by nearly a dollar in 2011 (US$ 3.74).18 Consequently, we investigated a declining period effect, a rising period effect, along with a stable one. This provides for a range of estimates, a strategy endorsed by Elvik.15
It would be desirable to also use registered motorcycles as a proxy for exposure. Unfortunately, this is not possible since individual registration files do not have a road user's age linked to them.
In conclusion, we have demonstrated that trends in motorcycle casualties have been influenced by significant independent age, period and cohort effects. These need to be considered in forecasting future casualties. The selection of the period effect has a significant effect on the estimates. While the difference between the lower and upper estimate produced here is substantial, the upper limit of the range is considerably lower than that produced by simple extrapolation. Which period effect scenario one chooses to accept depends on one's views about a wide range of factors which might influence motorcycle use and the risk of crash. APC modelling is rarely used in injury epidemiology, despite the fact that there are many events which lend themselves to this approach (eg, sports and work injury). This investigation provides potential users of this approach with an insight into its strengths and weaknesses.
What is already known on the subject
-
There is limited understanding of the independent impact on motorcycle injury crashes of age, cohort and period effects.
What this study adds
-
This study shows that age, period and cohort all have significant independent effects. The selection of the period effect has a significant effect on forecasting. Simple extrapolation produces higher estimates than modelling which considers these three factors.
Acknowledgments
The authors wish to thank Hank Weiss, Gabrielle Davie and Shanthi Ameratunga for helpful comments on an earlier version of this paper.
References
Footnotes
-
Funding This research was funded by the University of Otago.
-
Competing interests None.
-
Provenance and peer review Not commissioned; externally peer reviewed.
-
Data sharing statement The data used in this study was sourced from the NZ Ministry of Health. Others who wish to source this information should contact the Ministry of Health.