Article Text

Abstract
Objective To determine whether pedestrian countdown signals (PCS) reduce pedestrian–motor vehicle collisions in the city of Toronto, Canada.
Methods A quasi-experimental study design was used to evaluate the effect of PCS on the number of pedestrian–motor vehicle collisions in the city of Toronto, from January 2000 to December 2009. Each intersection acted as its own control. We compared the number of pedestrian–motor vehicle collisions per intersection-month before and after the intervention. Stratified models were used to evaluate effect modification by pedestrian age, injury severity and location (urban vs inner suburbs). Poisson regression analysis with repeated measures (generalised estimating equations) was used to estimate the RR and 95% CI.
Results The analysis included 9262 pedestrian–motor vehicle collisions at 1965 intersections. The RR of collisions after PCS installation was 1.014 (95% CI 0.958 to 1.073), indicating no statistically significant effect of PCS on collisions. There was no evidence to suggest effect modification between PCS and collisions by age, injury severity or location.
Conclusion The installation of PCS at 1965 signalised intersections in Toronto did not reduce the number of pedestrian–motor vehicle collisions at these intersections.
- Accidents
- bicycle
- Canada
- child
- database
- epidemiology
- evaluation
- MVTC
- occupational
- pedestrians
- playground
- public health
- restraint
- safety
- surveillance
- traffic/prevention and control
- training
This is an open-access article distributed under the terms of the Creative Commons Attribution Non-commercial License, which permits use, distribution, and reproduction in any medium, provided the original work is properly cited, the use is non commercial and is otherwise in compliance with the license. See: http://creativecommons.org/licenses/by-nc/2.0/ and http://creativecommons.org/licenses/by-nc/2.0/legalcode.
Statistics from Altmetric.com
- Accidents
- bicycle
- Canada
- child
- database
- epidemiology
- evaluation
- MVTC
- occupational
- pedestrians
- playground
- public health
- restraint
- safety
- surveillance
- traffic/prevention and control
- training
Road traffic injuries are a major public health concern, and account for approximately 1.2 million deaths worldwide.1 Pedestrian–motor vehicle collision injuries and fatalities disproportionately affect the young (0–14 years of age) and elderly (over 65 years of age).2 Pedestrian countdown signals (PCS) are a relatively new intervention designed to provide pedestrians with a numerical display indicating the number of seconds remaining to cross a street. Hypothetically, this information should enable better decision making and safer road crossing behaviour for pedestrians. In other words, PCS may represent a cost-effective modification to the built environment to create pedestrian-friendly spaces. Proposed alternatives, such as healthy community design and engineering countermeasures designed to separate pedestrians from motor vehicles, reduce speed and increase visibility, may be costly and time consuming to implement.3–9 The city of Toronto, Canada, installed PCS at all intersections in the city over the time period of November 2006 to January 2011. The installation of PCS in Toronto therefore created a unique opportunity for a ‘natural experiment’ to evaluate PCS effectiveness.
Several studies have examined the effect of PCS on driver behaviour10–16 and pedestrian attitudes and behaviour.10–13 ,17 ,18 Only three studies have included collision data, with mixed findings.10 ,11 ,19 Botha et al10 reported no PCS effect; however, their study was limited to a small number of intersections, few collisions and a short observation period. Markowitz et al11 reported a 52% reduction in the number of pedestrian collisions post-PCS; however, they also noted a similar decline in pedestrian collisions at ‘control’ intersections. Pulugurtha et al19 reported a significant decline in the mean number of collisions (car and pedestrian) post-PCS, with the largest benefits noted at high crash and high volume intersections.
This study examined the frequency of pedestrian–motor vehicles collisions before and after the installation of PCS in the city of Toronto, over a 10-year period. The main objective was to determine whether PCS were associated with a reduction in pedestrian–motor vehicle collisions.
Methods
The study took place in the city of Toronto, Canada. The city of Toronto is Canada's largest city, with a population of 2 503 281.20 The city of Toronto was formed in 1998 through an amalgamation of metropolitan Toronto and six municipalities that collectively represent the inner suburban part of a much larger urbanised region called the greater Toronto area.21
A quasi-experimental study design was used. The study design included a one-group (internal) comparison in which each intersection acted as its own control through comparison of the number of pedestrian–motor vehicle collisions (per intersection-month) before and after PCS installation. Ethics approval for the study was provided by the ethics review board of the Hospital for Sick Children.
PCS installation occurred citywide. Intersections with controlled traffic signals where PCS were introduced during the study period (January 2000 to December 2009) were eligible for inclusion. Intersections were excluded from the analysis if there was less than 6 months between the installation of a traditional traffic signal (controlled traffic signal with a walk phase, flashing don't walk phase and a solid don't walk phase) and installation of a PCS. This exclusion reduced the likelihood of measuring novel effects associated with the installation of a traffic signal. Exposure time was calculated using the number of months each intersection contributed to the study period before and after the installation of PCS.
The outcome of interest was the frequency of reported pedestrian–motor vehicle collisions between January 2000 and December 2009. Data were extracted from motor vehicle collision reports filed by the Toronto police service and were obtained from the city of Toronto, Transportation Services Division. Pedestrian–motor vehicle collision records were excluded from the analysis if: (1) the location code (eg, intersection/mid-block) was missing; (2) the collision occurred on private property or in a parking lot; (3) the collision occurred before a traditional signal was installed at the respective intersection; (4) the collision occurred outside a 30-m radius of the intersection where a PCS was installed; (5) the collision occurred on the same day the PCS was installed; and (6) the collision occurred at an intersection where there was less than 6 months between the installation of a traditional traffic signal and the installation of a PCS.
Age was included as a potential effect modifier to determine if PCS were equally effective for all pedestrians. The following age classes were used to conduct stratified analysis: 0–15, 16–59 and over 60 years.22 Records with missing data for age were excluded from the age-stratified analysis.
Injury severity was also gathered. Toronto police services categorise injuries sustained from a collision into five types: no injury; minimal (no medical attention required); minor (emergency department treatment only); major (hospital admission required); and fatal. Previous research has reported police misclassification of injury is most likely to be associated with minor injury.23–25 In this study, minimal and minor injury categories were combined.
Location was included to determine effectiveness by region. Census geography from 1996 was used to geocode collisions as occurring in either the urban or inner suburban parts of what is now the city of Toronto. This stratification acknowledges differences in urban design across strata. The inner suburbs are a more recently constructed part of the city region, where auto mode share for work and other activities is typically higher than elsewhere in Toronto.26
Collisions and intersections with PCS were mapped onto the city of Toronto centerline shapefile using latitude and longitude coordinates using ArcGIS, ArcMap version 10. ArcGIS was used to create a PCS intersection dataset and to attach collision data to the set of intersections where PCS installation occurred.
All statistical analyses were conducted using SAS software, version 9.1. Crude incidence rates per 1000 intersection-months were calculated for all collisions and by strata, pre and post-PCS installation. Poisson regression analysis with repeated measures (generalised estimating equations) was used to estimate the RR and 95% CI of collisions adjusted for clustering, as predicted by PCS status (pre-PCS/post-PCS). To look for effect modification, separate models were fit for total, each age group (0–15, 16–59 and over 60 years), each injury severity classification (no injury, minor/minimal, major and fatal) and each location (pre-amalgamated Toronto and inner suburbs). In all models, the pre-PCS installation time period was specified as the reference group. PCS, as a predictor of collision counts, was considered statistically significant at p≤0.05.
Results
Intersections with PCS
From 20 November 2006 to 31 December 2009, 2078 PCS were installed. Intersections where there was less than 6 months between the installation of a traditional traffic signal and the installation of a PCS (n=113) were excluded from the analysis. A total of 1965 intersections were included in the analysis.
Pedestrian–motor vehicle collisions
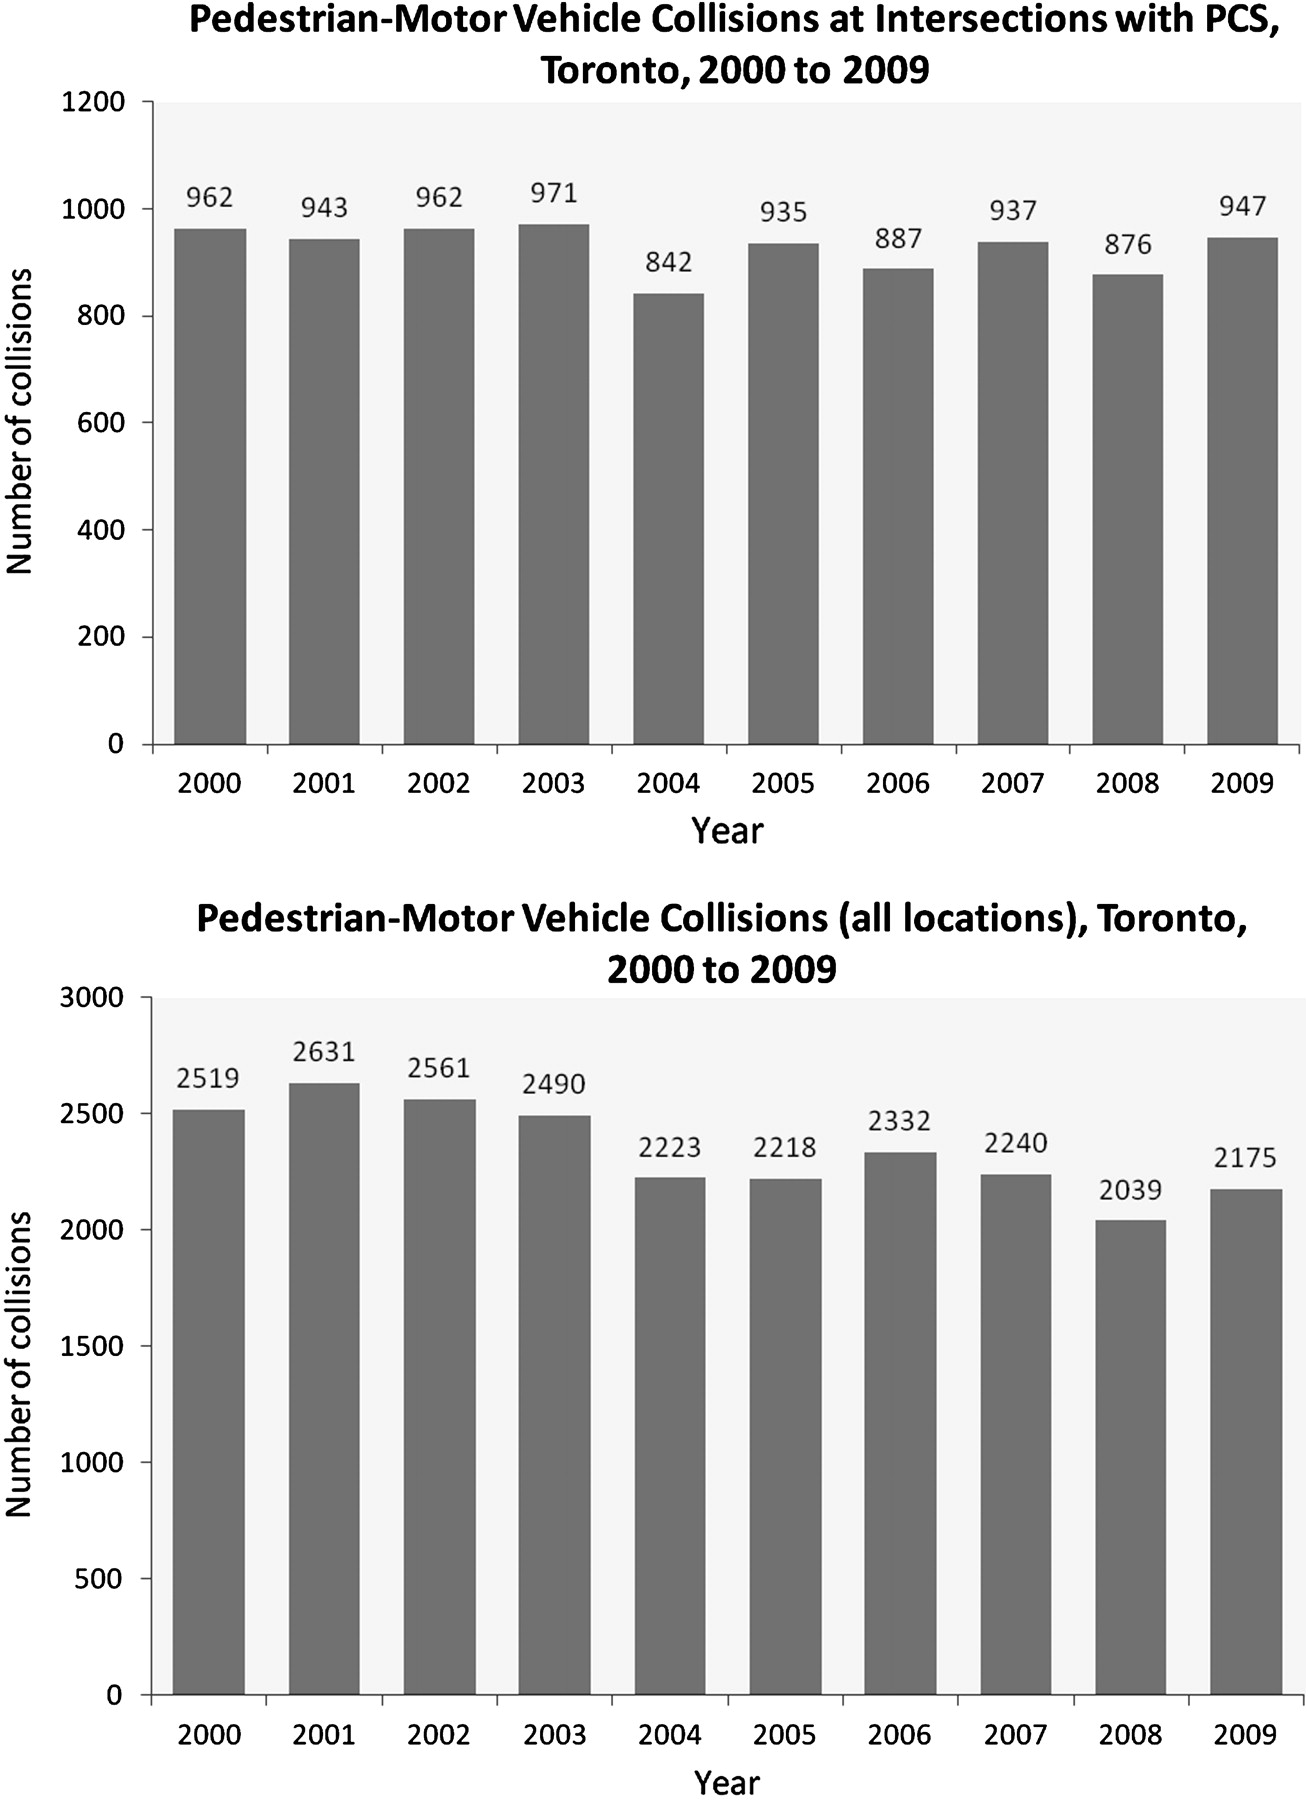
From 1 January 2000 to 31 December 2009, there were 23 428 pedestrian–motor vehicle collisions in Toronto. Collision records missing data for location (n=2984), and collisions that occurred in a parking lot or on private property (n=289), outside a 30-m radius from an intersection where a PCS was (eventually) installed (n=10 486), before the installation of a traditional traffic signal (n=385), on the same day as the PCS installation (n=3) and at intersections where there was less than 6 months between the installation of a traditional traffic signal and the installation of a PCS (n=19) were excluded, producing a final sample of 9262 collisions. Table 1 provides a breakdown of collisions by age, injury severity and location. There were 226 records with missing data for age; these were excluded from the age-stratified analysis. The number of collisions per year was plotted and no significant secular trend could be identified, either in collisions occurring at intersections with PCS, or in total pedestrian–motor vehicle collisions (figure 1).
PCS analysis of pedestrian–motor vehicle collisions, Toronto, Canada, 2000–9

Number of pedestrian–motor vehicle collisions by year, Toronto, 2000–9. PCS, pedestrian countdown signals.
Crude incidence and RR
Overall, the crude incidence rates (per 1000 intersection-months) remained fairly stable pre and post-PCS installation, 40.73 and 41.30, respectively (table 1). When modelled, a RR of 1.014 (95% CI 0.958 to 1.073) indicated no significant relationship between PCS and collisions, after adjusting for clustering.
The stratified analysis by age revealed that the majority of the collisions (n=6482, 72%) occurred among adults 16–59 years of age. Pre and post-crude incidence rates (per 1000 intersection-months) were similar for this age group, 28.30 and 29.79, respectively. When modelled, the RR (RR 1.038, 95% CI 0.972 to 1.108) revealed no effect of PCS on collisions among this age group. Among the most vulnerable road users, children (0–15 years of age) and older people (over 60 years of age), there was a slight decrease in crude incidence rates; however, the RR for children (0–15: RR 0.941, 95% CI 0.792 to 1.119) and older people (over 60 years: RR 0.967, 95% CI 0.844 to 1.108) indicated no significant effect of PCS on collisions.
The majority of collisions resulted in minor/minimal injury (n=7949, 86%). Crude incidence rates remained similar among the pre and post-PCS periods for all types of injury severity. When modelled, no significant effect of PCS was seen on collisions of differing severity (no injury: RR 0.838, 95% CI 0.626 to 1.121; minor/minimal: RR 1.026, 95% CI 0.965 to 1.090; major: RR 0.984, 95% CI 0.826 to 1.173; fatal: RR 0.968, 95% CI 0.594 to 1.578).
The crude incidence rates by location revealed higher rates of collisions per intersection in pre-amalgamated Toronto compared with the inner suburbs for both time periods; however, when modelled, there was no effect of PCS on either location (Toronto: RR 0.943, 95% CI 0.866 to 1.027; inner suburbs: RR 1.042, 95% CI 0.967 to 1.122).
Discussion
This study found no difference in pedestrian–motor vehicle collision rates before and after the installation of PCS. Rates were also similar pre and post-PCS installation when collisions were stratified by age, injury severity and location.
Similar to Pulugurtha et al,19 this study was restricted to collisions that occurred at signalised intersections where a PCS was eventually installed. Therefore, a reasonable explanation for the findings is that while controlled traffic signals in general (regardless of the signal head) are highly effective in reducing the number of pedestrian–motor vehicle collisions,27 the addition of a PCS does not change the overall impact.
This study also found no negative impact of PCS on collision counts, which is similar to the findings of Botha et al.10 Where the work of Botha et al10 was limited by a small sample size, low statistical power and a short post-PCS installation period, the sample size of this study addressed these concerns.
The results reported contrast with findings from the work of Markowitz et al.11 Markowitz et al11 reported a 52% reduction in collisions post-PCS installation; however, this finding was based on the analysis of nine high collision intersections; effect size may have been partly due to regression to the mean. Collision history was not a factor in the present study; in fact, some of the intersections included did not experience collisions during the study period. Pulugurtha et al19 found PCS are most effective at high crash and high volume intersections. This may explain the differences in the effect size of PCS between studies. While PCS appears to have no impact overall in the city of Toronto, it is possible that the effect of PCS is different in some places than in others.
Elements of the built environment are important to consider when analysing the effectiveness of PCS. Location was included in this analysis to understand the impact of PCS by urban design. Many aspects of urban design affect pedestrian safety, notably vehicle speed, which is further determined by driver behaviour. Higher vehicle speeds are associated with an increased risk of pedestrian–motor vehicle collisions and the severity of pedestrian injury.28–31 An 80% risk of pedestrian death has been estimated when a vehicle is travelling at 50 km/h.28 While it was not possible to include reliable data on vehicle speed in this analysis, we can comment on road density by type within each location. Posted road speed and vehicle volumes increase up the road type hierarchy, from local roads to expressways.32
We divided Toronto into two locations: pre-amalgamated Toronto and the inner suburbs. Pre-amalgamated Toronto includes the commercial downtown as well as higher density residential neighbourhoods and pre-second world war traditional neighbourhoods, whereas the inner suburbs include mainly lower residential and commercial densities. Neighbourhoods in the inner suburbs are closer in design to the post-war, car-oriented suburban aesthetic; however, there are some high density residential neighbourhoods. Differences between locations were noteworthy for two road types.
Collector roads are designed to provide access to property and move traffic (2500 to 8000 vehicles per day), have posted speed limits of 40–50 km/h (40 km/h is more common in inner suburbs)33 and pavements on both sides of the road.32 The most notable difference in road density by type is for collector roads; 34.55 km/100 000 population in the inner suburbs compared with 19.82 km/100 000 population in pre-amalgamated Toronto.
Major arterial roads are primarily designed for traffic movement (>20 000 vehicles per day), have posted speed limits of 50–60 km/h and pavements on both sides of the road (sidewalks).32 There are slightly more major arterial roads in the inner suburbs compared with pre-amalgamated Toronto; 29.56 km/100 000 population versus 24.28 km/100 000 population, respectively. Pedestrians in the pre-amalgamated (downtown) region were exposed to a different built environment compared with pedestrians in the suburbs. Without detailed area-wide measures of walking we cannot comment on exposure per se, but differences in road design, control and potentially driver behaviour indicate that both PCS and other interventions could work differently here compared with the inner suburbs. Although PCS was not an effective intervention in either location, it is likely that any combined intervention (including PCS) will be different in different traffic environments.
This study has several limitations. It is an exploratory research study on the relationship between PCS and collisions in Toronto. A parsimonious approach was taken to develop a model to understand the RR between PCS and collisions. These models do not adjust for potential confounders, such as changes in pedestrian exposure. The use of collision rates per intersection-month did not account for population differences between the urban and inner suburban areas of the city of Toronto.
This study was not able to account for exposure measures related to pedestrian and vehicle volumes. A strength of the study conducted by Pulugurtha et al19 was the inclusion of vehicle volume data. These data would have been useful to understand secular trends associated with walking and driving behaviours or practices, but were not available in sufficient detail for our analysis.
Data quality concerns have been documented for police reported collision data.23 ,24 ,34 ,35 Motor vehicle collision reports are completed when there is an injury; therefore, it is likely that collisions between pedestrians and motor vehicles not involving injury are underrepresented in the data.35 In addition, this data source is limited to collisions reported to the police. Previous studies conducted in the USA have estimated that police reported motor vehicle collision data underestimate the number of injured pedestrians involved in motor vehicle collisions by approximately 21%.23 This number remains similar among paediatric populations in the USA (under 15 years of age), where it is estimated that pedestrian–motor vehicle collisions are underreported by 20%.25
Behavioural aspects, including changes in pedestrian and driver actions and conditions, could not be captured by collision data. This means the frequency of ‘near misses’ was not measured in this analysis. Observational studies examining behavioural changes in response to PCS are important to provide insight into how PCS are being used in the road traffic environment, and how to make changes to improve PCS as an intervention. The city of Toronto transportation services are currently conducting an observational study of pedestrian behaviour pre and post-PCS installation.
The results are based on controlled intersections where a PCS was installed over the study period, and does not examine collisions that occurred at adjacent, uncontrolled, unchanged intersections or road segments in Toronto. To understand fully the public health impact of PCS as a modification to the built environment, all collisions in Toronto would need to be analysed.
Study strengths included the use of population-based data on collisions. Outcome measure data over a 10-year period provided adequate statistical power and permitted stratified analyses. The use of secondary data, collected independently of the intervention, prevented bias that may have influenced previous observational studies through observer effects and a lack of blinding. The intersections included in the analysis comprised 95% of the total eligible intersections, and are representative of Toronto. The repeated measures design and one-group comparison provided control over extraneous variables associated with the geographical location of the intersection, including factors such as posted road speed, land use mix, road type and other unknown confounders.
Conclusion
The installation of PCS at 1965 signalised intersections in Toronto did not reduce the frequency of pedestrian–motor vehicle collisions at these intersections.
Implications
Reducing pedestrian–motor vehicle collisions at intersections requires more than simply installing PCS. Other changes to lights or their use might have safety benefits, for example, increasing walking times, prohibiting drivers from turning on red lights or allowing ‘pedestrian scrum’ crossings in all directions with no cars in the intersection.
More fundamental changes to cities, which intentionally build pedestrian safety advantages into the environment, might increase both the popularity and safety of walking. PCS may be an important component of future strategies to make pedestrians safer in cities, but the Toronto experience does not suggest that widespread installation of PCS alone will have important benefits for pedestrian safety. Future evaluations of PCS should incorporate elements of the built environment into their analysis.
What is already known on the subject
Few studies have examined the relationship between PCS and pedestrian–motor vehicle collisions.
Previous research has produced mixed findings regarding the effectiveness of PCS on pedestrian safety.
What this study adds
This is the first population-based study to describe the effectiveness of PCS at reducing pedestrian–motor vehicle collisions, over a 10-year period.
This study provides evidence that the installation of PCS in Toronto, Canada, was not associated with a reduction in pedestrian–motor vehicle collisions.
Public health interventions designed to create pedestrian-friendly cities should include additional components, as PCS alone are not likely to have important safety benefits.
Acknowledgments
The authors would like to thank Michael P Brady (city of Toronto) for providing the data, in addition to his assistance.
References
Footnotes
Competing interests None.
Ethics approval Ethics approval for the study was provided by the ethics review board of the Hospital for Sick Children.
Provenance and peer review Not commissioned; externally peer reviewed.
Linked Articles
- Correction