Article Text

Abstract
Objective To assess whether traffic-calming features are equitably distributed in the UK.
Design Cross-sectional database utilising geographical information system (GIS) and population data.
Setting Four large regions in England and Wales, including areas in south Wales, south-west England, east Midlands and Surrey, for which map data were available.
Main outcome measures The total proportion of road segments traffic calmed and the likelihood of road segments being traffic calmed by deprivation fifth.
Results A total of 3.7% of road segments was traffic calmed on 95 791 km of road length. A higher proportion of traffic-calmed road segments was found in deprived areas when population density was taken into account. The odds of traffic calming in the most deprived areas, compared with the most affluent areas, was 2.83 (95% CI 2.815 to 2.835).
Conclusions High resolution map data can be manipulated within a GIS to enable the distribution of traffic-calming measures to be assessed over large areas. There are very few traffic-calmed roads in any area and there is scope for more. Deprived areas have substantially more traffic calming. Making such data available to the public should be tested as an advocacy tool to increase the provision of traffic-calming features.
- Geographical information systems
- health inequality
- pedestrian safety
- traffic calming
Statistics from Altmetric.com
Globally, road traffic injuries kill approximately 1.3 million and injure 50 million people each year, and are the leading or second leading cause of death in children and young people aged 5–19 years.1 Children and older people tend to be at particular risk as pedestrians.2 Whereas the highest mortality rates occur in developing countries, the situation in many wealthy nations, although improving, is still a major public health issue.3 In the UK, child pedestrian mortality and injury rates remain a cause for concern, particularly compared with the low injury rates that exist for other road users.4 Based on 2006 data, the UK had the seventh lowest road death rate among 30 countries but was ranked 12th lowest of 18 European countries in terms of child pedestrian deaths.5
Analysis of the factors underlying international variation in child road traffic mortality rates has suggested that countries with the lowest child casualty rates tend to have more speed-reduction measures, crossings controlled by signals and outside play areas.6 Traffic calming is an important speed-reduction measure. It forms a physical barrier to inappropriate speed, forcing drivers to change their behaviour. Logically, therefore, it should reduce injury risk. Most, but not all, studies of traffic calming have reported an impact on injury risk; however, few used high-quality research designs as part of their research. Child pedestrian injuries were found to decrease by 70% in 200 small areas that had been traffic calmed and injuries decreased 15% in Denmark following the installation of road engineering.7–9 A meta-analysis by Elvik10 found that, on average, area-wide traffic management, which included traffic calming, reduced injury collisions by 15%, with larger reductions of up to 25% on residential streets. Mountain et al11 found that road engineering contributed to significant decreases in the number of total injuries (40% decrease) and fatal and serious injuries (43% decrease) in a study of UK speed management schemes, with the biggest effects being on child pedestrian injuries (62% decrease, 95% CI 43% to 75%). In addition, an analysis of vertical deflectors only (speed humps), adjusted to estimate the effect caused only by traffic calming, found that these were associated with a 44% decrease in personal injury collisions and a 35% decrease in fatal and serious injuries. However, the use of traffic-calming measures can be controversial, with reports of problems for emergency services, public transport and complaints of excess noise.12–14
Child pedestrian injuries are strongly related to socioeconomic position, with significantly higher rates found in more deprived areas. Children living in the most deprived areas are three to eight times more likely to be injured as pedestrians than those living in more affluent areas.2 3 15–17
Inequalities in injury are the product of complex social, economic and cultural factors.18 Researchers use exposure-based fatality rates for children in which average kilometres travelled on foot for each age group are used as the denominator.19 However, this does not take into account the variety of local environmental characteristics affecting pedestrian casualties that can be used to influence pedestrian facilities and traffic-calming measure locations.20 The application of complex models determining injury rates highlights the challenges within injury rate methodology, including determining pedestrian exposure to traffic.21 We do not propose to measure pedestrian exposure or model injury rates here. Instead, we simply describe the pattern of traffic-calming features in relation to socioeconomic inequalities, one of many potential determinants of injury rates.
Given the high rate of overall pedestrian injuries and the scale of health inequalities in the UK it is important to look at causal factors in greater depth and to determine whether traffic calming is equitably distributed or follows the usual pattern of the inverse care law, whereby those at least risk in society are afforded the greatest protection.22 In contrast to studies describing the distribution of injuries, there are few studies focussing on the distribution of protective interventions. A previous study of the distribution of traffic calming across two cities in the UK, following the introduction of the Traffic Calming Act in 1993, showed that one of the cities had traffic calming strongly concentrated in deprived areas.23 24 The distribution of traffic calming between the two cities seemed to be influenced by both the historical level of injurious motor vehicle collisions and influential local politicians.25 However, that study was limited to just two urban areas because it relied upon data collected manually during a systematic field survey, using hand-held global positioning system technology.
The development of geographical information systems (GIS), more powerful computers and high-resolution map data has made it possible to study the distribution of geographically distributed facilities across very large areas. This study aimed to describe the distribution of traffic calming across regions of England and Wales, using GIS, and to determine whether the distribution varies by deprivation across small areas.
Methods
Digital road and traffic calming information in England and Wales is captured on the Ordnance Survey's MasterMap integrated transport network (ITN) layer.26 This is a digital dataset of the road network for Great Britain. Linked to the spatial data are tables containing information, including height restrictions, traffic calming and one-way roads. Traffic calming is defined as all speed humps (round or flat top), raised junctions and sections of road and speed cushions. The ITN layer also contains information on road segments across the UK, including 12-digit geo-references for junctions at the beginning and end of each segment.
The ITN files were obtained for substantial areas of England and Wales, including south Wales, south-west England, and parts of the east Midlands and Surrey, for analyses of traffic calming related to the Advocacy in Action cluster randomised trial.27 All road segments containing the label ‘traffic calming’ were identified within ArcMap28 for each small area. Analysis of traffic-calming distribution was carried out at the road segment level with the latest updates received in 2007.
Lower super output areas (LSOA) are the smallest geographical boundary areas developed for use in small area analysis in the UK and have an average population of 1500.29 LSOA are a consistent size and dimension and, unlike electoral divisions, are not subject to boundary changes. Electoral divisions are the geographical units used previously in these types of analyses. There is a total of 34 378 LSOA in England and Wales (32 482 in England, 1896 in Wales). Road segments were mapped to LSOA using the ITN files available to us, with 6647 LSOA within four separate areas being covered. All LSOA within the four areas were contiguous.
The total length of road was calculated for each LSOA along with the total length of traffic-calmed road segments. The percentage of total road length traffic calmed per LSOA was calculated. Population data from the 2001 census were obtained from the Office for National Statistics for each LSOA allowing population density to be calculated per LSOA.30 The Townsend index, derived from the 2001 census at LSOA level for England and Wales, was used as an area measure of deprivation. The Townsend deprivation index is widely used in health research, particularly in academic research and is considered to be valid and reliable.31–33 LSOA were divided into five groups of equal numbers based on the Townsend index score, and will be referred to as deprivation fifths.
Summary statistics of the distribution of traffic calming by deprivation fifth were calculated. The likelihood of traffic calming per road segment was compared by deprivation fifth, adjusting for population density using weighted logistic regression in the statistical package R.34 35 Total road lengths were used to weight the traffic-calming lengths for each LSOA. Predicted probabilities were calculated and included as part of the results because these are often more easily understood than odds ratios. Represented as percentages, they are simply the sum of the likelihood of the event happening over the corresponding inverse; the likelihood of the event not happening (that is probability/1−probability).
Results
This study analysed 124 249 road segments in 6647 LSOA, which amounted to 95 791 km of road, of which 3525 km comprised segments that were traffic calmed (3.7%). Table 1 shows the summary descriptive analyses by deprivation fifth. The mean proportion of roads traffic calmed within each LSOA was 6.6%, but across all LSOA the proportion of traffic-calmed road ranged from 0% to 98.1%. The data demonstrated considerable positive skewness. Several transformations were attempted but the transformed data remained skewed. Variations by deprivation fifth were substantial. The most affluent fifth had both the lowest median traffic-calmed roads by LSOA (1.0%) and the narrowest range of road calmed across all LSOA in the fifth category (69.0%). In contrast, the most deprived fifth had a median proportion of roads traffic calmed by LSOA of 8.4% and a range of 95.1%. Aggregating the data across all LSOA in a fifth showed a sixfold difference between the most affluent and deprived fifths (2.4%, 12.2%).
Summary statistics by deprivation fifth
Road segment lengths varied slightly between deprivation fifths, with median lengths of 59.1 m and 54.9 m in the most and least affluent fifths (Kruskal–Wallis test, χ2=174.8, 4 df, p<0.001). For all LSOA in this study, there was a mean population of 1507 people per LSOA, with a minimum of 1004 and a maximum of 4497 people per LSOA. The percentage of traffic calming per road segment was correlated with population density (Spearman's r=0.23, p<0.001) and population density increased with deprivation (Kruskal–Wallis test, χ2=895.1, 4 df, p<0.001).
Due to the highly skewed data and potential confounding by population density logistic regression was carried out to determine whether the presence of traffic calming in road segments was influenced by deprivation, adjusting for population density. Table 2 shows the results of the logistic regression analysis (Hosmer–Lemeshow goodness of fit test; p=0.09). Townsend fifth category and population density were both significant independent predictors of traffic calming. The odds of a traffic-calmed road segment was 12% lower in the next affluent compared with the most affluent. Traffic calming was most prevalent in the most deprived fifth, with 2.8 times the amount of traffic calming compared with that in the most affluent. In addition, for each increase of 10 people per hectare, the odds of traffic calming increased by a factor of 1.22.
Logistic regression results; with each category of Townsend index compared with the most affluent fifth
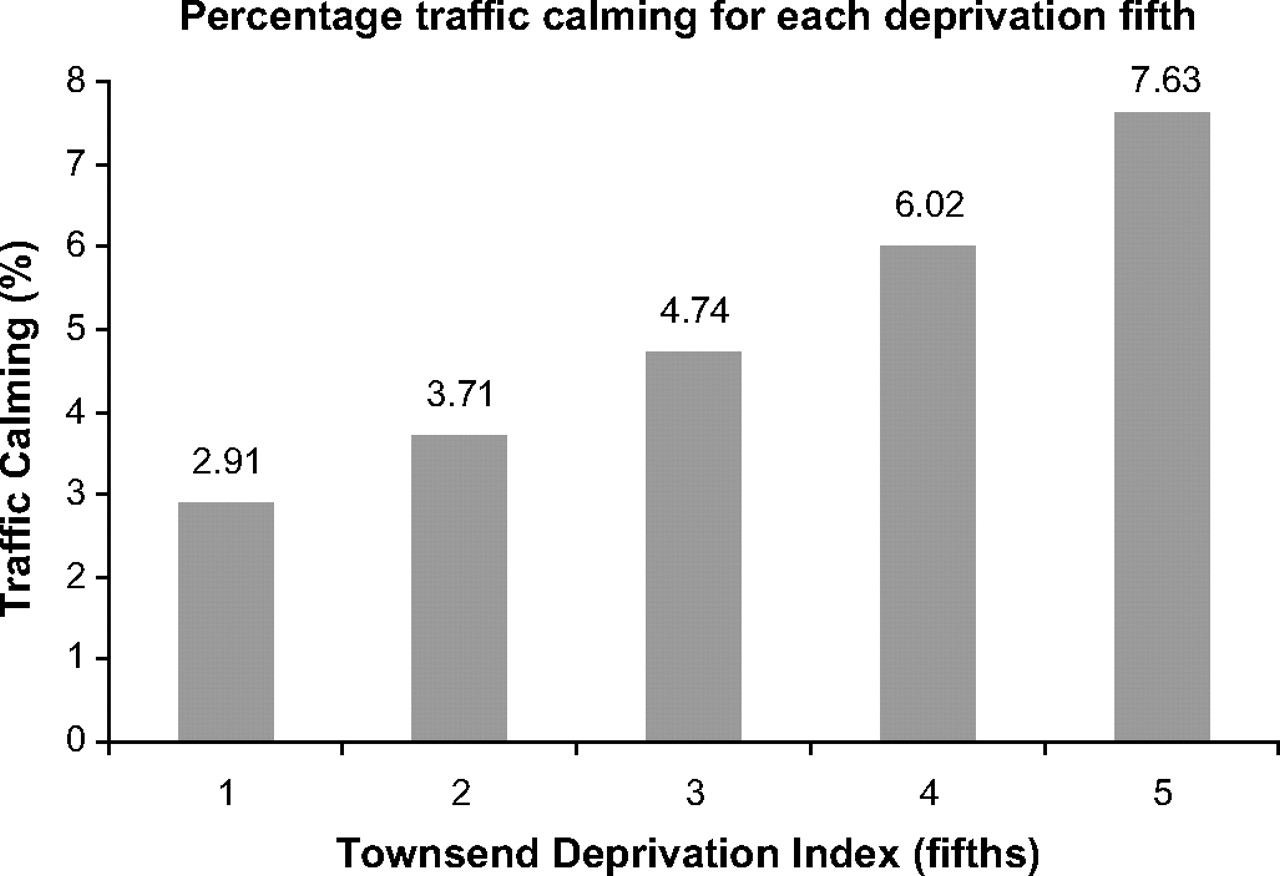
These findings can also be interpreted using predicted probabilities derived by holding the population per hectare constant at the mean (33.3 people per hectare). With population density held constant, the probability is that 2.91% of roads in the most affluent areas would be traffic calmed, compared with 7.63% of roads in the most deprived areas (figure 1).

Percentage traffic calming for each deprivation fifth.
Discussion
The results of this study show that traffic-calming distribution heavily favours the most deprived areas. This is a positive finding because it indicates that there is a degree of social equity in traffic calming, given the overwhelming evidence of substantially higher pedestrian injuries among deprived groups.2 3 15–17 In recent years there has been a narrowing of the inequality gap in child pedestrian injuries in the UK.36 It is not possible with this cross-sectional research design to attribute a particular reduction of pedestrian injury inequality to the distribution of traffic calming. Other factors may also be involved, such as changes in modal transport, for example, reduced walking activity, and any other factor that reduces traffic speed. Nevertheless, given that empirical evidence suggests traffic calming is effective in curtailing the frequency and severity of road collisions, some reduction in injuries will have occurred in deprived areas.7–11 There are very few examples of health factors that run contrary to the inverse care law, and it is pleasing to see a population-based public health intervention that bucks the trend.22
It has been commented recently that the scope for making improvements in road safety using road engineering is reducing because they are believed to be at saturation, and that there should be a greater shift towards enforcement and education.36 However, our analyses suggest that there is still considerable potential for traffic-calming use in all areas; both affluent and deprived. The ranges of percentage traffic calming indicate that some LSOA are very heavily traffic calmed, but the overall figures of 3.7% and 12.2% in the most deprived areas, suggest that even in these areas, there is still relatively little traffic calming. Obviously, 100% coverage is impractical because speed humps are only suited to certain types of road, but the Audit Commission suggestion that there is little further scope for engineering is not supported by our findings.37
Although our study has several strengths it also suffers from a few limitations that must be considered when appraising the research findings. One major strength lies in the enormous amount of data collected in a standardised method over large parts of the UK. The study includes some 124 249 road segments amounting to 95 791 km of roads, distributed across 6647 LSOA (19.4% of total in England and Wales). These large numbers ensure that the study had sufficient statistical power to detect important differences. The areas covered were chosen to be within 50 km of the five Advocacies in Action Study centres (Swansea, Cardiff, Bristol, Nottingham and Guildford) rather than representing any particular feature of road safety, and there is no obvious reason why the findings from this study should not be generalisable across England and Wales.27
One weakness of the study is that we were only able to obtain information on vertical traffic calming (speed bumps). Whereas Ordnance Survey's ITN data contain information on vertical traffic calming the equivalent horizontal features, such as chicanes and road narrowings, are not captured. In a previous study covering a smaller area, some of the authors of this investigation carried out a street-by-street audit allowing a broader view of traffic calming to be documented, including narrowings and chicanes as well as road humps.24 However, it is not logistically possible to carry out such audits on nearly 100 000 km of road, as would have been the case had this methodology been adopted as part of this current study. Nevertheless, in the previous study, carried out in 2002, vertical calming was much more prevalent than horizontal calming. Given that we have not included horizontal calming measures, our results underestimate the full extent of traffic calming present in the areas studied. However, the size of any bias is probably small and there is unlikely to be significant variation in the method used by deprivation fifth (review of data from the study by Jones et al24 suggested that the proportions of vertical and horizontal deflectors were similar within each fifth). Our findings on the relative distribution of traffic calming by deprivation should thus be robust. Furthermore, it has been suggested that vertical deflectors are most effective at reducing speeds and pedestrian casualty rates.38 This study therefore provides a profile of the distribution of the single engineering approach with the greatest potential benefit for child pedestrian casualty prevention.
Another limitation of our method is that the MasterMap ITN layer data record whether there is any or no traffic calming on a road segment rather than displaying each specific feature.26 It is thus possible that a long segment of road may have just one speed hump on it, or three or four. Obviously, the impact on vehicle speeds and therefore collision risk is likely to be very different in these two scenarios. As a consequence, the extent of effective traffic calming within a traffic-calmed segment may be overestimated by our approach and be somewhat lower than the 3.7% of total length that we report here.
Although there is a considerable literature on social inequalities in pedestrian injuries, there is much less on the social distribution of countermeasures.2 3 15–17 24 The mere existence of strategy and policy documents is insufficient to ensure that effective countermeasures are implemented.39 Neither the public nor policy makers have access to information on the distribution of countermeasures. Without such information it is difficult for groups to lobby effectively for further investment in prevention. We consider that there is a need to put such information into the public domain. Analyses such as those that form the basis of this research could be made available to the public. Information could be disseminated through government websites or that of the Injury Observatory for Britain and Ireland website.40 Whether such information leads to subsequent increased investment in preventive countermeasures and further reductions in injury inequalities are testable hypotheses.
Implications for prevention
This research study indicates that it is possible to use high-resolution map data within a GIS to measure and monitor the equitable distribution of traffic calming. Traffic calming in the UK is distributed in a manner that is likely to be reducing inequalities in child pedestrian injury rates, although the magnitude of this effect cannot be measured without further in-depth studies. There still appear to be very few traffic-calmed roads in most areas of England and Wales, whether deprived or affluent and thus, contrary to the suggestions of the Audit Commission, the scope for the introduction of additional road safety features across the UK continues to exist. Making local traffic-calming data publicly available, allowing it to be tested as an advocacy approach, represents an important recommendation for future research.
What is already known on this subject
Children living in the most deprived areas are more likely to be injured as pedestrians than those living in more affluent areas.
Traffic calming is known to be an effective method of reducing speeds and pedestrian injury.
What this study adds
Traffic-calming features for large areas can be assessed using GIS and Ordnance Survey MasterMap data.
Traffic-calming measures in the UK are distributed according to deprivation. The increased odds of traffic calming in the most deprived area compared with the most affluent area is 2.83 (95% CI 2.815 to 2.835).
Acknowledgments
Integrated Transportation Network data are all courtesy of Ordnance Survey. The authors would like to thank Dr Owen Bodger and Professor Michael Gravenor, both of Swansea University, for statistical advice.
References
Footnotes
Competing interests None.
Provenance and peer review Not commissioned; externally peer reviewed.