Article Text

Abstract
Objective: To estimate the contributions of five risk factors to changes in US traffic crash mortality: (1) alcohol use by drivers and pedestrians, (2) not wearing a seat belt, (3) lack of an air bag, (4) not wearing a motorcycle helmet, and (5) not wearing a bicycle helmet.
Design: Longitudinal study of deaths; attributable deaths were estimated using data from other studies.
Setting: US traffic crashes in 1982–2001.
Subjects: People who died in a crash.
Main outcome measures: Counts of deaths attributed to each risk factor, change in rates of deaths, and counts of lives saved by changes in risk factor prevalence.
Results: There were 858 741 traffic deaths during the 20 year period. Estimated deaths attributed to each factor were: (1) alcohol use, 366 606; (2) not wearing a seat belt, 259 239; (3) lack of an air bag, 31 377; (4) no motorcycle helmet, 12 095; (5) no bicycle helmet, 10 552. Over the 20 years, mortality rates attributed to each risk factor declined: alcohol by 53%; not wearing a seat belt by 49%; lack of an air bag by 17%; no motorcycle helmet by 74%; no bicycle helmet by 39%. There were 153 168 lives saved by decreased drinking and driving, 129 297 by increased use of seat belts, 4305 by increased air bag prevalence, 6475 by increased use of motorcycle helmets, and 239 by increased use of bicycle helmets.
Conclusions: Decreased alcohol use and increased use of seat belts were associated with substantial reductions in crash mortality from 1982 through 2001. Increased presence of air bags, motorcycle helmets, and bicycle helmets were associated with smaller reductions.
- FARS, Fatality Analysis Reporting System
- traffic accidents
- alcohol
- seat belts
- air bags
- helmets
Statistics from Altmetric.com
Traffic crash mortality rates in the United States declined from 26.4 per 100 000 person-years in 1969 to 14.7 in 2003.1,2 At least five factors may have influenced this decline in mortality. Citizen groups that influenced attitudes and laws regarding drunk driving have been credited with part of this decrease.3–6 The first state seat belt law was adopted in 1984;6–8 by 2004, 80% of 52 000 observed front seat motorists were belted.9 By 1994 most new cars had dual air bags and these were required in cars by 1998 and in light trucks by 1999.10 Observed helmet use by motorcyclists was 63% in 1994, rose to 71% in 2000, but declined to 58% by 2002.11 Bicycle helmet use has become more common in some regions.12
We studied US traffic deaths during 1982–2001 to assess the contribution of alcohol use, not wearing a seat belt, lack of an air bag, not wearing a motorcycle helmet, and not wearing a bicycle helmet. We estimated the count and proportion of deaths attributed to each risk factor, the change in prevalence for each factor, and trends in mortality rates for all US traffic crash deaths and for deaths attributed to each of the five risk factors and combinations of these factors.
SUBJECTS AND METHODS
Crash data
Since 1975, the National Highway Traffic Safety Administration has maintained the Fatality Analysis Reporting System (FARS) which has data from all crashes on US public roads with a death within 30 days.1 These are public data and we were exempted from human subjects review.
Study subjects
Subjects were persons in vehicles (cars, trucks of all kinds, minivans, buses, and all others aside from motorcycles), riders on motorcycles, and bicyclists and pedestrians who died in a crash with a motor vehicle. Drivers could be in vehicles or on motorcycles.
Risk factors
Alcohol use by each vehicle driver, motorcycle driver, pedestrian, or bicyclist could influence their risk of a deadly crash. Driver alcohol use could also influence the risk of death for other people in the same crash: passengers in the same vehicle as the driver, people in other vehicles, motorcyclists, pedestrians, and bicyclists. Not wearing a seat belt was considered to be a risk factor only for those who died in a vehicle; motorcyclists, pedestrians, and bicyclists cannot wear seat belts. Lack of an air bag was treated as a risk factor only for front seat occupants of vehicles that customarily have air bags—for example, bus drivers were not considered to be at risk for lack of an air bag. Failure to wear a helmet was treated as a risk factor only for motorcyclists and bicyclists.
Attributable fractions and attributed deaths
We estimated the fraction of each death that could be attributed to each risk factor: the attributable fraction [AF] = (risk ratio − 1)/(risk ratio).13 For occupants of the same vehicle or motorcycle, we assigned each the AF for the driver’s blood alcohol level. When more than one vehicle was involved, all occupants were assigned the two largest AF values for involved drivers: combined AF = 1 − [(1 − AF1) × (1 − AF2)]. For pedestrians and bicyclists we combined their AF and the largest AF of any involved driver. For other risk factors, such as not wearing a seat belt, we used the AF based upon the risk factor status of each dead individual.
The risk ratios for alcohol use (see http://www.injuryprevention.com/supplemental for Appendix 1) were from a case control study (table 6.6 of that report) that used FARS and other data to estimate the association of blood alcohol level with driver involvement in a passenger vehicle crash.14 We assumed that these risk ratios could be applied to motorcycle drivers, pedestrians, and bicyclists. The risk ratios for air bags and seat belts came from a matched cohort study that used FARS data; the risk ratios for these two factors were adjusted for each other and an interaction term between air bags and seat belts was used.15 The estimates for motorcycle helmet use were from a matched cohort study of FARS data.16 The risk ratios for bicycle helmets were from a case control study.17 For estimates that involved more than one of these risk factors, we used the formula described above to combine attributable fractions.
For example, consider a dead, unbelted, 32 year old male car driver with an air bag and a blood alcohol of 0.06. A 27 year old female driver in the same crash had a blood alcohol of 0.08. Using Appendix 1, the risk ratio for the dead driver’s alcohol level was 3.76, the risk ratio for the other driver’s alcohol level was 6.25, and the risk ratio for being unbelted with an air bag was 2.33. Lack of a helmet made no contribution to the death. Therefore, the fraction of this driver’s death attributable to all five risk factors was 1 − [(1 − (3.76−1)/3.76) × (1 − (6.25−1)/6.25) × (1 − (2.33−1)/2.33)] = 0.98.
For each year the count of deaths attributed to each risk factor was obtained by summing the relevant attributable fractions. Other deaths not attributed to each risk factor were estimated by subtracting attributed deaths from all deaths.
Changes in risk factor prevalence
We used linear regression to estimate the mean change over time in risk factor prevalence among the dead in the FARS data.18 Change estimates for air bags were limited to the years 1992–2001, as air bags were rare before 1992. For bicycle helmets we limited change estimates to 1994–2001, as bicycle helmet use was not recorded before 1994 in FARS data; we assumed that no bicycle helmets were used before 1994, as only 2% of dead bicyclists were helmeted in 1994.
Rates, rate changes, and lives saved
To estimate mortality rates (per 100 000 person-years) we used FARS counts of deaths and population estimates from the US Census Bureau.19 We used Poisson regression, with person-years as an offset, to estimate the change in rates over the 20 years.20,21 We estimated rate changes for: (1) deaths attributed to each risk factor, (2) other deaths not attributed to each risk factor, and (3) all deaths, which can be thought of as a weighted average of changes (1) and (2).
For each risk factor, we predicted the count of deaths that would have occurred in each year if the rate change for all deaths had been the same as the change for deaths not attributed to that factor. In each year, the predicted count of deaths minus the observed count of deaths was an estimate of lives saved (if positive) or lost (if negative) by changes in risk factor prevalence over time. We added these count differences over the 20 years, to estimate lives saved or lost due to changes in risk factor prevalence. These estimates were limited to 1992–2001 for air bags and 1994–2001 for bicycle helmets.
Missing data
Data for blood alcohol concentration were missing for 57% of drivers and 48% of pedestrians and bicyclists. Among those who died, seat belt use was missing for 11% of vehicle occupants, helmet use for 10% of motorcyclists and 0.5% of bicyclists, and age for 0.4%.
Information about air bag presence was in FARS data, but it was often missing. We used software to link the partial vehicle identification number to manufacturer supplied information about air bags.22 We assumed the manufacturer’s air bag information was correct, but when it was missing we used information about air bag presence if it was in FARS. After making some assumptions about air bag presence (for example, air bags were not present in buses), air bag presence was missing for 0.2% of vehicle occupants who died.
We used multiple imputation to create 10 sets of data which were identical in regard to known information, but could differ, one from another, on imputed values for missing information.23–28 Details of the imputation process can be found elsewhere.29–31
Confidence intervals for changes
Confidence intervals (CI) were from linear or Poisson regression with a robust (sandwich) variance estimator.32,33 We generated estimates in each imputed data set, combined the 10 estimates by averaging on the appropriate scale, and computed confidence intervals that accounted for the variance within each data set and the variance between the 10 data sets.34
RESULTS
Deaths attributed to the five study risk factors
There were 858 741 traffic deaths (rate 16.75) during the 20 year period. When the five risk factors were considered separately, 43% (366 606) of all crash deaths could be attributed to alcohol (table 1), 30% (259 239) to not wearing a seat belt, 4% (31 377) to lack of an air bag, and 1% each to lack of a motorcycle (12 095) or bicycle (10 552) helmet. Jointly, the five risk factors accounted for 61% (528 105) of the deaths; this proportion is less than the sum of the five individual proportions, because many persons were at risk from more than one factor (further details are in online Appendices 2, 3, and 4; see http://www.injuryprevention.com/supplemental).
Traffic crash deaths attributed to each risk factor, US, 1982–2001
Over the 20 years, 46% of the dead were exposed to at least some alcohol; either they were a driver, pedestrian, or bicyclist with some level of blood alcohol, or their driver or another driver in the crash had some alcohol in their blood. Among dead vehicle occupants 75% wore no seat belt and 88% of front seat occupants had no air bag. Half (51%) of dead motorcyclists and 98% of dead bicyclists were not wearing a helmet.
All risk factors became less common among the dead over time (table 2, fig 1), but this change in prevalence was greatest for lack of an air bag (48% decrease from 1992 to 2001), and least for not wearing a bicycle helmet (4% decrease during 1994 to 2001). Prevalence of exposure to any alcohol fell 20% and not wearing a seat belt declined 39%.
Change in risk factor prevalence: percent of the dead exposed to each of five risk factors.* Estimates for 1982 and 2001 are from a line fitted to the data for all years.†
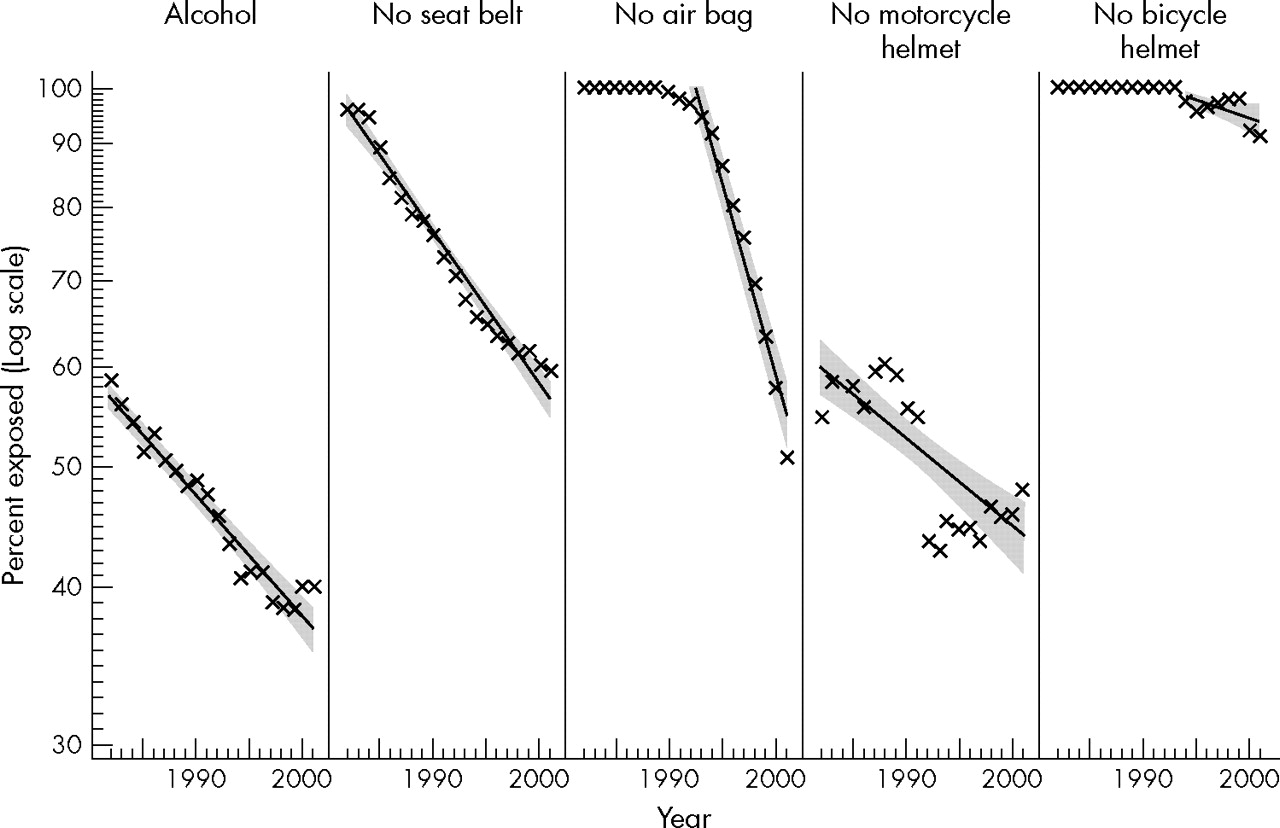
Changes in the prevalence of five risk factors among persons who died in traffic crashes in the US during 1982–2001. Alcohol was defined for this figure as any level of blood alcohol by a driver, pedestrian, or bicyclist in the crash. Trends in proportions are shown with fitted lines.
Changes in death rates over time
Death rates attributed to alcohol decreased 53%, while the rate of other deaths not attributed to alcohol increased 2%, and the rate of all deaths decreased 26% (table 3 and fig 2). Among vehicle occupants, death rates attributed to not wearing a seat belt decreased 49%, while the rate of other deaths increased 20%; in combination these divergent trends produced a 15% decrease in crash death rates for all vehicle occupants.
Rates (per 100 000 person-years) and change in rates, for all deaths, deaths attributed to each risk factor, and other deaths not attributed to each risk factor.*

Trends in death rates. The top line in each panel shows the observed rates (square) and the fitted line for all crash deaths of people potentially exposed to each risk factore. Each panel shows the observed rates (×) and fitted line for deaths attributed to each risk factor and for other deaths not attributed to that factor (triangle). The y axis uses a log scale so that convergence or divergence of changes in rates can be easily judged. Pointwise 95% confidence intervals are shaded.
For vehicle front occupants, death rates attributed to no air bag fell 17%, rates unrelated to an air bag decreased by 17%, and all deaths declined 17% (table 3, fig 2). When we limited the change estimates for air bags to 1992 through 2001, the interval during which air bag prevalence changed substantially, deaths attributed to no air bag changed by −42% (95% CI −51 to −32), other deaths changed by −1% (95% CI −5 to +2), and all front occupant deaths changed by −4% (95% CI −8 to 0).
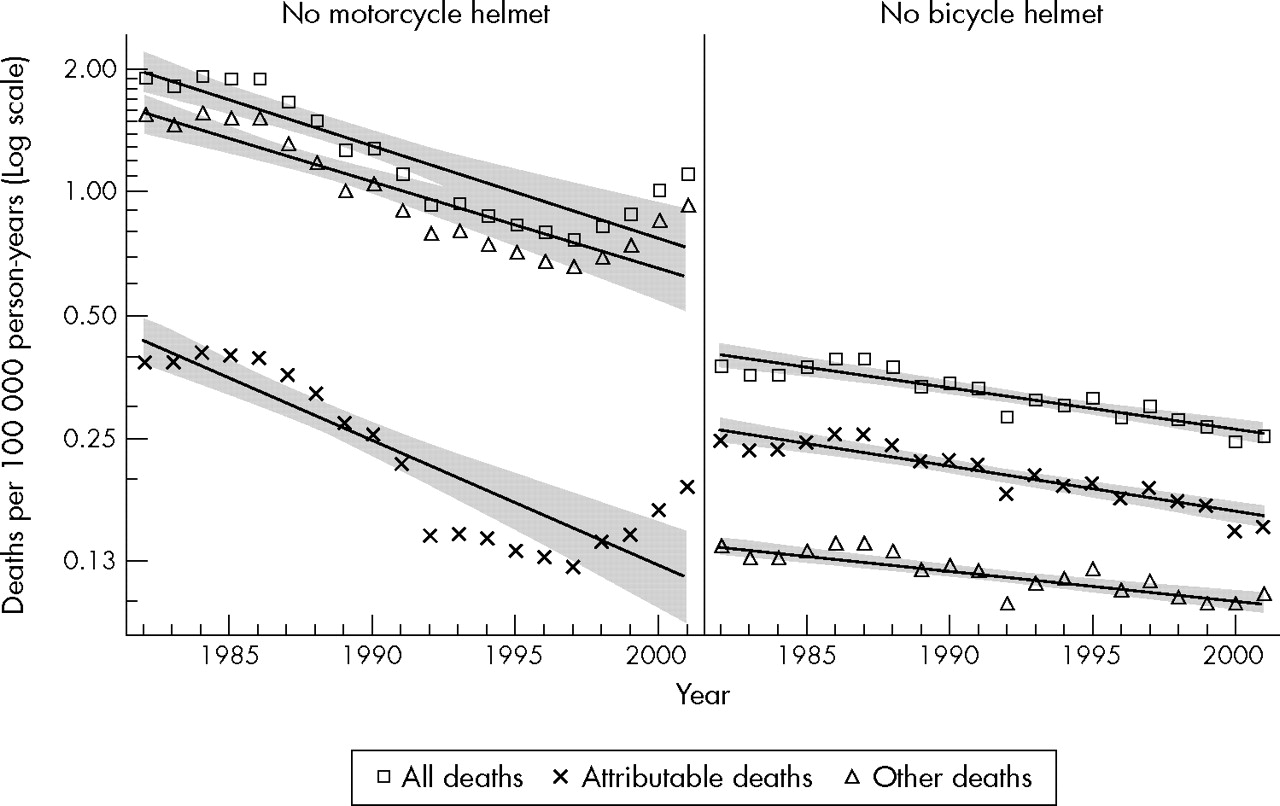
Rates of deaths attributed to not wearing a motorcycle helmet fell 74%, other motorcycle death rates fell 60%, and overall motorcycle death rates declined 63% (table 3, fig 3). Observed rates of motorcycle deaths increased after 1997.
Trends in death rates for motorcycle riders and bicycle riders. The top line in each panel shows the observed rates (square) and the fitted line for all crash deaths of riders. Each panel shows the observed (×) and fitted lines for deaths attributed to each risk factor and for other deaths not attributed to that factor (triangle). The y axis uses a log scale so that convergence or divergence of changes in rates can be easily judged. Pointwise 95% confidence intervals are shaded.
Rates of deaths attributed to not wearing a bicycle helmet decreased 39%, rates of other bicycle deaths fell 28%, and all bicycle death rates decreased 35% (table 3, fig 3). During 1994–2001, the years in which bicycle helmet prevalence changed, the change in attributed deaths was −24% (95% CI −30 to −17), the change in other deaths was −14% (95% CI −22 to −5), and the change in all bicycle deaths was −20% (95% CI −26 to −14).
For all five risk factors combined the rate of attributed deaths fell 48%, the rate of other deaths increased 29%, and the rate of all deaths decreased 26% (table 3).
Prevented deaths
Because changes in attributed death rates were always more favorable than changes in other death rates, the changes in risk factor prevalence resulted in positive estimates of prevented deaths (lives saved): during 1982–2001, 153 168 lives were saved by decreased drinking and driving, 129 297 by increased seat belt use, 4305 by increased air bag prevalence, 6475 by increased use of motorcycle helmets, and 239 by increased use of bicycle helmets. Jointly the favorable trends in all five risk factors prevented 293 898 deaths.
DISCUSSION
Of 858 741 deaths during the 20 years, 43% were attributed solely to alcohol use, 30% to not wearing a seat belt only, 4% to lack of an air bag, and 2.6% to not wearing a motorcycle or bicycle helmet. Jointly the five risk factors accounted for 61% of the deaths. These are estimates of the proportion of deaths that could have been prevented if each of the five study risk factors had been removed independently or all were removed simultaneously.
The interpretation of changes in attributed death rates is more difficult, as changes can occur for reasons unrelated to the studied risk factors; for example, changes in miles driven per person will change attributed death rates even if risk factor prevalence does not change. Therefore changes in attributed rates can be better interpreted in conjunction with information about changes in prevalence and changes in the rate of deaths not attributed to each risk factor.
The prevalence of some exposure to anyone’s use of alcohol fell 20% among all who died in crashes during 1982–2001. Several studies have reported that alcohol use is strongly associated with crash risk14,35–42 and alcohol use can affect the risk of a crash for everyone on public roads. As a consequence, decreased use of alcohol alone made a larger contribution to the decline in crash death rates than any of the other four risk factors that we studied; an estimated 153 168 lives were saved by reduced alcohol use.
Not wearing a seat belt was second in importance. The association of no seat belt with death is not as strong as for most observed alcohol blood levels and not wearing seat belts only affects people in vehicles. Nevertheless, the prevalence of this risk factor fell 39%, consistent with observed seat belt use,9 and an estimated 129 297 lives were saved.
Lack of an air bag showed the greatest decrease in prevalence (48%) of the factors we studied. But the contribution of this change was relatively small (4305 lives saved), as lack of an air bag is only weakly associated with the risk of death10,43–46 and air bags only affect front seat occupants.
Failure to wear a motorcycle helmet decreased somewhat and deaths attributed to this risk factor declined. But motorcycle death rates declined during this interval in part because there were fewer motorcycles. Registered motorcycles fell from 5.7 million in 1982 to 3.8 million in 1997; after 1997 registrations increased, reaching 4.9 million in 2001.1,47 Changes in motorcycle helmet use saved approximately 6475 lives.
Bicycle helmet use was uncommon during 1982–2001 and only 239 deaths were prevented by changes in helmet use.
Limitations
Counts of traffic crash deaths in FARS and in national death certificate data agree closely.48 However blood alcohol levels were missing for over half the drivers, pedestrians, and bicyclists in this study. Several studies of alcohol in crashes have relied on singly imputed alcohol values, which ignore uncertainty regarding the missing values.49–51 Restricting an analysis to records with complete data leads to valid estimates only if data are missing completely at random,34 which is not the case in crash data.52 We used multiple imputation, which relies on the weaker assumption that data were missing at random, conditional on the values of variables used for imputation.30,34 Bias could still be present if the pattern of missing values were strongly related to unmeasured aspects of crashes or people.
Any study of attributed deaths relies on assumptions about what fraction of deaths should be attributed to a risk factor. We used attributable fraction methods based on adjusted risk ratios.53,54 Several studies provide evidence that the risk ratio for a serious crash increases steeply with blood alcohol level of a driver, pedestrian, or bicyclist.14,35–42 Our estimates are relatively insensitive to choice of alcohol risk ratio estimates, as once the risk ratio is 10 or greater, the attributable fraction becomes 0.9 or more; 81% of the alcohol attributable fractions in our study were 0.9 or greater. The National Highway Traffic Safety Administration estimates that air bags reduce the risk of driver death by about 11%,55 which differs little from the estimates we used. The agency estimates that seat belts reduce the risk of front occupant death by 45% in cars and 60% in light trucks.56 Had we used these estimates, the number of deaths attributed to not wearing a seat belt would have been somewhat reduced.
Past studies
Previous studies of alcohol and driving, including reports using multiple imputation, have reported declines in alcohol related crash deaths in the US.50,57 These studies defined a crash as alcohol related if a driver, pedestrian, or bicyclist either had evidence of any drinking or had a level of blood alcohol above a certain level, such as 0.08 g/dl. Using this method, these studies have also reported decreases in deaths related to alcohol use.
Trends in crash deaths due to factors not studied
While the rate of death attributed jointly to the five risk factors decreased by 48%, the rate of other deaths not attributed to these factors increased by 29%. This suggests that favorable changes in the prevalence of the risk factors we studied exerted a downward influence on crash mortality, while other changes increased crash mortality. One factor that may have increased crash mortality is faster driving speed; in 1987 many states raised the speed limit on rural freeways from 55 to 65 miles per hour58 and after 1995 speed limits on many freeways were increased further.6 Another factor is the increase in miles driven, which increased from 6885 per person-year in 1982 to 9803 in 2001.1 A third factor may be the shift in the vehicle fleet from passenger cars to light pickups and sport utility vehicles.6,59
Key points
-
In the US during 1982–2001, 858 741 people died in traffic crashes.
-
These deaths were attributed to one of five risk factors:
Alcohol use while driving (43%)
Failure to wear a seat belt (30%)
Lack of an air bag (4%)
Failure to wear a motorcycle helmet (1%)
Failure to wear a bicycle helmet (1%).
-
61% of the deaths were attributed to the joint effects of the five risk factors.
-
The five risk factors became less common over the 20 year period. This favorable change saved lives:
Reduced use of alcohol—153 168 lives saved
Increased seat belt use—129 297 lives saved
Increased air bag prevalence—4305 lives saved
Increased use of motorcycle helmets—6475 lives saved
Increased use of bicycle helmets—239 lives saved.
CONCLUSION
Decreased drinking of alcohol and increased use of seat belts were associated with substantial reductions in crash mortality from 1982 through 2001. Increased presence of air bags, motorcycle helmets, and bicycle helmets also prevented some deaths. Favorable changes in all five risk factors were estimated to have changed the trend in death rates from a projected 29% rise to an observed 26% decline.
REFERENCES
Supplementary materials
Files in this Data Supplement:
- view PDF - Appendices 1-4.
Footnotes
-
Funding/support: This work was supported by grants R49/CCR002570 and R49/CCR019477-01 from The Centers for Disease Control and Prevention, Atlanta, Ga and by the Crash Injury Research and Engineering Network of the National Highway Traffic Safety Administration. Its contents are solely the responsibility of the authors and do not necessarily represent the official views of The Centers for Disease Control and Prevention or the National Highway Traffic Safety Administration.
-
Competing interests: none.