Article Text

Abstract
Study Objective: This study examined whether high levels of racial segregation are associated with high county level intentional injury rates.
Design: Multiple linear regression was used to assess the association between county racial segregation (measured by the Gini coefficient) and intentional injury rates. Multicollinearity was assessed with Eigenvalues and condition indices.
Setting: State of Pennsylvania.
Patients: County level intentional injury rates for 1995 to 1997 were calculated from hospital discharge data.
Main results: After controlling for other known county level risk factors, higher levels of racial segregation in a county were significantly related to higher intentional injury rates. Multicollinearity was not a problem. Population size and density, family stability and median income, together with the percentage male, unemployed, in poverty, divorced men, and high school graduates of the county were controlled.
Conclusions: Racial segregation is an important factor in the rate of intentional injury in a community. These results may be important for municipal and state agencies when developing public policies to prevent violence and promote racial integration.
- race
- segregation
- violence
- intentional injury
- community
Statistics from Altmetric.com
Although many studies have found an association between race and intentional injury, a full understanding of race in the aetiology of intentional injury is widely debated. Most epidemiological studies of intentional injury simply analyse race at the level of the individual. However, individual level studies are not able to examine the potentially important effects of socioenvironmental forces—though these forces are important.1 One socioenvironmental characteristic that may play an important part in intentional injury is the racial segregation of a community.2,3
Previous studies have shown an association between racial segregation and rates of intentional injury, although the strength, and sometimes the direction, of this association vary.4 Most of these previous studies have been conducted using crime or crime victimisation databases, such as the Uniform Crime Reports (UCR). Though these data have many advantages, they also possess several inherent limitations such as reporting and arrest biases.5 A significant limitation of these studies has been the problem of multicollinearity. It is probable that these limitations, among others, have added to the poor understanding of the community level effect of racial differences on intentional injury.
This analysis attempts to overcome these limitations through the use of hospital discharge data to examine the relation of racial segregation and county level intentional injury while considering multicollinearity. This use of hospital discharge data complements the findings of prevous crime data studies by providing results of the analysis from a database with different advantages and limitations. To the best of our knowledge, no studies of racial segregation and intentional injury have been conducted using traditional public health data sources while simultaneously adjusting for issues of multicollinearity.
METHODS
We conducted multiple linear regression analysis to assess the association between racial segregation of a county and intentional injury rate. Other county level variables known or thought to be related to intentional injury rates were included in the model. Approval to carry out this research has been approved by the University of Pittsburgh’s Internal Review Board.
Variables and datasets
Dependent measure
Intentional injury rate for each county in the state of Pennsylvania was compiled from Pennsylvania hospital discharge data. To minimise the impact of year to year fluctuations, the data were aggregated for years 1997 to 1999. An intentional injury discharge was defined as a case having an ICD-9-CM code in the range of E960-E969, “homicide and injury purposely inflicted by other persons”. This range represents injuries inflicted by another person with the intent to injure or kill.* Rates were calculated with 1990 population counts from the United States Census Bureau.
Independent measures
Covariates were derived from 1990 United States census data and are listed in table 1. Racial segregation was the independent variable of interest. There is no consensus on the best way to measure segregation. Segregation includes several dimensions such as evenness, exposure, concentration, centralisation, and clustering.6,7 Theoretically the measures for each of these dimensions differ; however, in practice they have been found to be highly correlated.6,8 We chose to use evenness as our measure of segregation for three reasons. Firstly, this is the most widely used measure throughout segregation research and allows for cross study comparisons. Secondly, the measure of evenness gives us a better understanding of the spatial distribution of minorities. Thirdly, as stated, each of the dimensions have been found to be highly correlated so the results would not tend to differ much given the use of different dimensions. Massey and Denton conclude that the best measure of evenness is the dissimilarity index, as little is contained in any of the other measures that is not already accounted for in the dissimilarity index.6 In addition, this measure has been by far the most reported measure in segregation research for 30 years.6 However, James and Taueber found that the dissimilarity index did not satisfy four important criteria for the validity of a segregation measure that the Gini coefficient did.7 We chose to conduct our analysis using both the dissimilarity index, because it is the mainstay of segregation research, and the Gini coefficient. Given that the results were similar, we report only results with the Gini coefficient.
Independent variable of interest and covariates of intentional injury initially included in the linear regression model
The Gini coefficient is the mean absolute difference between minority proportions weighted across all pairs of areal units, expressed as a proportion of the maximum weighted mean difference.6 It ranges from 0 to 1; 0 representing total integration and 1 total segregation. It was calculated for each county using the census tract level distributions of population as the areal units for the white population and other races. (With few exceptions, census tracts are fully contained within counties in PA.)
Statistical analysis
Multiple linear regression was used to examine the independent association of county level intentional injury rates and racial segregation. The distribution of the intentional injury rates was not normal; therefore a log transformation was performed, which normalised the distribution (Anderson-Darling p value = 0.0853). The independent variables considered for selection in the model are listed in table 1. These measures were chosen as they have been shown in the literature to be important covariates of community level violence.4
As the analysis uses aggregated data, particular attention was paid to the problem of multicollinearity.9,10 Multicollinearity exists when dependent variables in a regression model are highly correlated (usually defined as 0.90 and above). This problem is prevalent in analysis of aggregated data such as census data.11 Land et al describe three problems that multicollinearity can cause when using aggregated data in multivariate regression: (1) large changes in the estimated regression coefficients when a variable is added or deleted, or when an observation is changed or deleted; (2) wide confidence intervals, non-significant test statistics, and algebraic signs opposite to those expected from theoretical considerations or previous experience for important independent variables, and (3) a corresponding instability of the regression coefficient estimates from sample to sample.11 Many previous studies of intentional injury at the community level have reported problems with multicollinearity.12–14 In response, Land et al has suggested that principal component analysis be used to simplify the dimensionality of the covariate space and produce a more stable model.11 For this analysis, Pearson and non-parametric Spearman correlation matrices were first calculated to examine the possibility of multicollinearity in the univariate and bivariate analyses. Eigenvalues and condition indices were used to assess multicollinearity in the regression models. Principal component analysis was conducted to determine which sets of variables group together.15 It combines highly correlated variables into a single index, thus eliminating multicollinearity.
Twelve principal components were constructed from 12 independent variables using SAS (PROC PRINCOMP, SAS Institute, Cary, NC). Similar data reduction techniques have been used in past, small area studies of homicide and intentional injury.16 Two regression models were then constructed; one using the original covariates and one using the principal components. These models were then compared. To further assess the models, standard regression diagnostics were also used, including residual analysis to identify outliers and influential observations.
Key points
-
Racial segregation at the county level is associated with higher levels of intentional injury rates.
-
This association continues after adjusting for other known correlates of intentional injury rates at the county level.
RESULTS
Basic descriptives of PA and counties
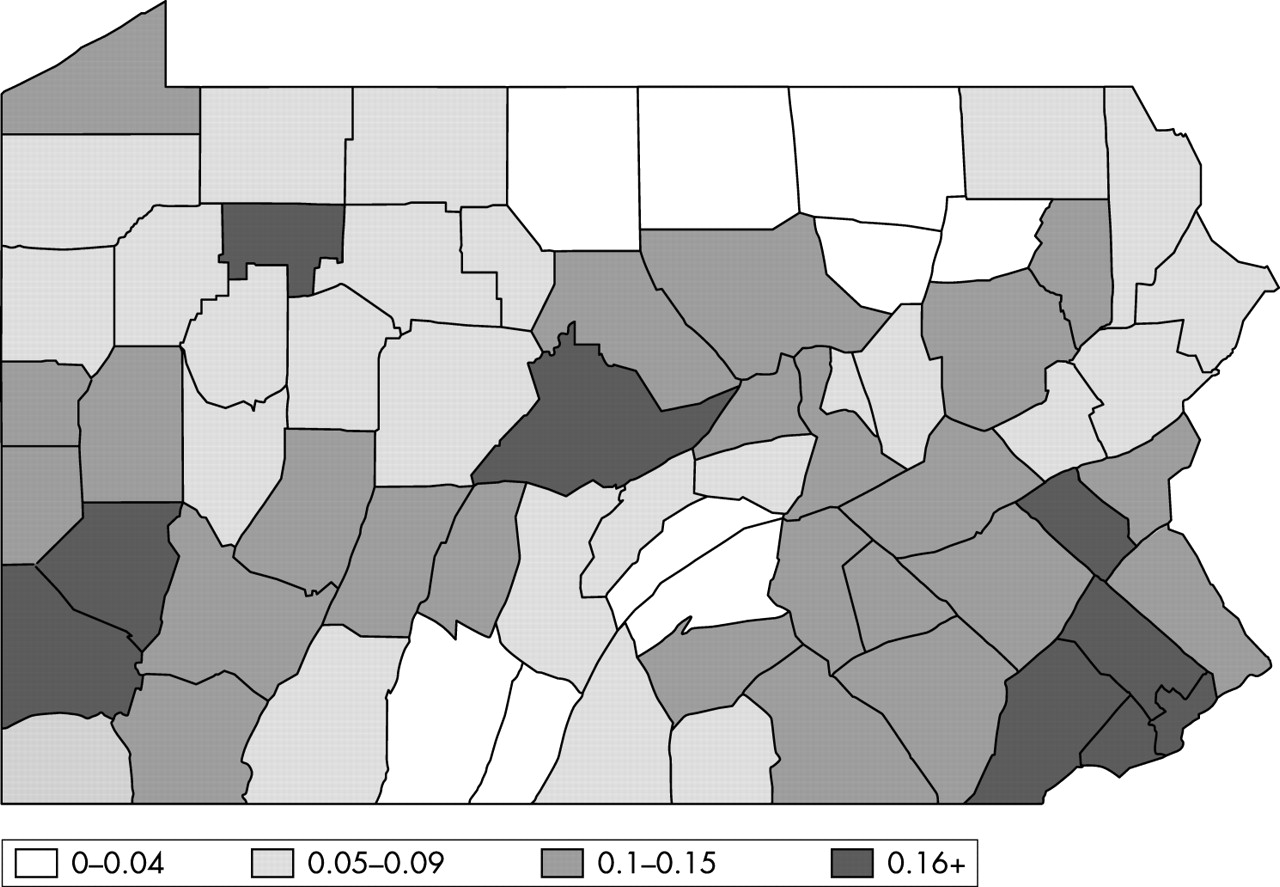
In 1990, the population of PA was 11 881 643. The racial composition of Pennsylvania was predominantly white (88.5%) followed by African American (9.2%), to account for almost 98% of the total population. An overall profile of the 67 counties in Pennsylvania (table 2) showed great variation in the percentage of non-white residents (0.0%–46.0%), the population density (11.1–11 088 per square mile), and the percentage of residents over 25 years of age who graduated high school (64.0%–84.9%). Examining the intentional injury rates (range 3.54–171.02 per 100 000) and the levels of segregation (Gini coefficient of racial segregation, 0.09–0.77) also reveal large variation (fig 1 and fig 2). The higher intentional injury rates and the higher Gini coefficients clustered around the more metropolitan centres of the state (that is, Philadelphia, Pittsburgh, Erie, and Allentown). The most notable disparity was that Philadelphia County’s intentional injury rate was more than 3.5 times greater than any other county (171.02/100 000). In addition, Philadelphia County was the only county with a non-white population proportion above 20% (46.0%), and had the highest population density (11 088 inhabitants per square mile) by a margin nearly four times the second ranked county.
Basic descriptives for selected demographic characteristics at aggregate county level

Intentional injury hospitalisation rates per 100 000 population for Pennsylvania by county, 1997–1999.

Racial segregation (Gini coefficient) for Pennsylvania by county, 1997–1999.
Principal component analysis
Twelve principal components were constructed from the 12 independent variables considered in the regression model. As the purpose of the analysis was to compare models with and without principal components, we used a liberal component loading cut off score of 0.40 or greater. The two top principal components are shown in table 3—a population component and an economic component. These were used in model construction. The population component primarily represents total population, population density, racial composition, and family stability. The economic component primarily represents unemployment, income, and poverty.
Eigenvectors for the principal component analysis
Linear regression
Table 4 shows the results for the stepwise regression. In the model using the original covariates, the Gini coefficient for racial segregation was significant (β = 1.10, p = 0.01). In addition, median household income (β = 0.0003, p = 0.01), and family stability (β = 0.11, p<0.0001) were also significant. All variables except median household income were in the expected direction. In the model using the principal components indices, the Gini coefficient for racial segregation was again significant (β = 0.96, p = 0.02), as was family stability (β = 0.12, p<0.0001), and the economic index (β = 0.11, p = 0.02). The relation of each of the covariates was in the expected direction. Comparison of the r2 values showed that the models were similar in their explanation of the variation of the injury rate (0.5872 v 0.5755). The Cook’s D value for Philadelphia was relatively large (0.171 and 0.140) suggesting that it may be influencing the results. We therefore ran the same model without Philadelphia and obtained similar results. Examining the Eigenvalues and the condition indices suggests that neither model demonstrated excessive problems with multicollinearity—for both models the condition index was under 2.5.
Linear regression results for model using the original covariates and the model using the principal components
DISCUSSION
Despite recent reports from the 2000 US census that racial segregation levels are at their lowest point since 1920, segregation is still prevalent throughout the country.8 In 2000, 25% of the metropolitan statistical areas in the United States were hypersegregated (dissimilarity index greater than 0.60) and another 50% were partially segregated (dissimilarity index of 0.40–0.60). The analyses presented here indicate that this pattern of racial segregation is associated with intentional injury. We found that the more segregated a county, the higher the intentional injury rate for that county. Furthermore, this relation seems to be independent of other demographic and socioeconomic factors known to be related to intentional injury rates.
There have been few studies that have examined the association of racial segregation and intentional injury, and to our knowledge no recent studies have been published. In general, the results of previous studies are similar to the current effort, even though different datasets and areal units were used. In 1987, Logan and Messner examined the effects of racial segregation on rates of suburban violent crime in 54 metropolitan areas.17 Data from the Uniform Crime Reports were used, and analyses were carried out separately for 1970 and 1980. The authors found that more racially segregated areas were characterised by relatively higher rates of intentional injury for both years. Though these analyses were carried out at the relatively expansive metropolitan area level, results were similar to ours. The analyses adjusted for poverty-inequality index, residential mobility, racial composition, youth, total population, and whether the area was in the south of the US.
In a 1988 study, Smith and Jarjoura found that racial segregation was significantly correlated with violent crime, even after adjusting for poverty; however, the association was attenuated once family structure was controlled.18 In our results, we found that family stability was significant, though racial segregation remained significant. In 1993, Peterson and Krivo examined the impact of racial segregation on rates of black homicide victimisation for large United States cities with the Federal Bureau of Investigation’s Supplementary Homicide Reports. The analysis was limited to African American homicide rates. However, the authors found that higher levels of segregation were associated with higher rates of murder for acquaintance and stranger homicides, but not family homicides.
These previous studies have generally relied on crime databases, which bring several limitations that the use of HDD can moderate. One weakness of crime data is that they are collected only for those intentional injuries that come to the attention of the police and result in an arrest. For instance, several studies suggest that some law enforcement officials may be biased in their arrests, and data show that black people are more likely to be arrested for the same infraction than white people.19 This phenomenon could lead to an overrepresentation of the black population in crime data. Hospital Discharge Data overcome this limitation because all seriously injured persons are likely to be hospitalised regardless of race. Uniform Crime Report data are also limited in that they are incident based and not individual based. Therefore, a case in the Uniform Crime Report database counts one person assaulting two people as one case. As the hospital discharge is based on individuals and not offenders, each victim is included. Finally, participation in the National Uniform Crime Report Program is strictly voluntary, and though the sample is large it may not be representative of the nation as a whole. As hospital discharge data are a population and not a sample, it is likely to include relatively all serious intentional injuries.
Policy implications
-
These results may be important for municipal and state agencies when developing public policies to prevent violence and promote racial integration.
Previous studies of community level research have had problems with multicollinearity. This statistical problem may have led to varying results between studies, and sometimes results in large or unexpected estimates in regression equations.11 To assess the problem of multicollinearity in our analysis, we used a two step approach. The first step was to calculate principal components that could be used in the regression model. Similar to Land et al, we found two components; a population structure and an economic structure—although there were slight differences in composition and the components were less distinct. However, the purpose of our analysis was to compare models with and without principal components to assess multicollinearity and not to develop specific indices. We found very little difference between the models with the original covariates and the model with the principal components. The r2 values (0.5872 v 0.5755) and the estimates for racial segregation were similar (1.10 v 0.9652). It is recommended that if a Condition Index is greater than 10 this may suggest a problem with multicollinearity. For either model (original covariates compared with principal components) the largest Condition Index did not exceed 2.5. We conclude that there is no problem with multicollinearity and that using principal components in place of the original covariates does not significantly improve the model with these data.
Our results, using a different and distinct database as well as testing for multicollinearity, support the results of prior studies, providing further evidence that increased levels of racial segregation in a community is associated with increased levels of intentional injury. However, what mechanism is behind this association is not known. There are a plethora of theories as to why this association exists and prior studies have hypothesised on the possible theoretical explanations. Logan and Messner suggest that Merton’s social structure and anomie thesis,20 which suggests that segregation limits mobility and quality of life for black people, may be an explanation.17 Another possible explanation that they discuss is a criminal subculture model in which, presuming that black people are more likely to be both a victim and offender of a violent crime, a community that is largely made up of black people could result in a general understanding or acceptance of violence.21 Finally, they describe another possible explanation that suggests that the concentration of disadvantaged persons in some communities foster crime by undermining those communities’ abilities to protect themselves—not necessarily by promoting a “criminal subculture”, but by undermining the means for stopping crime.22 However, these explanations are not supported by Peterson and Krivo’s data in which a larger black population significantly reduces the level of black homicide. An important finding of that study is that the influence of segregation is greater for homicides in which less intimate parties are involved. Peterson and Krivo suggest that segregation may be more indicative of social isolation than of relative SES deprivation.23 Furthermore, considering Felson and Cohen’s routine activities theory, it is theorised that racial segregation may play an important part on the social forces that lead to increased levels of intentional injury.24,25 They explain that a convergence of opportunities is much more likely to occur in a highly segregated area where potential victims and offenders are more likely to be acquainted and/or to live near one another, such as in a highly segregated area.
It is important to state that the possible explanations of the association between racial segregation and intentional injury are only at the theoretical level, and current methodological and measurement techniques are not developed fully enough to adequately test these theories (including the current analysis). Before we can begin to understand what forces are at work, several important factors need to be addressed. Data need to be looked at over time to see if there is a temporal trend between segregation and intentional injury. In addition, a very important effort is to develop the methods for adequately examining and separating individual and community level effects. In a landmark study published in 1997 by Sampson et al, the authors state that few studies have successfully demonstrated a unified approach to the individual and community level dimensions of crime.26
As with any study, there are some limitations to the current analysis. As race is a salient individual level predictor of intentional injury, the community level variations between intentional injury and racial segregation may merely reflect the aggregation of individual level effects. Also, the census data used here are from 1990, as 2000 data at the census tract were not yet available at the time of our analysis. These may not reflect the true picture for that time period. However the population of Pennsylvania has been shown to be stable. In addition, we chose to compare the white with non-white populations, possibly ignoring the differences for other minorities. However, with the exception of Philadelphia, the percentage of the population that are Hispanic or Asian is very small. Finally, several counties had small rates. We conducted the analysis with only counties that had 20 or more injuries over the course of the study and found similar results.
The effects of racial segregation on intentional injury, along with other social problems, remain an important area of study. Our results, and others, suggest that in communities with higher levels of segregation, there are higher levels of intentional injury. These results could have strong implications for the prevention of intentional injury. If it is found that this association holds, municipal and state agencies should consider these results when developing public policies to prevent intentional injury and promote racial integration. Among these polices are housing assistance programmes. Effective primary prevention may accompany programmes promoting access to housing in racially and economically diverse communities. For instance, distributed site housing relocation programmes like the United States Department of Housing and Urban Development’s Moving to Opportunity for Fair Housing section 8 rental vouchers, may provide the opportunity to address socially relevant changes in community level factors of violence.
REFERENCES
Footnotes
-
↵* Excluded are self inflicted injuries (E950-E959), injuries due to legal intervention (E970-E978) and operations of war (E990-E999), adverse effect (E870-E879, E930-E949), or cases in which the intent could not be determined at time of admission (E980-E989).
-
Funding: research reported in this paper was supported in part by grant no B49/CCR310285, Grants for Injury Control Research Centers, from the Centers for Disease Control and Prevention, National Center for Injury Prevention and Control.
Linked Articles
- In this issue