Article Text

Abstract
Study objective: To investigate the association between motor vehicle driver injury and socioeconomic status.
Design: Cohort study with prospective and retrospective outcomes.
Setting: New Zealand.
Participants: 10 525 adults (volunteer sample of a multi-industry workforce, n=8008; and a random sample of urban electoral rolls, n=2517).
Outcome measure: Motor vehicle driver injury resulting in admission of the driver to hospital or the driver’s death, or both, during the period 1988–98; hospitalisation and mortality data were obtained by record linkage to national health databases.
Main results: After adjustment for age and sex, driver injury risk was inversely associated with both occupational status (p for linear trend <0.0001) and educational level (p for linear trend =0.007). Participants in the lowest approximate quartile of occupational status were four times as likely (HR 4.17, 95% CI 2.31 to 7.55) to have experienced a driver injury during follow up as participants in the highest approximate quartile. Participants who had been to secondary school for less than two years were twice as likely (HR 2.26, 95% CI 1.34 to 3.81) to have experienced a driver injury as those who had been to university or polytechnic. There was little evidence that driver injury risk was associated with neighbourhood income (p for linear trend =0.12)
Conclusions: Occupational status and educational level seem to be important determinants of driver injury risk. Driver injury countermeasures should be targeted to people in low status occupations, as well as to people with comparatively little formal education.
- traffic accidents
- socioeconomic status
- cohort studies
Statistics from Altmetric.com
Several studies have reported that low socioeconomic status is a risk factor for vehicle related injury,1–8 a composite outcome that typically comprises motor vehicle driver and passenger injury (henceforth simply “driver” and “passenger” injury), and sometimes also includes cyclist and pedestrian injury. There is, though, only sparse evidence about the associations of socioeconomic status with each of these specific types of road user injury. It is plausible that the associations could differ quantitatively, and perhaps even qualitatively. For example, whereas people in lower socioeconomic groups may have higher risks of driver injury,9 they might well have lower risks of pedestrian or cyclist injury.10 The determinants of driver injury are of particular interest because, as the use of private motor vehicles has become more widespread, injuries to drivers have recently formed a larger proportion of total road user injuries in many countries. Moreover, drivers not only injure themselves, but they frequently injure other types of road user, so effective countermeasures that prevent driver injury might, as a corollary, also prevent injuries to other types of road user. Hence, while accurate information on the socioeconomic determinants of driver injury is of particular importance, little such information is available, and the information cannot necessarily be inferred from the available data on broader composite outcomes. We consequently investigated the associations of driver injury risk with indicators of socioeconomic status in a cohort study of 10 525 New Zealand adults.11
METHODS
Participants
Participants in this cohort study were recruited in 1992–93 (baseline) from two sources: the workforce of a nationwide multi-industry corporation (8008 participants, response rate 76%) and the electoral rolls of greater Auckland (2517 participants, response rate 67%).11 The ages at baseline ranged from 16 to 88 years (median 42 years). Seventy two per cent of participants were men. All participants provided signed consent to take part in the study, and the study was approved by the University of Auckland Human Subjects Ethics Committee.
Exposure
Three indicators of socioeconomic status were assessed from a questionnaire administered at baseline: educational level, occupational status, and neighbourhood income. Educational level was defined as self reported highest level of education attended. Occupational status was defined as the International Socioeconomic Index (ISEI)12 score for self reported occupation. Neighbourhood income was defined as median annual household income for the area unit (a geographically defined area containing, on average, 680 households) in which the participant lived. The income data were obtained from Statistics New Zealand, which matched self reported domicile address with household income data from the 1991 New Zealand census. The income data are reported in New Zealand dollars ($NZ 1.00 ≈ $US 0.60 in 1991).
Potential confounders
Driving exposure was estimated from two sources: age specific and sex specific data on driving exposure in the 1989–90 New Zealand Household Travel Survey,13 and self reported occupation (which was classified as likely to entail much, some, little, or no driving). More precise, individual data on driving exposure were not available for participants in this study. Age, sex, alcohol (self reported maximum daily intake), area of residence (population ⩾200 000, 20 000–200 000, or <20 000) and marital status (married/living with a partner, divorced/separated/widowed, or never married/lived with partner) were based on data reported by participants in the baseline questionnaire. Body mass index (kg/m2) was calculated from height and weight measured by research nurses at baseline.
Outcome
Participants were classified as cases if they had been injured between 1988 and 1998 while driving a motor vehicle, and the injury resulted in the hospitalisation or death of the driver, or both. Data on deaths and hospitalisations were obtained by record linkage to national databases held by the New Zealand Ministry of Health. In New Zealand, most non-fatal injuries severe enough to require hospital inpatient care result in admission to a public hospital,14 and all public hospitals compulsorily provide the Ministry of Health with summary information on each inpatient admission. All cases had an ICD-9 N-code in the range 800–999, an E-code in the range 810–829, and evidence that they had been driving at the time of the crash (either a free text narrative description indicating this, or an E-code fourth digit of 0 or 2).
Statistical methods
Hazard ratios (HR) and 95% confidence intervals (CI), which are for the “total follow up period” (that is, the prospective and retrospective periods combined) unless stated otherwise, were calculated using Cox proportional hazards models (PHREG in SAS, Release 8.00). For analyses involving the total follow up period, the time origin was specified as 1 January 1988, and follow up was terminated at the date of driver injury, date of death (from any cause) or 31 December 1998, whichever occurred first. The same methods were used in the retrospective and prospective analyses except for the following: in the retrospective analyses, follow up was terminated at the date of baseline assessment instead of 31 December 1998, and in the prospective analyses, the time origin was specified as the date of baseline assessment.
HR were adjusted for covariates by inserting continuous (age and occupational status) or categorical (all other covariates) terms for these variables into the Cox models. Categorical covariates were used for alcohol intake, driving exposure, and body mass index because of evidence that associations between these variables and risk of the outcome were not log-linear. The HR were adjusted for study cohort, rather than reported cohort specifically, because of the small number of cases (nine) in the electoral roll cohort. The p values for linear trend were estimated by inserting polynomial contrasts15 into the Cox models. The proportional hazards assumption was tested by fitting time dependent covariates.
The shape of the association with occupational status is illustrated in a regression spline,16 which was estimated using generalised additive models with four degrees of freedom (S-Plus 2000 Professional, Release 2). Regression splines are smoothed series of fitted local regression lines and can be useful for showing trend.17
The distributions of possible confounders across categories of the socioeconomic indicators were adjusted for age and/or sex by direct standardisation to the study population (categorical confounders), or by analysis of covariance (continuous confounders). The p values for homogeneity, also adjusted for age and/or sex, were calculated by the Mantel-Haenszel χ2 method (categorical confounders) or analysis of covariance (continuous confounders).
RESULTS
During 108 741 person years of observation (mean 10.3 years), 139 incident driver injury cases (137 non-fatal and two fatal) occurred. Eighty five cases occurred retrospectively (that is, before baseline), and 54 prospectively (that is, after). Just over half (n=46) of the cases in the retrospective period, and two thirds (n=37) in the prospective period, were injured while driving a four wheeled vehicle (in most instances, a car). The remainder in each period were injured while driving a motorcycle.
Table 1 shows the distribution of possible confounders across categories of the socioeconomic indicators. People in the lowest educational level groups tended to be older, whereas those in the lowest occupational status and neighbourhood income groups tended to be younger. Men and heavy drinkers tended to be more prevalent in the lower socioeconomic groups.
Standardised distributions* of several known and possible risk factors for driver injury, by indicators of socioeconomic status
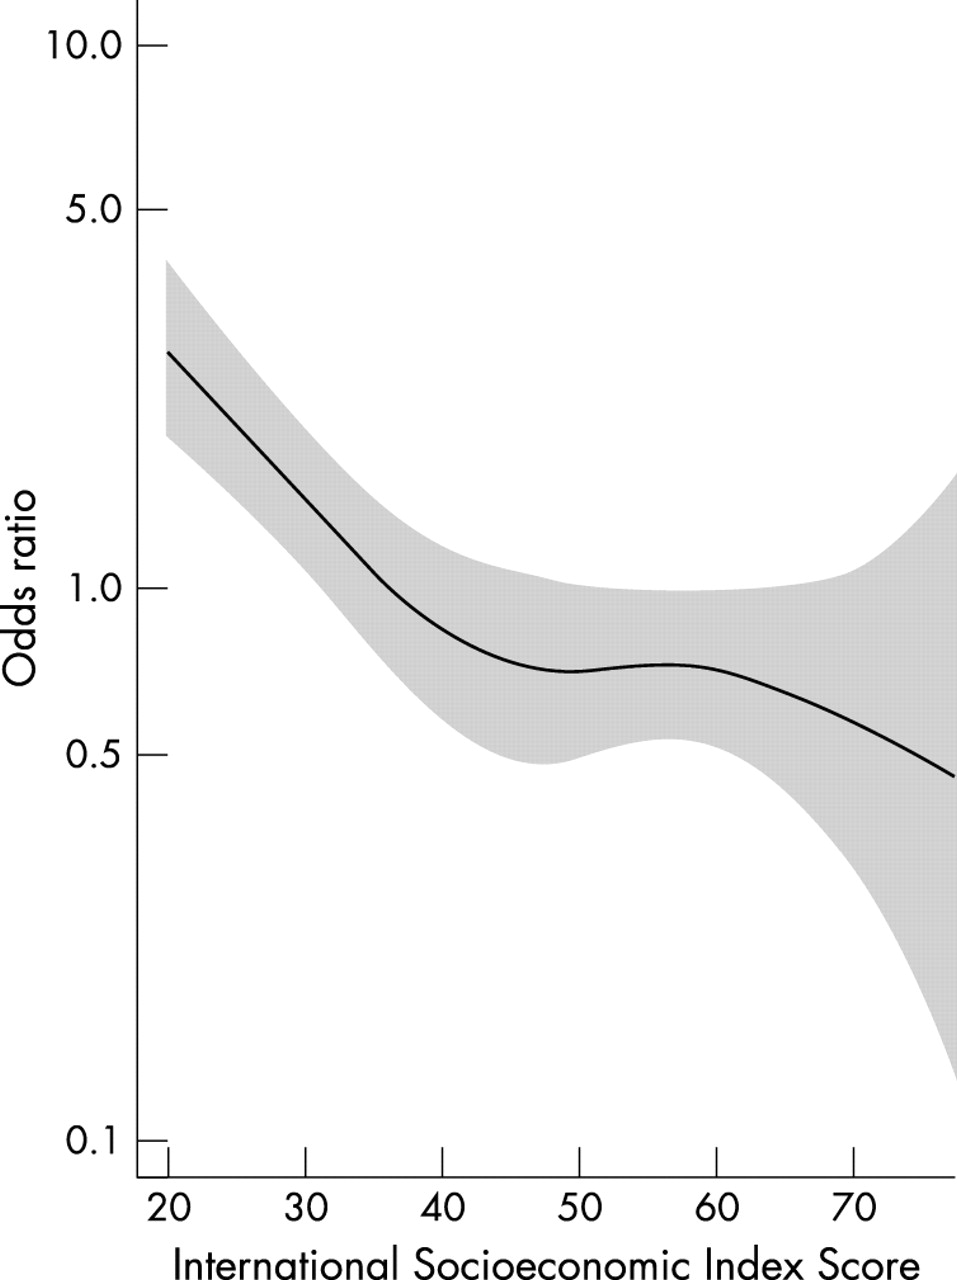
Table 2 shows the associations between driver injury risk and each of the indicators of socioeconomic status. After adjustment for age and sex, driver injury risk was inversely associated with both occupational status (p for linear trend <0.0001) and educational level (p for linear trend =0.007). The association with occupational status was strong, with participants in the lowest occupational status group being four times as likely (HR 4.17, 95% CI 2.31 to 7.55) to have experienced a driver injury during follow up as participants in the highest group. The inverse association with occupational status is illustrated in figure 1. The association with educational level appeared to be weaker, with those participants who had been to secondary school for less than two years being twice as likely (HR 2.26, 95% CI 1.34 to 3.81) to have experienced a driver injury during follow up as those who had been to university or polytechnic.
Incidence rates and hazard ratios for driver injury during the total follow up period, by indicators of socioeconomic status

Regression spline showing odds ratio of driver injury in relation to occupational status, adjusted for age and sex. Higher International Socioeconomic Index scores indicate higher occupational status. The solid line indicates odds ratio point estimates, and the shaded area indicates 95% confidence bands.
These associations were attenuated by, but still evident after, adjustment for study cohort, driving exposure, and alcohol intake (table 2). After further adjustment for area of residence, marital status, body mass index, and either educational level or occupational status (whichever of these variables was not the exposure), an association with occupational status was still evident (p for linear trend =0.002; maximum HR 2.81, 95% CI 1.49 to 5.31), whereas an association with educational level was not (p for linear trend =0.22; maximum HR 1.41, 95% CI 0.84 to 2.39). By contrast, there was little evidence of an association between driver injury risk and neighbourhood income after any combination of covariate adjustments (lowest p for linear trend =0.12).
For both occupational status and neighbourhood income, the findings in the prospective and retrospective periods were qualitatively similar (table 3). However, for educational level, there was evidence of an inverse association in the retrospective period but little evidence of an association of any type in the prospective period.
Hazard ratios for driver injury during the prospective and retrospective periods, by indicators of socioeconomic status
DISCUSSION
In this cohort study, which had both prospective and retrospective outcomes, we observed inverse associations of driver injury risk with occupational status and educational level. The association with occupational status was particularly strong, and remained after adjustment for several covariates. There was comparatively little evidence that driver injury risk was associated with neighbourhood income. Because of the moderately small number of cases in this study, the findings will have been quite susceptible to the play of chance.18 Nevertheless, the estimated CI and p values suggest that the association with occupational status, and perhaps also that with educational level, were not likely to have arisen by chance alone.
Possible biases
The study included retrospective cases, so past driver injury might have affected socioeconomic status at baseline (“reverse causation”). However, for both occupational status and neighbourhood income the prospective and retrospective findings were qualitatively similar, providing indirect evidence against reverse causation. By contrast, for educational level there was an inverse association in the retrospective period but no evidence of an association in the prospective period. Reverse causation was unlikely, though, to have accounted for this retrospective association (nor, of course, for the absence of a prospective association) as injuries in the retrospective period could not plausibly have caused substantial falls in reported educational levels by the time of baseline assessment (the highest level of educational attendance could in reality have only increased or remained constant). The apparent discrepancy between the prospective and retrospective findings for educational level could well have been the result of chance.
Key points
-
There is little good evidence about the socioeconomic determinants of motor vehicle driver injury.
-
The determinants of driver injury are of particular interest as drivers frequently injure other road users.
-
In this cohort study, occupational status and educational level were important determinants of serious driver injury.
-
Driver injury countermeasures should be targeted to people in low status occupations and people with comparatively little formal education
The fairly crude method by which driving exposure was assessed probably led to underadjustment for that variable. However, errors in the measurement of driving exposure may not have been a serious limitation because when investigating socioeconomic differences in driver injury risk, differences in risk per unit time of follow up are probably as important as differences in risk per kilometre driven. Important differences in risk per unit time can usefully inform public policy whether or not the excess risk can be accounted for by differences in driving exposure, as a differential burden exists none the less.
Other potential biases in this study were probably only negligible. A postal survey of 179 motor vehicle injury cases and a random sample of 200 other participants showed 95% (95% CI 89% to 100%) sensitivity and 97% (95% CI 94% to 100%) specificity for driver injury detection. Educational level, occupation (on which occupational status was based), and domicile address (on which neighbourhood income was based) are variables for which self reported values and subsequent data coding should have been reasonably accurate. In addition, these variables were assessed in the middle of the total follow up period, thus probably mitigating the effects of changes in socioeconomic status with time. Losses to follow up were estimated (from Statistics New Zealand data on emigration and international travel) as 4%–5% of the total available person years of follow up. There was little evidence that the proportional hazards assumption was violated (lowest p value for time dependent covariates =0.12).
Consistency with previous studies
For the reasons outlined above, the determinants of driver injury are of particular importance. There seem, though, to be few if any previously published cohort study data on the socioeconomic determinants of driver injury. Studies with less robust designs—including a case series with general population controls (provided by national census data) that reported a strong inverse association of driver injury with occupational status,9 and a cross sectional study that did not find evidence of an association between driver crashes and occupational status (despite a large sample size)19—have produced somewhat inconsistent results. Several studies (including case-control studies20,21 and case series with general population controls1–8) have investigated the socioeconomic determinants of vehicle related injury, and though there was a tendency for the studies to report inverse associations, the results were not totally consistent with each other, nor, therefore, with those of this study. Some of the studies reported inverse associations with occupational status,1,2,3,5,6 neighbourhood income,8 and other area based indicators of socioeconomic status,4,7 whereas others (one of which was large20) did not find evidence of associations with occupational status,21 educational level20,21 or personal income.21 It is difficult to draw conclusions about driver injury from these studies of vehicle related injury not only because they were somewhat inconsistent, but also because driver injury is merely one component of vehicle related injury.
Causation
In the context of previous research, it is quite possible that in this study driver injury was causally associated with occupational status and educational level. Potential mechanisms by which low occupational status and educational level increased driver injury risk could have included drink driving22,23 and drivers not wearing seatbelts.24–26 Furthermore, drivers in low socioeconomic groups might have been more likely to use old vehicles that are hard to maintain or have fewer modern safety features such as airbags.
Although there was little evidence of an association between driver injury risk and neighbourhood income, the possibility that individual or household income is causally associated with driver injury cannot be excluded as neighbourhood income would have been only a crude surrogate for these variables.
Implications
If the socioeconomic determinants of one type of road user injury (such as passenger injury) differ qualitatively, or perhaps even only quantitatively, from those of another type of road user injury (such as cyclist injury), then countermeasures designed to prevent one type of injury might be comparatively ineffective in preventing the other. Good data are therefore needed on the specific socioeconomic determinants of each type of road user injury, including driver injury. Further research is needed to establish whether driver injury risk is inversely associated with indicators of socioeconomic status in different settings. Further data are also needed to establish whether occupational status is a particularly strong determinant of driver injury risk, and if so, why.
The findings of this study imply that it may be appropriate for driver injury countermeasures to be targeted to drivers in low status occupations, as well as to drivers with comparatively little formal education. It would be sensible, for example, for television campaigns against speeding or drink driving to be communicated by people with whom manual or semi-manual workers can readily identify,27 rather than, for example, by people who look and sound as though they work in high status occupations.
Acknowledgments
Gary Whitlock undertook this research during the tenure of a Health Research Council of New Zealand training fellowship. The research was supported in part by grants from the Fletcher Challenge Welfare Fund, the Health Research Council of New Zealand, and the National Heart Foundation of New Zealand. Taane Clark is supported by a National Health Service (UK) research training fellowship.
REFERENCES
Footnotes
-
Conflicts of interest: none.