Article Text

Statistics from Altmetric.com
Mortality from unintentional injury is one of several measures of public health in which rural populations fare worse than inhabitants of urban areas.1 It is presently unclear to what extent this disparity can be explained by differences in access to emergency medical services (EMS) and advanced trauma care. Trauma systems that decrease the time between injury and definitive care from a hospital with appropriate resources have been advocated to improve outcomes following major trauma.2 Designated trauma centres improve injury outcome in urban areas,3 but access to these centres is variable.4 Moreover, studies of similar systems in rural areas have not been able to verify such beneficial effects on outcome.5–7 A highly centralised trauma care system that covers a large area can become dependent on expensive helicopter services that have limited operability during nighttime and in adverse weather conditions. Such systems may also ultimately deprive smaller hospitals of capabilities and experience to handle moderately and severely injured patients. The effect of trauma care systems and EMS performance in relation to population density are therefore important to clarify, in order to address apparent regional inequalities with targeted preventive efforts.
In Sweden, efforts to improve prehospital medical services have been made over the past 20 years. The proportion of ambulance personnel who are registered nurses has increased as a result of revised regulations from the Swedish Board of Health and Welfare; training in prehospital trauma life support has been introduced and widely accepted; a larger proportion of the country is covered by helicopter EMS. It is, however, unclear whether these measures have improved the outcome for trauma patients and whether a regional inequality following major trauma still exists.
Motor vehicle crashes can provide a suitable model for the study of whether population density affects the outcome of crash patients, and whether this is related to deficiencies in healthcare services. Traffic crashes are often associated with multiple and severe injuries, and are the second most common cause of unintentional injuries after falls.5 Mortality rates after motor vehicle crashes in several countries have been consistently shown to be inversely related to population density.6–9 Although these increased mortality rates may be explained by a multitude of factors other than those related to the healthcare system,9 several investigators have tried to elucidate the role of the trauma system. Results from those studies have been conflicting, but they have generally been unable to control for variables such as the specific cause of injury and injury type and severity.10–14 A further study of the possible influence of post-crash factors, such as EMS performance, is therefore warranted, but requires adequate control of confounding factors.
The purpose of this population-based study was therefore to study the relationship between population density and prehospital and hospital mortality rates following motor vehicle crashes, while controlling for injury severity. Such a study allows indirect assessment of the impact of EMS performance on mortality.
Materials and methods
Study population
All hospital admissions for injury from 1998 to 2004 were extracted from the Swedish National Patient Registry (NPR). The NPR includes all public, inpatient care in Sweden from 1987 onwards, and reports a high level of completeness (http://www.socialstyrelsen.se/register/halsodataregister/patientregistret/inenglish). Overall, 0.6% of hospital stays had missing unique person identification numbers and 1.0% was missing the main diagnosis (2006 figures). Among all injuries in the NPR during the study period, 1.3% of the records had missing unique personal identification numbers and external cause codes were missing in 4%.
Injury deaths, in which the underlying cause of death was V01–Y36 according to the International Statistical Classification of Diseases and Health-Related Problems, 10th revision (ICD-10),15 were extracted from the Swedish Cause of Death Registry. The two datasets (NPR and the Swedish Cause of Death Registry) were combined using the unique Swedish personal identification number for person-based linkage.16 Prehospital injury deaths were defined as autopsied injury deaths not associated with a hospital admission. Incident hospital admissions were selected based on a validated prediction model.17 Admissions with 1 day or less in hospital were excluded in order to remove overnight observational stays from the study population. The rationale was to exclude minor injury cases that are subject to variability in admission criteria and service utilisation.18 19 Another 44 records were excluded because they did not contain a valid entry indicating county of residence. Causes of injury were categorised and only traffic crashes were included in the final study population.20 For multivariable regression modelling, the study population was further restricted to motor vehicle crashes in which the patient was an occupant in the vehicle and had a serious injury (International Classification of Disease Injury Severity Score (ICISS) ≤0.941).21
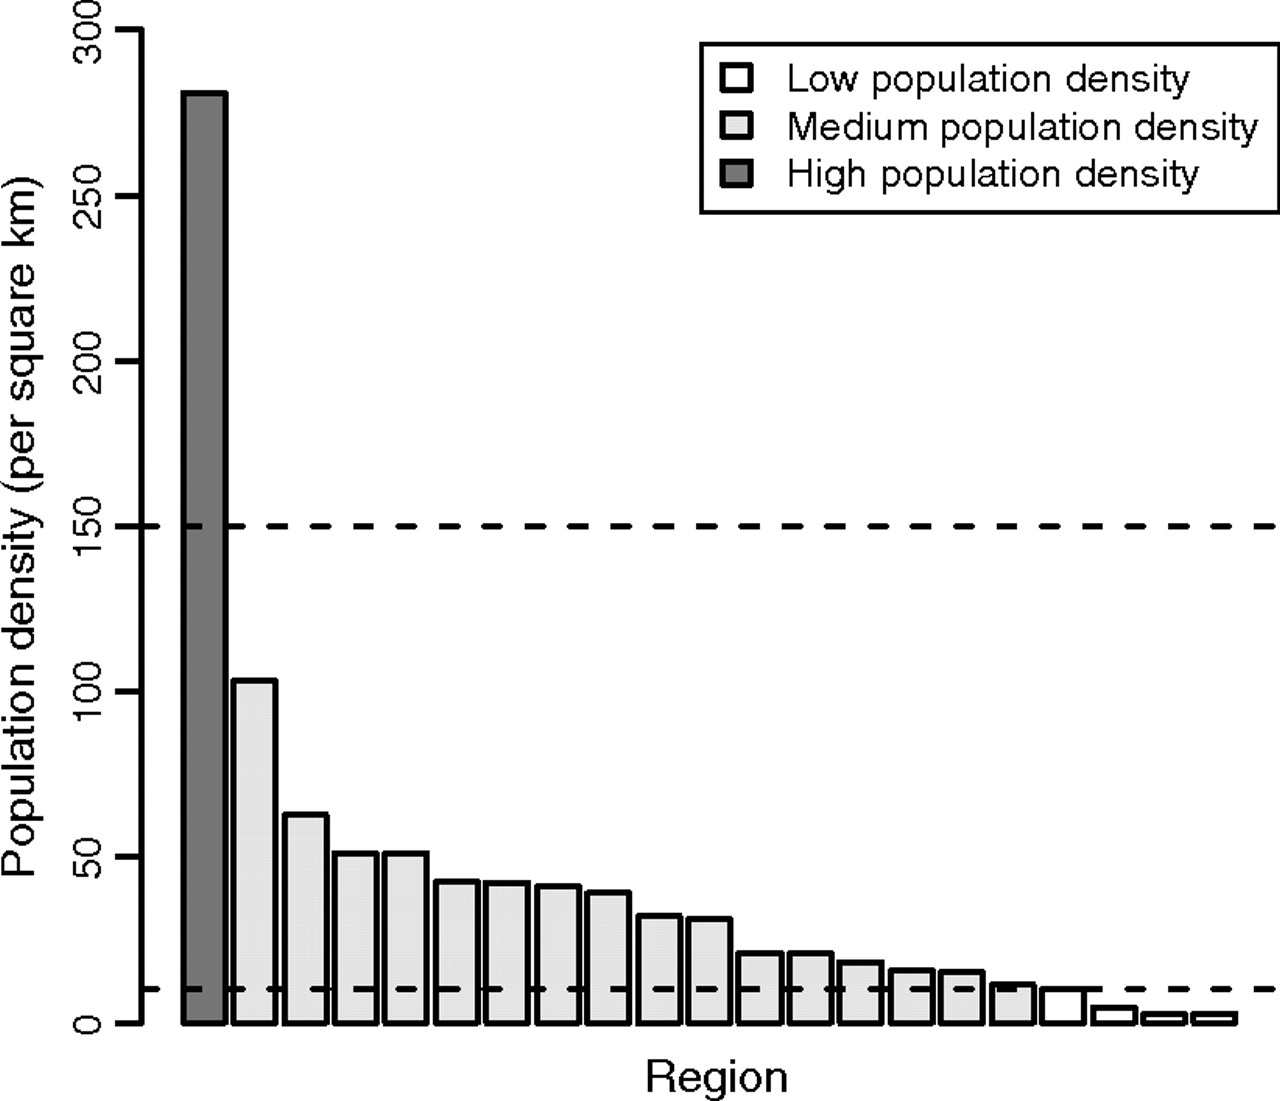
The 21 counties (administrative regions for health care) in Sweden were categorised into three groups according to population density: low (0–9 people/km2); medium (10–149 people/km2) and high (above 150 people/km2; figure 1). The Stockholm region is by far the most densely populated region and the only high-density region. This population was used as the reference level in the analyses. Hospitals in the high population density region covered a mean area of 927 km2, whereas hospitals in the 16 medium population density regions covered a mean area of 3488 km2 and hospitals in the four low population density regions covered a mean area of 25 450 km2. Both hospitalised and prehospital deaths were assigned to a region based on place of residence. Sensitivity analyses were also performed by assigning hospitalised cases to a region based on the primary admitting hospital instead of the place of residence. The study was approved by the regional human ethics committee.

Average regional population density in 21 counties in Sweden (administrative regions for health care, 1998–2004). Horizontal lines indicate limits for population density categories used in the analyses.
Injury classification
Each patient's injuries were categorised according to the injury mortality diagnosis matrix.22 This matrix categorises individual injury diagnosis codes by body region and nature of injury. For the purpose of multivariable regression modelling, five categories of major injury were derived from the matrix: head injury; spinal cord injury; thoracic injury; abdominal injury and pelvic injury.
Injury severity
The ICISS is calculated from empirically estimated diagnosis-specific survival probabilities (DSP) for individual injury ICD-10 codes.23 The DSP is simply the proportion of patients with a specific injury code who survived in a reference population. A modified procedure was used in which each mention of an injury code was weighted proportionally to the number of injury codes mentioned in the recording of the death or hospitalisation. Duplicate ICD-10 codes were eliminated before calculating the DSP. Using this method, each patient only contributed one death or hospitalisation to the total, regardless of the number of injury codes reported for that patient.5 22 24 25 The predictive ability of the ICISS score was not substantially different, however, if the conventional method for generating DSP23 was used instead of our modified method with weighted total mentions. The performance of the selected ICISS threshold limit (ICISS ≤0.941) for serious injury may also differ from the original study21 due to this modification of the method used to derive DSP.
The ICISS score for individual injury cases in a study population is calculated as the product of each of the DSP corresponding to the patient's injuries (ie, the product of the probabilities of surviving each of the patient's injuries individually). For the purpose of description, the ICISS was categorised as minor (0.941–1.0), moderate (0.665–0.940), serious (0.355–0.664), severe (0.220–0.0.354) or critical (0–0.219). The choice of these cut-offs was based on an examination of a logit plot of a smoothed function of the ICISS versus mortality (general additive model, mgcv package in R version 2.7.0) with the aim of minimising the difference in mortality risk within categories and maximising the change in mortality risk between categories.
In the study of hospital mortality, the quality of hospital care may be an important determinant of outcome. In Sweden there is no formal designation of hospitals to different trauma centre levels. Previous studies suggest, however, that the performance of hospitals is related to the trauma centre volume.26 We therefore derived a continuous variable based on the ICISS score, which indicated the number of injured patients with an ICISS score of less than 0.665 from traffic crashes, handled by the hospitals in the region where the patient was primarily admitted. This variable was used to adjust for hospital performance in the study of hospital mortality.
Statistical methods
The average annual county population was obtained from Statistics Sweden and was used to approximate the person-time at risk in calculations of incidence rates. Logistic regression analysis was used to model prehospital and hospital mortality in motor vehicle crashes, in which the patient was an occupant in the vehicle with an ICISS score of 0.941 or less. The association with population density category was adjusted for the following covariates: age; ICISS (both as restricted cubic splines with three nodes); gender; major injury categories and period (early 1998–2001 vs late 2002–4). All possible two-way interactions were tested. Those interactions with a p value of less than 0.05 were evaluated further. Each selected interaction term was tested using the likelihood ratio test and retained in the model if p<0.05.
Possible co-linearity between independent variables was assessed. Variance inflation factors ranged from 1 to 1.7; therefore, multi-co-linearity was not extensive. In the parsimonious model for prehospital mortality, there exists a non-negligible effect-measure modification for population density by both age and abdominal injury. The result of the analysis is therefore presented by plotting predicted probabilities (expressed as the difference in relation to high population density) for prehospital mortality against age. Predictions were restricted to the age range 15–70 years to avoid imprecise predictions in the tails of the age distribution. All other predictors were set to the average value in the study population. A bootstrap procedure with 1000 replications and the percentile method were used to calculate 95% CI for the predictions. For hospital mortality, in which no such effect-measure modification was present, associations were estimated as OR.
The statistical packages SAS version 9 and R version 2.7.0 were used for data management and statistical analyses.
Results
During the 7-year study period, 41 243 traffic crashes resulted in death or admission to a hospital, with 3107 deaths (7.5%) before hospital admission and 832 deaths (2.0%) during hospital stay (table 1).
Characteristics of 41 243 motor vehicle crashes in Sweden from 1998 to 2004 grouped according to regional population density
Prehospital mortality was inversely related to regional population density, whereas hospital mortality only showed a weak correlation with population density (figure 2). Crude estimates indicated that increased rates of both prehospital and hospital mortality were related to low and medium population density (table 2).

Prehospital (left panel) and hospital (right panel) mortality rates related to regional population density. Analysis of 41 243 motor vehicle crashes in Sweden from 1998 to 2004.
Crude rate ratio and rate difference for the association between regional population density and death in motor vehicle crashes in Sweden 1998–2004
There was, however, an uneven distribution of potential covariates between the different categories of population density (table 1). A higher proportion of traffic crash patients was older in regions with low and medium population density, compared with the high population density region. Whereas the proportion of motor vehicle crashes was similar, the proportion of other land transport crashes was higher in low population density regions. In motor vehicle crashes the likelihood that the patient was an occupant of the vehicle was greatest in the low population density regions, whereas the likelihood that the patient was a motorcyclist or a pedestrian was greatest in the high population density region.
Importantly, there was a tendency towards greater injury severity in low and medium population density regions, but the proportion of patients with injuries in major injury regions was greater in the high population density region. This pattern was also reflected in the number of major injury regions affected in each patient.
Multivariable logistic regression modelling was performed to correct for differences in age and gender distributions, type/severity of injuries and period effects. To standardise the cause of injury, the target population was restricted to 6884 individuals in motor vehicle crashes who died or were hospitalised for at least 2 days. Unadjusted assessment of the association between population density and prehospital mortality indicated an excess mortality in low (crude OR 1.26, 95% CI 1.03 to 1.55) and medium (crude OR 1.27, 95% CI 1.08 to 1.48) population density regions (table 3).
Association between regional population density and prehospital deaths among 6884 individuals in motor vehicle crashes, estimated by OR and β estimates from multivariable logistic regression models
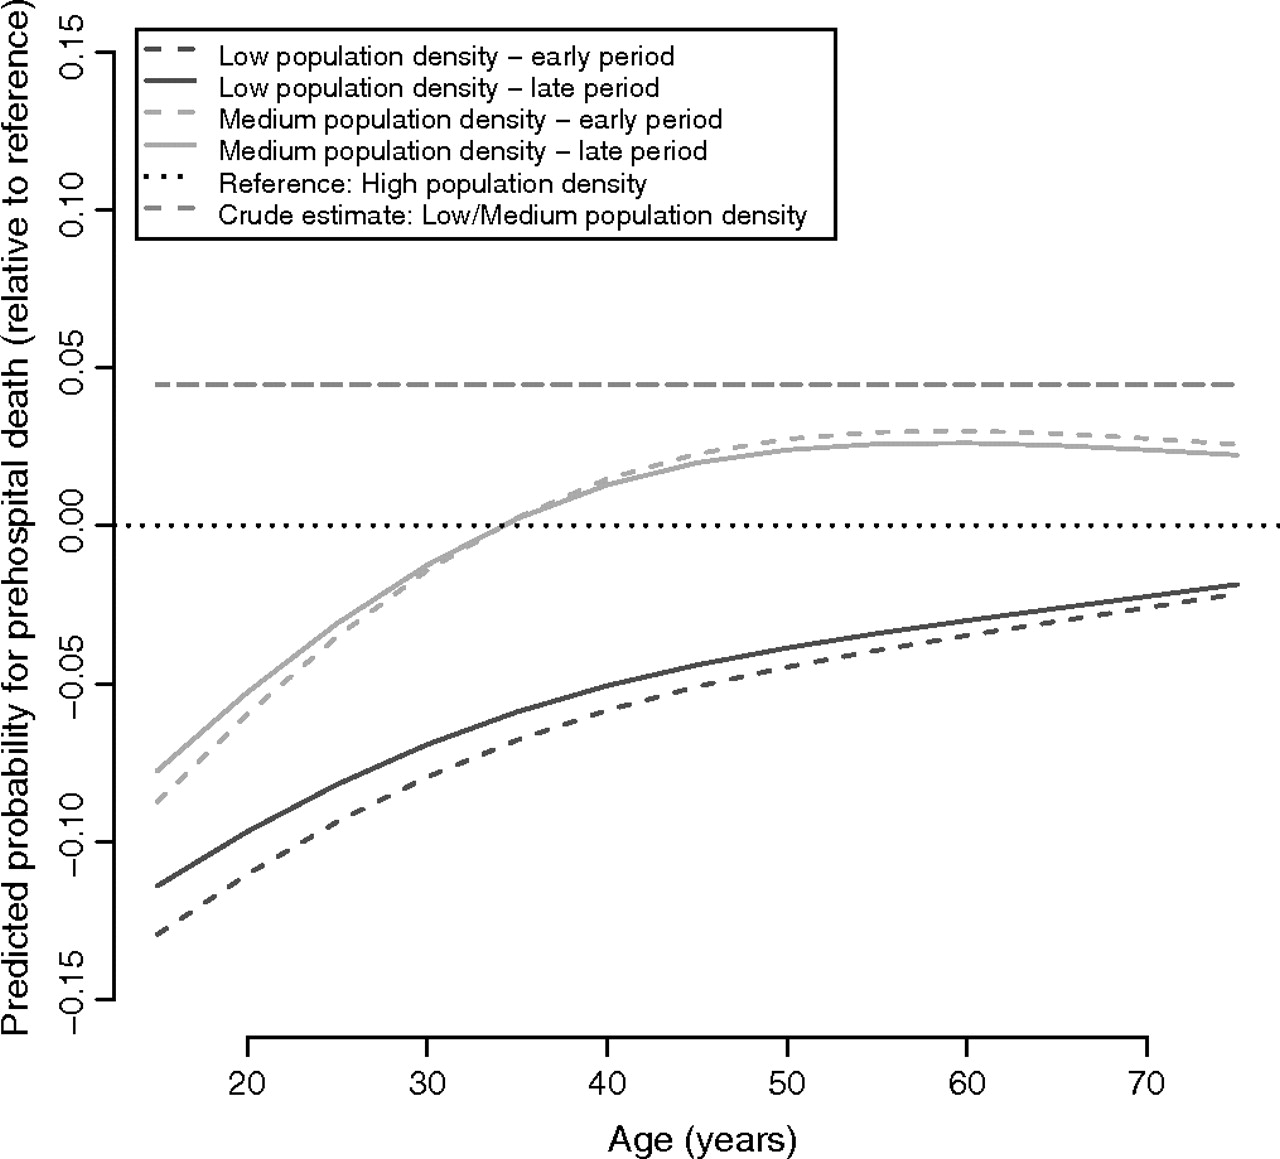
Adjustment for age, gender, type/severity of injuries and early versus late phase of the study period removed the apparent increase in mortality associated with low population density. If only the main effect of population density was entered in the multivariable model, the adjusted OR for medium population density was 0.91 (95% CI 0.69 to 1.20) and for low population density 0.85 (95% CI 0.60 to 1.21). These estimates, however, are not reliable because there is a statistically significant effect-measure modification by age of the individual. The magnitude of the association between population density and prehospital death is therefore visualised as the age-dependent difference in predicted mortality compared with the high population density region (figure 3). Unadjusted estimates are plotted, indicating an equally increased mortality in low and medium population density areas as also shown by the crude OR above. As indicated in figure 3, multivariable adjustment removed much of this predicted excess mortality, predominantly in younger individuals. This is also the dominant age category as shown by the age distribution of the injured persons depicted in the background of figure 3. At 25 years of age, when these injuries are most frequent, the predicted mortality was 3% lower in the medium population density regions and 9% lower in the low population density regions; these differences decreased with advancing age. At 65 years of age, the predicted mortality was 3% higher in the medium population density regions but 3% lower in the low population density regions. There was a notable period effect in which the differences in predicted prehospital mortality depending on population density decreased over time (figure 4).
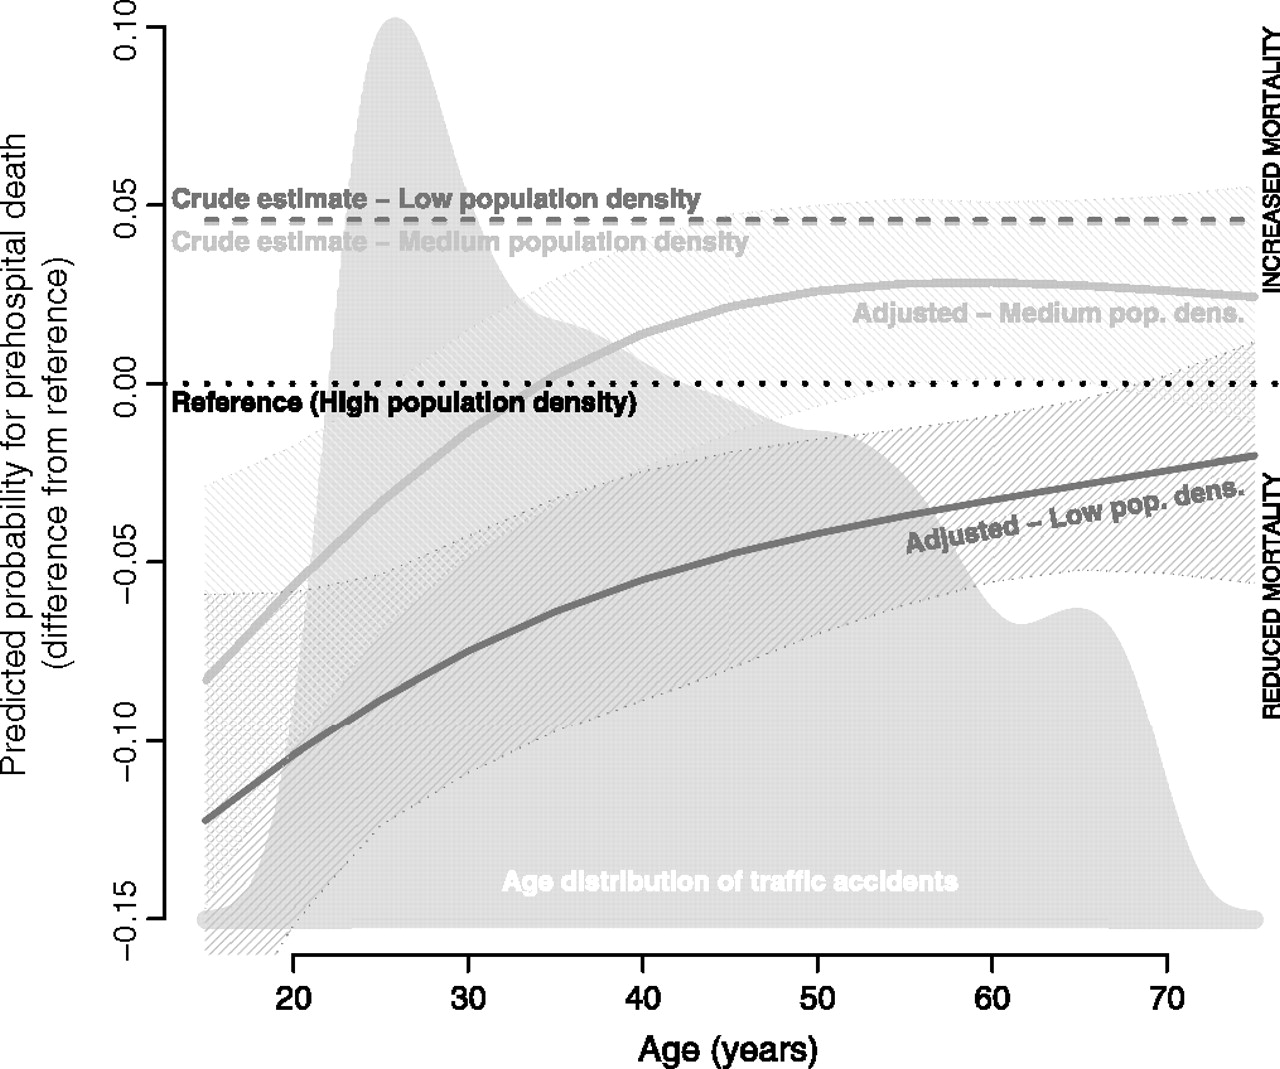
Difference in predicted mortality from a logistic regression model with high population density as the reference. Analysis of 6884 individuals in motor vehicle crashes in Sweden from 1998 to 2004 adjusted for age, gender, injury severity (International Classification of Disease Injury Severity Score) and type of injuries. Average values of predictors in the study population are used for the calculation. The grey area shows the age distribution, whereas the dotted black line indicates the reference level (high population density). The predicted responses from a crude (unadjusted) model for low and medium population density overlap and are indicated by the dashed lines. Adjusted predictions of prehospital mortality for low and medium population density are graphed with 95% CI (shaded areas).

Time-trend analysis to explore the association between regional population density and prehospital death. Analysis of 6884 individuals in motor vehicle crashes in Sweden from 1998 to 2004 adjusted for age, gender, injury severity (International Classification of Disease Injury Severity Score) and type of injury. The predicted responses from a crude (unadjusted) model for low and medium population density overlap and are indicated with the grey dashed line.
A similar multivariable analysis indicated no association between hospital mortality and low population density. The adjusted OR for low population density was 0.83 (95% CI 0.48 to 1.45) and for medium population density 1.06 (95% CI 0.69 to 1.67).
Sensitivity analyses
Categorising individuals in crashes based on regional population density in their place of residence can potentially bias risk estimates due to misclassification (eg, truck drivers or tourists involved in crashes a long way from home). We therefore performed an alternative analysis of hospital mortality in which patients were allocated to population density categories based on the location of the hospital to which the patient was primarily admitted. Therefore, 8% of hospital admissions were reclassified regarding population density, with 2.2% re-allocated to a higher and 5.8% to a lower population density category. This did not change the estimated OR (multivariable model 2 in table 4). A similar analysis for prehospital deaths is not possible because the death certificates contain no information on where the injury event took place.
Association between regional population density and mortality of hospitalised patients, estimated by OR from multivariable logistic regression models.
Another potential source of bias for analyses of hospital mortality is differences in the level of care provided by different hospitals. A total of 31 219 seriously, severely and critically injured patients from traffic crashes was hospitalised during the 7-year study period. As a proxy for hospital experience in advanced injury care, the numbers of patients admitted to each hospital in each region were calculated. This variable, added to the multivariable model, only further reduced the risk estimates for low and medium population density regions (multivariable model 3 in table 4).
Discussion
The increased prehospital mortality observed among individuals in motor vehicle crashes in low population density regions appears to be caused largely by factors that influence the type and severity of injuries. In comparison with the high population density area, predicted prehospital mortality among individuals in motor vehicle crashes in low and medium population density regions increases with age. Most of the apparent excess mortality in this crude comparison was removed after adjustment for covariates.
We also studied hospital mortality and found that the apparent excess mortality in low and medium population density regions was removed after adjustment for covariates. This finding indicates that possible predictors of outcomes related to healthcare services, such as prehospital time or EMS performance, are not the main explanations for the observed excess mortality in rural areas. They may, to some extent, affect the prehospital mortality of older patients in motor vehicles crashes. This association between age and mortality, evident in both low and medium population density regions, implies that older adults may be more vulnerable to the effects of injuries sustained in rural traffic crashes.
The fundamental idea underlying our analytical approach was to use regional population density as a proxy variable for the compound effect of differences in access to prehospital services, transport time to hospital and capabilities of the EMS. The analysis was restricted to motor vehicle crashes in which the patient was an occupant of the vehicle. This was for methodological reasons, to reduce confounding effects resulting from differences in types of traffic injury events in rural and urban areas. If injury patterns are substantially different, the results may not be directly relevant to traffic crashes in general or other types of blunt trauma. In our analysis we further assume that different crash characteristics affect mortality by means of injury type and severity (ie, injury type/severity are intermediates in the causal pathway between crash characteristics and death). By analysing the association between population density and mortality conditional upon injury type/severity (adjusting for them in the multivariable model together with age and gender) we are thereby able to separate pre-crash factors from post-crash factors. This holds true based on the assumptions that injury type/severity are intermediates between crash type and mortality and that the classification of injuries and estimated severity of injuries (ICISS) are unaffected by interventions from EMS. Because the ICISS is solely based on ICD-10 injury codes, which are almost exclusively anatomical descriptions of the injuries without physiological data, we consider these assumptions reasonable.
Interpretation of the results was complicated by the presence of a significant interaction between population density and age. Consequently, a meaningful adjusted estimate for the association cannot be given, and instead we present a graphical illustration of how differences in predicted mortality risks varied by age. As might be expected, the risk of mortality in low and medium population density regions was lower in younger patients compared with older patients. This observation is consistent with studies that have reported increased vulnerability of older trauma patients.27–29
Reports from several countries have shown that mortality rates among individuals in motor vehicle crashes are inversely related to population density.10–13 Possible explanations include factors related to road safety, vehicle standard and driver behaviour and performance.9 Several earlier studies have suggested that the additional time required for EMS to reach and transport the patient to a medical facility in rural areas can explain the increased mortality rates from motor vehicle crashes.30–32 The rapid improvement of EMS and trauma systems over the past decades, however, may have overcome these deficiencies. The effect of advanced life support programmes for trauma has not been established and a large controlled trial in an urban setting failed to show a benefit.33 Several investigators have tried to elucidate the effects of EMS performance in rural trauma. The results from these studies have been mixed and, at times, conflicting, but they have generally not controlled for differences in the cause of injury and type and severity of injuries.10–14 It has also been difficult to establish the impact of prehospital time on trauma outcome.34 A recent study indicated an association between increased prehospital time and higher mortality rates in a rural setting, but the results were not adjusted for differences in age, gender and the type/severity of injuries.35
Specific strengths in our study are the benefit of an exact record linkage using unique personal identification numbers in a large nationally representative and population-based dataset, combined with adequate control of important variables (age, gender and type/severity of injuries). In the analysis we also identified a time trend for the association indicating a reduced difference in mortality related to population density over the study period.
The use of administrative data for this type of study may have some limitations. Coding of injury in mortality data systems tends to be less specific than the coding of injury in hospital discharge data. The possibility for misclassification resulting from different coding practices in morbidity versus mortality data would be a concern for this study if it was differential depending on population density.
Using population density as a proxy composite variable for prehospital time and performance of EMS carries obvious limitations. The medium population density category in particular contains a variety of demographic patterns, different sizes of urban centres and possible differences in prehospital services. However, no major increase in mortality could be related to low population density, given the organisation present in different regions during the study period. Another possible limitation of this study is that the analytical strategy rests on two assumptions. First, that injury type and severity are intermediates on the causal pathway between different characteristics of the crash itself and their association with mortality. Second, that the classification of injuries and estimated severity of injuries (ICISS) are unaffected by interventions from EMS. Both these assumptions seem intuitive but are difficult to verify. As we restricted the analysis to individuals in motor vehicle crashes in order to reduce the effects of confounding variables, our findings may not be relevant to all traffic crashes or other types of blunt trauma, if injury patterns are substantially different.
In this nationwide population-based study of individuals in motor vehicles crashes, the association between population density and the prehospital mortality rate is age dependent. The increased mortality seen in low population density areas appears to be related to pre-crash factors and not to differences in access to or performance of EMS. The excess mortality in rural motor vehicle crashes should motivate further preventive measures.
What is already known on this subject
Mortality rates after motor vehicle crashes have been consistently shown to be inversely related to population density.
These increased mortality rates may be explained by a multitude of factors but it has not been possible to elucidate the role of the trauma care system.
What this study adds
The association between population density and prehospital mortality rate is age dependent.
The increased prehospital mortality observed among individuals in motor vehicle crashes in low population density regions appears to be caused largely by factors that influence the type and severity of injuries and not differences in access to or performance of EMS.
The excess mortality in rural motor vehicle crashes should motivate further preventive measures.
References
Footnotes
Funding This study was supported in part by the Laerdal Foundation for Acute Medicine, LPS Medical Foundation and the Swedish Research Council. The study sponsors had no involvement in the study design, in the collection, analysis and interpretation data, in the writing of the report, or in the decision to submit the paper for publication.
Competing interests None.
Ethics approval This study was conducted with the approval of the regional ethics committee, Uppsala University.
Provenance and peer review Not commissioned; externally peer reviewed.