Article Text

Abstract
Objective: To provide national estimates of non-fatal cyclist injuries treated in US hospital emergency departments (EDs) resulting from an encounter with a motor vehicle (MV) on the road.
Methods: Non-fatal injury data for 2001–4 from the National Electronic Injury Surveillance System All Injury Program were analyzed.
Results: An estimated 62 267 persons (21.5 per 100 000 population; 95% CI 14.3 to 28.7) were treated annually in US hospital EDs for unintentional non-fatal cyclist injuries involving an MV on the road. Among these cases, children aged 10–14 years (65.8 per 100 000) and males (35.3 per 100 000) had the highest injury rates. Many injuries involved the extremities (41.9%). The head was the primary body part affected for 38.6% of hospitalized/transferred patients, of which about 84.7% had a principal diagnosis of a concussion or internal head injury.
Conclusions: Effective road environmental interventions (eg, bicycle-friendly roadway design, intersections and crossings) along with efforts to promote safe personal behavior (eg, helmet use and following rules of the road) are needed to help reduce injuries among cyclists while sharing the road.
- ED, emergency department
- NEISS-AIP, National Electronic Injury Surveillance System All Injury Program
- MV, motor vehicles
Statistics from Altmetric.com
- ED, emergency department
- NEISS-AIP, National Electronic Injury Surveillance System All Injury Program
- MV, motor vehicles
In the US and elsewhere, bicycle riding is a popular and growing recreational activity and some use bicycles as a means of transportation to and from school and work. Although many riders engage in off-road sports (eg, mountain biking), others ride mostly on streets and highways. Bicycle crashes involving motor vehicles (MVs) on the road are of particular concern throughout the world because they generally result in more severe injuries.1,2 There are an estimated 800 million bicycles in the world and most of them are used on urban and rural roadways; in many countries, bicycle traffic injuries and deaths are not given proper attention.3
In the US, the National Bicycle Dealers Association reported that 18.3 million bicycles were sold in 2004.4 During 2002, 41.4 million Americans aged ⩾7 years were estimated to have ridden a bicycle ⩾6 times, according to a survey conducted by the National Sporting Goods Association.4 A conservative estimate by the US Bureau of Census suggests that 566 000 workers aged ⩾16 years use a bicycle as a means of transportation to work in 2000.5 For those riding on streets and highways, there is a risk of injury associated with sharing the road with MVs. From 2001 to 2004, 688 cyclists were killed in traffic crashes and cyclists accounted for 12% of all non-motorist traffic deaths annually.6 This study provides national estimates of unintentional, non-fatal cyclist injuries treated in US hospital emergency departments (EDs) resulting from an encounter with a MV during that same time period. These non-fatal injuries are characterized for riders of all ages.
METHODS
Data from 2001 to 2004 obtained from the National Electronic Injury Surveillance System All Injury Program (NEISS-AIP) were analysed. NEISS-AIP is operated by the US Consumer Product Safety Commission. It collects data, on initial visits, for all types and causes of injuries in patients treated in hospital EDs.7 Data are collected from a nationally representative subsample of 66 NEISS hospitals that were selected as a stratified probability sample of US hospitals. NEISS-AIP provides data on approximately 500 000 injury- and consumer-product-related cases each year. Trained hospital coders review all ED records daily to identify cases of injuries and abstract data from medical records on each identified case of injury. Data are obtained on patient demographics, treatment date, location where injured (eg, street/highway, home), primary body part affected, principal diagnosis, disposition at ED discharge and a brief narrative describing the circumstances of the injury-causing incident. NEISS-AIP has an extensive quality assurance program to ensure high-quality data, and these methods have been validated.8
Cases were defined as patients treated for an unintentional, non-fatal injury resulting from being struck by or striking a MV (car, truck, van or sport utility vehicle) or from avoiding a collision with a MV while riding a bicycle on a street or highway. The brief narrative was used by study researchers to verify cyclist injuries involving a MV and to code injury-related circumstances, including being hit by a moving MV, hitting a moving MV, hitting a parked or stopped MV, hitting or being hit by a MV pulling out or backing out, side swiped by an MV and swerved to avoid contact with a MV.
Each case was assigned a sample weight based on the inverse of the probability of selection; these weights were summed to provide national estimates of non-fatal cyclist injuries.9 Estimates were based on weighted data for 5281 patients of all ages treated at NEISS-AIP hospital EDs for cyclist injuries involving an MV on the road during 2001–4. Confidence intervals (CIs) were calculated using a direct variance estimation procedure that accounted for the sample weights and complex sample design.7 Rates were calculated using US Census bridged-race population estimates for 2001–4.10
RESULTS
From 2001 to 2004, an estimated 501 000 persons of all ages were treated annually in US hospital EDs for all types of unintentional cyclist injuries.11 Of these, 62 267 (12.4%; 21.5 per 100 000 population; 95% CI 14.3 to 28.7) involved an encounter with a MV on the road. The following results describe these latter cyclist injuries that occurred while sharing the road.
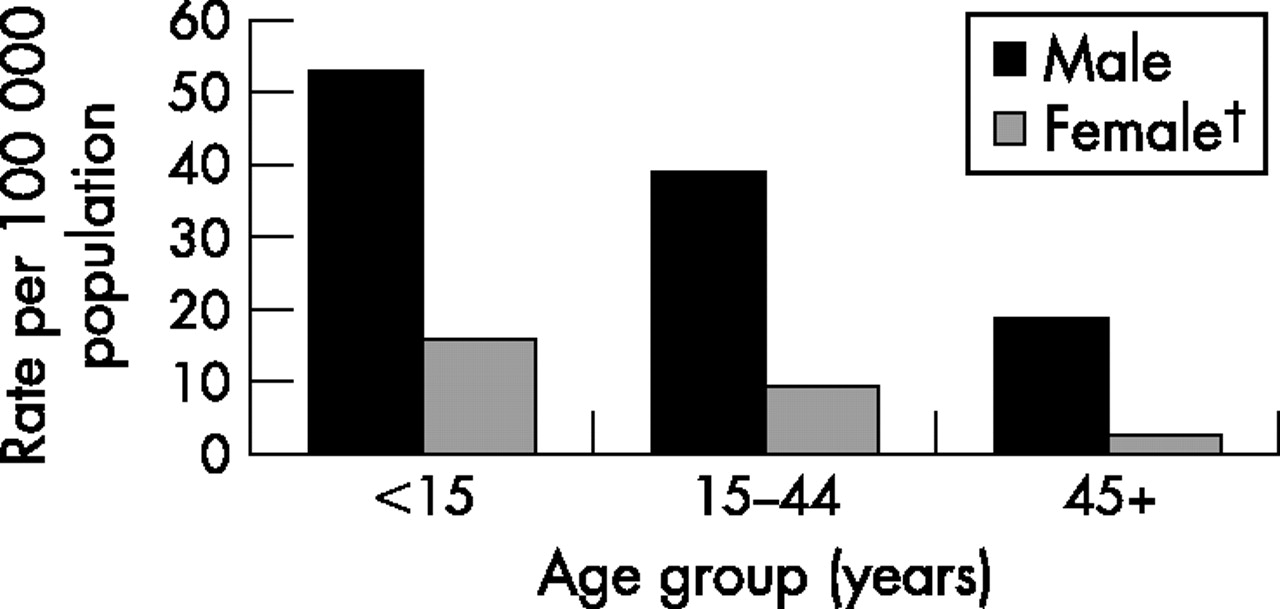
Children aged 10–14 years had the highest injury rate (65.8; 95% CI 50.4 to 81.3; table 1). Of those injured, most (80.7%) were boys and 12.5% were hospitalized or transferred for specialized medical care. Injury rates were consistently higher for men than for women across all age groups (fig 1). Contusions and abrasions were the most common principal diagnoses (44.2%). The most common primary body parts affected were the head/neck region (31.7%), the lower extremities (27.7%) and the upper extremities (14.2%; table 2). Fractures accounted for 20.4% of lower extremity injuries and 32.3% of upper extremity injuries. The head (excluding the face and ears) was the primary body part affected for 19.7% of injuries, of which 70.7% had a principal diagnosis of a concussion or internal head injury. From 2001 to 2004, over one-third (34.9%) were treated during the months of July to September.
Annualized national estimates, percentages and rates for persons with non-fatal cyclist injuries sustained while on the road, by selected characteristics, in the US, 2001–4
Annualized national estimate and percentage for persons with non-fatal cyclist injuries sustained while on the road, by primary body part affected and principal diagnosis, in the US 2001–4

Non-fatal cyclist injury rates, *by age and sex, in the US, 2001–4. *Rates for persons with non-fatal pedal cyclists injuries sustained from an encounter with a motor vehicle while on the road who were treated in US hospital emergency department. †Estimate may be unstable for females aged 15–44 years because coefficient of variation was 31%.
Riders were injured from being hit by a moving MV (80.6%), hitting a moving MV (9.9%), or hitting a parked or stopped MV (6.8%). Injuries involving parked or stopped MVs occurred mostly when cyclists were side-swiped by a moving MV resulting in a crash with a stationary MV, swerved to miss a moving vehicle, or collided with doors being opened on parked or stopped MVs.
Compared to all other types of cyclist injuries, those involving MVs were 2.6 times more likely to warrant hospitalisation or transfer for specialised medical care (12.5% vs 4.8%; p<0.001).11 For hospitalized or transferred cases with cyclist injuries involving a MV, the most common body parts affected were the head/neck region (44.7%), the lower extremities (26.5%) and the trunk (20.2%). The head was the primary body part affected for 38.6% of hospitalised or transferred cases, of which 84.7% had a principal diagnosis of a concussion or internal head injury. For hospitalised or transferred cases, fractures accounted for 90.3% of lower extremity injuries and 85.4% of upper extremities.
DISCUSSION
Cyclists of all ages who ride on streets and highways are at risk of an encounter with a MV (eg, crash with a MV and swerve to miss a MV) resulting in non-fatal injury or death. Consistent with other studies,12–16 our findings indicate that injury rates were highest for children aged 10–14 years; most of those injured were male; most occurred during the summer months; and riders injured during an encounter with a MV had more severe injuries. Internal head injuries and extremity fractures were the most common types of injuries among those who were hospitalised.
Over 90% of the 62 267 cyclists treated in US hospital EDs from an encounter with a MV were injured from being hit by or hitting a moving MV. Cyclist injuries also resulted from being side swiped by a moving MV and then hitting a stationary MV or object, swerving to miss a moving MV and hitting a stationary MV or object, and running into a car door of a parked car that was being opened. Other studies suggest that cyclists sharing the road are more likely to be injured from encounters with MVs at intersections, at bike trail crossings and on narrow roadways and bridges.13,14 Communities should develop cost-effective strategies to improve the safety of cyclists on roads that consider all of these factors. Built environment strategies that encompass community design, land use and transportation infrastructure are available to help and guide communities to make roadways and bridges more bike friendly.17,18 Also, national estimates of cyclist non-fatal injury rates from the NEISS-AIP can be useful to US public health and transportation officials as baseline data for comparison with local data to assess the magnitude of the problem in their communities.
Our findings emphasize the need to integrate built environment strategies with other strategies known to reduce the severity of cyclist injuries resulting from an encounter with a MV. Other strategies such as legislation to increase helmet use among cyclists, particularly younger children, while riding on the road should be given a high priority.16,19,20 Strategies to decrease the number of alcohol-impaired cyclists on the road could also reduce cycling-related deaths and injuries. Data from the National Highway Traffic Safety Administration indicate that 20% of the cyclists killed in traffic crashes in 2004 had blood alcohol concentrations at or above the legal limit for driving.6 A bicycling-injury study found that 23.5% of fatally injured and 8.9% of seriously injured cyclists had positive blood alcohol concentrations.21 Other interventions (eg, road design, bicycle lanes, outer wear and education) have been suggested to improve the safety of cyclists, but many have not stood the test of rigorous evaluation or, are in need of further testing to determine their effectiveness.12,15–25 For example, a systematic review of the international literature produced an estimated 10% decrease in the number of cyclist crashes with the use of cycle lanes, a 12% decrease with cycle lanes in signalized intersections and a 27% decrease for advanced stop lines for cyclists at signalized intersections. However, none of these decreases were statistically significant.22 Increasing cyclist visibility using fluorescent materials in bright colors during the day and lights and retro-reflective materials at night have been shown to improve driver detection but have not been shown to decrease cyclist crashes or injuries.23
The findings in this study are subject to at least four limitations. First, NEISS-AIP provides only national estimates and not state or local estimates. Second, NEISS-AIP provides data on patients treated in hospital EDs and does not include patients treated in outpatient settings or not treated at all. Third, data on helmet use was only reported for 953 (18%) of the 5281 sample cases; therefore, national estimates were not presented. Of these 953 sample cases, 209 (21.9%) were reported as wearing a helmet at the time of injury. Finally, population-based data were not available to calculate rates based on the number of riders, exposure time (eg, number and duration of bicycle trips) or riding experience. Efforts to collect these population-based data would be helpful to understand the relative risks of cyclist injuries among population subgroups in the US and elsewhere.
International efforts involving high-income, middle-income and low-income countries are needed to assess and implement cost-effective, practical interventions aimed at a safer environment for cyclists on the road. The World Health Organization has recognized reducing cyclist injuries as a priority area in world road traffic injury prevention.3 Changes in the road environment (eg, separating bicycles from other forms of traffic, bicycle lanes, traffic signals and signs aimed at cyclists, and creating clear lines of sight) along with efforts to promote safe personal behavior and practices (eg, using a bicycle helmet and safe bicycling practices) could be the key to reducing cyclist injuries and deaths. Data systems like NEISS-AIP have an important role in providing population-based data to assess the impact of these interventions through monitoring changes in cyclist injury rates over time.
Key points
-
This is the first US study to provide national estimates of non-fatal injuries to cyclists while sharing the road with motor vehicles (MVs).
-
Compared to all other types of cyclist injuries, those involving MVs on the road were 2.6 times more likely to warrant hospitalization or transfer for specialized care (12.5% vs 4.8%).
-
Although most (90.5%) of these cyclist injuries involved moving MVs, almost 7% involved hitting a parked or stopped vehicle.
-
Reducing cyclist injuries is an important aspect of world traffic road safety prevention efforts; prevention efforts should include improvement in the road environment along with promotion of safe personal behavior and practices.
Acknowledgments
We thank Tom Schroeder, MS, Cathy Irish and other staff of the Division of Hazard and Injury Data Systems, the US Consumer Product Safety Commission, for collecting and preparing the high-quality surveillance data used in this study in collaboration with the Office of Statistics and Programming, National Center for Injury Prevention and Control.
REFERENCES
Footnotes
-
Competing interests: None.
-
The findings and conclusions in this report are those of the authors and do not necessarily represent the views of the Centers for Disease Control and Prevention.