Article Text

Abstract
In England the use of bicycle helmets remains low as debate continues about their effectiveness. Time trend studies have previously shown an inverse association between helmet wearing rates and hospital admissions for head injury, but data on helmet wearing are often sparse and admission rates vary for numerous reasons. For the period of this study comprehensive data on helmet wearing are available, and pedestrians are used as a control to monitor trends in admission. Among cyclists admitted to hospital, the percentage with head injury reduced from 27.9% (n = 3070) to 20.4% (n = 2154), as helmet wearing rose from 16.0% to 21.8%. Pedestrian head injury admissions also declined but by a significantly smaller amount. The wearing of a cycle helmet is estimated to prevent 60% of head injuries.
- bicycle helmet
- head injury
- cyclists
- pedestrians
- CI, confidence interval
- ICD, International Classification of Diseases
- bicycle helmet
- head injury
- cyclists
- pedestrians
- CI, confidence interval
- ICD, International Classification of Diseases
Statistics from Altmetric.com
- bicycle helmet
- head injury
- cyclists
- pedestrians
- CI, confidence interval
- ICD, International Classification of Diseases
- bicycle helmet
- head injury
- cyclists
- pedestrians
- CI, confidence interval
- ICD, International Classification of Diseases
The British government openly recognises the efficacy of cycle helmets as it strives to achieve a 50% reduction in road death and serious injury by 2010.1 Despite this many cyclists in Britain continue to doubt their value and helmet usage remains low.2 Epidemiological studies have consistently shown benefit, but well publicised criticism of these studies from some quarters has negated their potential impact.3 Time trend studies have shown a strong association between helmet wearing rates and head injury related hospital admissions, but critics highlight the sparse data on helmet wearing and possible confounding by admission rates changing over time for other reasons.4 The availability of improved helmet wearing data from serial national surveys, and pedestrian as well as cyclist admission data over a six year period, offers the opportunity to address these concerns. We examined time trends in head and brain injury related hospital admission among English cyclists and pedestrians from 1995–2000.
Three large surveys in 1994, 1996, and 1999 (n>25 000 in each) showed a significant increase in helmet wearing among British cyclists. The overall percentage wearing a helmet rose from 16.0% to 17.6% and then 21.8%.2
METHODS AND RESULTS
The Hospital Episode Statistics database records all admissions to NHS hospitals in England. It records planned “elective” admissions and unplanned “emergency” admissions. Presentation at accident and emergency departments is not included, although for more serious injuries presentation may proceed to admission. An injured cyclist would usually present first at the accident and emergency department of a hospital and then be admitted if necessary. Deaths occurring before arrival at hospital would not be recorded. All cyclists and pedestrians injured in transport accidents are included, whether or not a motor vehicle was involved.
We extracted records of cyclists (cause code: V10–V14 or V17–V19) and pedestrians (cause code: V0) admitted as emergencies between 1 April 1995 and 31 March 2001. Only first episodes with completed discharge information were retained. Head and brain injury, hereafter referred to as head injury, was defined as fracture of vault or base of skull (S020 or S021), intracranial injury (S06), or other and unspecified injuries of head (S09). This grouping includes some minor conditions such as concussion, but these would need to be sufficiently severe to warrant hospital admission. International Classification of Diseases, 10th revision (ICD-10) codes were selected to match as closely as possible with the earlier study of cyclists using ICD-9 (injury codes 800, 801, 850–854 and cause codes E8261, E810–E825 fourth digit = 6). All other injuries were classified as “other”.
Data were grouped by month and head injuries were expressed as the percentage of admissions. Linear regression modelling was used to assess head injury trends over time. Overall changes among cyclists and pedestrians were modelled; cyclist data were also analysed by age (adult ≥16 years).
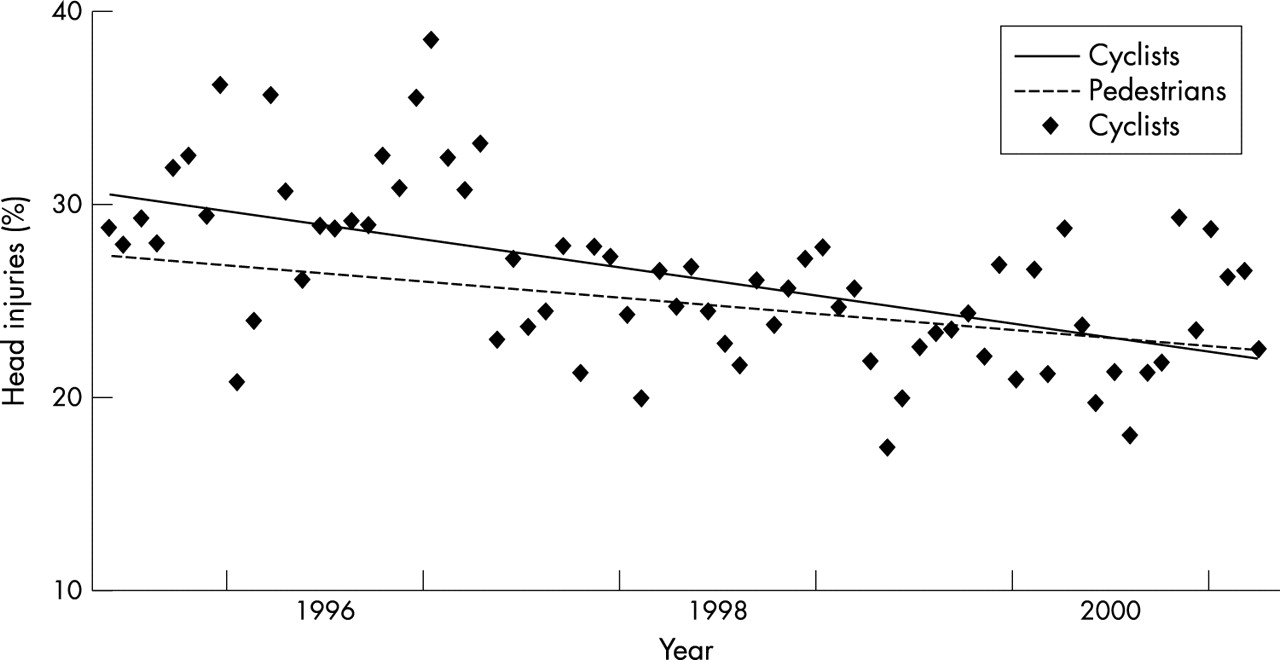
During the six year study period there were a total of 69 591 emergency cyclist admissions (0.2% of total emergency admissions). Of these, 16 436 (23.6%) were admitted for head injury. The percentage of cyclist head injuries decreased from 27.9% (n = 3070) in 1995/96 to 20.4% (n = 2154) in 2000/01, an estimated change of –8.49% (95% confidence interval (CI) –6.75 to –10.2) (fig 1).

Linear regression of head injury as a percentage of total admissions, cyclists and pedestrians, England 1995–2000.
Significant decreases were seen among adult and child cyclists. The percentage of head injuries among adults in 1995/96 was 24.7% (n = 1129), and estimated to change by –8.09% (95% CI –6.18 to –10.01). Among children, the percentage of head injuries was 29.6% (n = 1625) in 1995/96, and estimated to change by –8.32% (95% CI –5.35 to –11.28).
A total of 53 207 emergency pedestrian admissions occurred in the six years, of which 13 193 (24.8%) were due to head injury. Pedestrian head injuries declined significantly from 26.9% (n = 2256) in 1995/96 to 22.8% (n = 1792) in 2000/01, an estimated change of –4.94% (95% CI –3.79 to –6.10) (fig 1). The decline was similar among both adults and children, from 24.7% to 21% among adults and 33.2% to 29.2% among children. Modelling pedestrians and cyclists together, there was a greater reduction in cyclist head injuries (p=0.03).
DISCUSSION
This analysis, which was confined to the period in which ICD-10 was operational, shows that cycling related head injuries fell in children and adults during a period of increased helmet usage. During the same time period pedestrian head injury admissions also fell, suggesting a changing threshold for head injury admissions that might explain the reduction in cyclist serious head injury admissions. However, the reduction among cyclists was significantly greater than that among pedestrians.
We consider helmets to be the most plausible explanation for the extra reduction in cyclists, but other changes in the cycling environment may also have had an effect. Over recent years more cycle lanes and traffic calming measures have been introduced but, while these may reduce total cycling injuries, it is less likely that they would disproportionately reduce head injury. Changes might also have occurred in hospital admission policies but these would be expected to affect both cyclist and pedestrian groups equally. Pedestrians were chosen as a comparator group because changing patterns of transport use may have affected other groups, for example the average speed of motorcycle collisions has probably reduced as a result of rapid growth in the use of small motorcycles.
Key points
-
Cyclist head injuries are decreasing as helmet wearing increases.
-
The reduction in hospital admissions is not fully explained by changing admission policies.
-
The magnitude of the reduction is consistent with that reported from case-control studies.
Assuming that the difference between cyclists and pedestrians (3.6%) is attributable to helmet wearing, and with helmet wearing having increased by 5.8%, we estimate that helmets prevent 60% (3.6/5.8) of serious head injuries. An estimated efficacy of 60% is very consistent with that of 63%–88% obtained from case-control studies of cycle helmet efficacy. As evidence continues to mount, and consistency emerges between different study designs, the position of the sceptics becomes increasingly untenable.
Acknowledgments
AS is in receipt of an NHS R&D National Primary Care Training Award.